A comparative analysis of travel behavior between Chinese and Spanish university students Take Ningbo University and Balearic Islands University as an example
58
0
0
Texto completo
(2) A comparative analysis of travel behavior between Chinese and Spanish university students -Taking Ningbo University and Balearic Islands University as an example Catalog ABSTRACT ........................................................................................................ 4 1. Introduction .................................................................................................. 4 1.1 Objective of this study ............................................................................... 5 1.2 Significance of this study ........................................................................... 5 1.3 Research methods .................................................................................... 5 2. Literature review .......................................................................................... 6 3. The literature review of questionnaire designing ........................................ 10 3.1 Determining research goals .................................................................... 11 3.2 Determining target population and sample size ...................................... 11 3.3 Determining the recovery method ........................................................... 11 3.4 Questionnaire designing ......................................................................... 11 3.4.1 The structure of questionnaire .......................................................... 11 3.4.2 The structure of questions ................................................................ 12 3.4.3 Principles of design a questionnaire ................................................. 12 3.5 Run a pilot survey ................................................................................... 12 3.6 Carry out the main survey ....................................................................... 12 3.7 Analyze the data ..................................................................................... 12 3.8 The sample of questionnaire ................................................................... 12 3.9 The designing of the questionnaire for the study..................................... 13 4. Data analysis ............................................................................................. 17 4.1 Personal data analysis ............................................................................ 18 4.1.1 Gender distribution............................................................................ 18 4.1.2 Economic analysis ............................................................................ 19 4.2 Correlation analysis between nationality and travel behavior .................. 20 4.2.1 Comparison of the preference to travel ............................................. 20 4.2.2 Comparison of annual travel frequency, preference to travel period and trip length ................................................................................................... 21 4.2.3 Comparison of travel motivation........................................................ 25 4.2.4 Comparison of Travel Information Acquisition Channels .................. 26 4.2.5 Comparison of the ranking of the spending proportion on tourism products ..................................................................................................... 26 4.2.6Comparison of travel consumption behavior ...................................... 28 4.3 Correlation analysis of living expense and travel behavior ...................... 32 4.3.1 Correlation of living expense and transportation selection ................ 32 4.3.2 Correlation of living expense and accommodation selection ............ 32 4.3.3 Correlation of living expense and tourism products selection ........... 33 4.3.4 Correlation of living expense and food and beverage selection ........ 34 4.4 Correlation analysis of travel frequency and travel behavior ................... 35 4.4.1 Correlation between travel frequency and transportation .................. 35 2.
(3) 4.4.2 Correlation between travel frequency and accommodation .............. 35 4.4.3 Correlation between travel frequency and souvenirs ........................ 36 4.4.4 Correlation between travel frequency and food & beverage ............. 36 5. Conclusion ................................................................................................. 37 5.1 Summary of differences .......................................................................... 37 5.2 Possible destinations deduced ................................................................ 40 5.3 Application of this study’s conclusions .................................................... 44 5.3.1 Conducting sufficient market research is needed ............................. 44 5.3.2 Optimizing marketing strategy portfolio ............................................. 44 5.3.3 More powerful market supervision is needed .................................... 46 6. Study limitation .......................................................................................... 46 Appendix A ....................................................................................................... 52 Appendix B ....................................................................................................... 55 Appendix C ....................................................................................................... 57. 3.
(4) ABSTRACT: Nowadays the development of the tourism industry is becoming one of the most important factors in developing the world’s economy. In the huge tourism market, the tourist market of college students is becoming a tourism category that has to be valued in the current tourism market and has huge potential. However, due to the different levels of economic development, cultural background, and education in different parts of the world, the travel behaviors of university students from different countries are also very different. Studying the differences between these behaviors and conducting comparative analysis will provide a relevant theoretical basis for the development of the local and international college student travel market. This article analyzes the current situation of Chinese and foreign scholars' research on college students' travel behavior and summarizes the relevant literature. It also combines the present situation of Chinese and Spanish college students’ travel behavior. It mainly takes Ningbo University and Balearic Islands University as concrete examples to carry out the comparative analysis of college students' travel behavior. Key words: College Student Travel Market; Travel Behavior; Comparison between China and Spain. 1. Introduction According to Shitu Cao, Feiyu Zheng and Rong Huang (2006), tourism is a variety of physical and mental experiences where people use leisure, aesthetic and other spiritual pleasures as their main purpose, travel to places outside their daily, and stay for a short time. It is an off-site leisure lifestyle and cross-cultural communication activities of people and also one of humanity's most basic ways of life when society develops to a certain stage. With the development of human social, economic, cultural and education levels, people are paying more and more attention to the needs of the spiritual aspect. At the same time, because modern people are living under the pressure of learning, work, and life, their bodies and minds are often in a highly-stressed environment, so that contemporary people urgently need to release pressure, and travel has become the method chosen by many people. The tourism market continues to expand and there are many market segments which according to consumers' age, gender, nationality, beliefs, needs, and so on, are gradually divided, such as Grey Tourism, College Student Tourism, Religious Tourism and so on. Among them, the tourist market of college students has attracted much attention in recent years. Due to the improvement of education level in various countries, the number of contemporary college students is quite huge. At the same time, today's college students are different from those previous which with poor purchasing power. While on the contrary, their average level of consumption has greatly increased; and, with the progress of globalization, the student who is full of curiosity can easily reach out to many foreign cultures. This is one of the factors that greatly promote their demands to explore the world for travel or study abroad. Additionally, university students 4.
(5) often have plenty of time. Therefore, they gradually become the mainstream of tourism market. University students’ travel market has great potential and has also received more attention from the industry in recent years. In order to better develop the college student travel market, we must first understand the travel behavior of college students. Generally, there are many differences in the travel behavior of students in different countries, different cultures, and different economic situations. And because the author took part in the double degree program of Ningbo University and the University of the Balearic Islands in Spain, the author came to Spain to study for a year. The author took this opportunity to investigate students from Ningbo University and the Balearic Islands University and studied the differences in travel behavior among these two universities’ students. 1.1 Objective of this study The main objective of this study is, through survey data collection and analysis to understand the travel behavior of Chinese college students and Spanish college students. Then compare the difference and the same aspects of their travel behavior and understand the reason why this happens. Based on the result of data analysis and the comparison of the difference, several pieces of advice to better develop the college students travel market is given. 1.2 Significance of this study This is a study about consumers’ travel behavior and it also gives some evidence about their consumption behavior, so it will be meaningful for both Chinese and Spanish travel market, especially the college students’ travel market. Also, it will be helpful for Chinese travel market to know more about Spanish students travelers and the same it will be helpful for Spanish travel market to understand Chinese students’ travel behaviors. The market will accord this study to find some inspirations of how to better meet their potential consumers’ demands, for example, if they realize there will be the trend of this group of consumers and know how they will behave, so they can design more specific and suitable products, activities, discounts, and prices to attract more target consumers. And it will also be useful for the local government to predict tourism economy created by this group of special consumers. 1.3 Research methods This article mainly adopted three research methods: literature analysis, investigation method, and comparative analysis. 1. Literature analysis: It includes, firstly collecting and collating domestic and foreign relevant research materials, searching related reports, and research data of domestic and foreign authoritative organizations on college students' tourism market; then understanding the development of domestic and foreign and international college students' tourism market. After a lot of reading, the conclusion about the importance of studying college students' travel behavior is made. Then the author determines research topics and directions for this paper. 5.
(6) 2. Investigation Method: Through questionnaires, statistical analysis and other methods, the author has collected the first-hand data of students from Ningbo University and students from the University of Balearic Islands in Spain. Specific steps of the processes include the design of two questionnaires for Chinese and Spanish respondents; conduction of questionnaires survey; the collection of primary research data; data analysis through SPSS, EXCEL, etc. 3. Comparative analysis: The result of data analysis needs to be comparatively analyzed through quantitative comparative analysis and qualitative comparative analysis. After that, the traits and differences between students of Ningbo University and students from the University of Balearic Islands can be concluded. 2. Literature review In 1942, the Swiss scholars Walter Hunziker and Kurt Krapf defined in “Grundriss der Allgemeinen Fremfenverkenrlehre”, “Tourism is the sum of phenomena and relationships caused by non-resident travel and temporary stay. These people will not be permanently residing and will not be engaged in money-making activities.” As this definition was adopted in the 1970s by the “International Association of Tourism Scientific Experts (AIEST)”, it is referred to as the “AIEST definition”. According to Shiqiang Zhou (1998), tourism behavior refers to the characteristics of tourists' choices of travel destination, travel season, purpose of travel and mode of travel, as well as the characteristics of travel consciousness, travel effect and travel demand that are closely related to them (as cited in Weicheng Lv,2008.). According to Degang Wang (1999), in tourism research, tourists as the subjects of tourism and the study of tourism have always been valued by scholars from various countries (as cited in Weicheng Lv, 2008.). And according to Bin Dai (1999) and Degang Wang (1999), the research on tourists' behaviors in various countries is mainly conducted from the perspectives of economy, sociology, anthropology, and psychology (as cited in Weicheng Lv, 2008.). The concept of tourism behavior has a broad and narrow sense. According to Weicheng Lv (2008), the generalized tourists’ behavior refers to the space movement, amusement activities and related activities for tourists in a complete tourism process, including from the place of life to the destination, and the specific travel activities at the destination. And during this period of time, food, accommodation, shopping, and other actions, that is, tourists' food, accommodation, transportation, travel, shopping and entertainment are all six major links of tourism behavior. The narrow sense of tourism behavior mainly refers to the specific recreational activities of the tourists in the destination, that is, the part of the behavior that is closely related to the nature and characteristics of the tourism geographical environment. Tourists’ behavior is the most basic sign of tourists, with different levels and types. Analysis of tourists’ behavior is the basis for understanding and predicting the tourism market. To better understand the main aim of this study, making clear of the concept 6.
(7) of travel behavior is important. Travel behavior refers to the way in which tourists behave based on their attitudes before, during and after traveling (Subhajit and Rohit, 2016). Although it is easy to find various conceptions of travel behavior, they are generally based on different definitions and there is no consensus on the nature of travel behavior (Cheng, 2007, P17). In this study, the author will pick one conception that is the most suitable for the purpose of the study. Therefore the study is going to define the concept of travel behavior from the aspect of the consumption behavior of tourists. Consumer behavior is defined in a conception of a broad process involves consumers’ (individuals or groups) selection, purchasing, using or disposing of products, services, ideas or experiences to satisfy their needs and desires (Michael, Gary, SØren, and Margaret, 2013). And concerned with why, where, when, how often consumers buy, and about the impacts of consumption (Lidia, Frederic, and Sergey, 2015). Consumer behavior is one of the most researched topics in marketing or tourism field. In tourism field, when talking about tourists’ consumption behavior, that it is usually described as ‘travel behavior’ or ‘tourists’ behavior’ (Scott A., Girish and Miguel, 2014). According to Abraham and Yoel (1999) many studies of consumer behavior in tourism determined on that the travel motivation played a vital role in determining travel behavior about consumers preference of participating tourism activities and when, where, how often to join in and which type of tourism products to purchase. Combining previous literature, in this research the study of travel behavior will mainly focus on the perspective of motivation and do the survey on questions of when consumers would like to travel, how often they prefer to travel and their purchase preference of main kinds of tourism products like accommodation, transportation, etc. According to Richards and Wilson (2003), around one-fifth of all tourism journeys in the world are made by young people aged 15-25 years, among which students account for a big percentage (as cited in Xu, Michael, and Song, 2015). According to Claudia (2010), the travel market for college students has undergone a rapid transformation in the past decade and the demand has expanded rapidly. In the face of such a rapid development of the college student travel market, it is necessary to obtain information conducive to market development from the study of college students' travel behavior and demand. Youth tourism is one of the fastest growing industries in the tourism industry. According to Yvette and Felix (2004), the economic importance of the student market is significant. The group of college students is a very special group. First of all, they have a large quantity. They are well-educated, open-minded, curious, and willing to explore the world. They have plenty of time and with good purchasing power. For college students’ school holidays and extended vocations offer them time to travel (Mattila et al., 2001). As Theuns (1992) stated young tourists purchase locally produced goods and thus reduce leakages from the economy. Although young tourists spend less per day than the average tourist, their average stay at a destination is longer than of mainstream tourists (as cited 7.
(8) in Yvette and Felix, 2004). According to the National Bureau of Statistics China (2015), based on the statistical data of the tenth item of education, science and technology and culture published, there were 40.081 million undergraduates in 2015 in China. Among them, the general college recruits 7.214 million people, with 25.477 million students and 7.49 million graduates. According to Eurostat’s (2015) statistics, there are 19.5 million higher education students in 28 countries in the EU in 2015, of which 7.2% are short-cycle higher education courses, 61.4% are bachelor’s degrees, and 27.8% are master’s degrees, 3.7% for the doctorate. According to UNWTO (2010) statistics, nearly 20% of the 904 million international tourists in 2010 were young people. At the same time, the number of young tourists in China is growing at a double-digit every year. According to statistics from the UNWTO (2010), 66 million Chinese youth tourists travel overseas in 2010, which has an increase of 10% over the previous year. From the above data, it can be seen that the youth tourism market is a very promising tourism market with a development sequence. According to the ITB World Travel Trends Report (2013), young people around the world travel more, spend more and are more willing to explore new destinations. For a long time, youth tourism has been regarded as a small part of the tourism market, with low prices and low consumption levels. However, this situation has changed in recent years. According to the estimates of the World Tourism Organization (2013), the international tourism revenue generated from youth tourism 2012 was US$ 182 billion, accounting for more than 20% of the total tourism revenue over one billion international tourists. The average travel cost for a young person is $910. Moreover, according to the forecasts of the World Tourism Organization, the number of young international travelers may increase from the current 200 million person-times per year to 300 million people in 2020. According to the 2013 European IPK International Travel Supervision, the youth tourism market in Europe accounts for nearly half of the global market. In 2011, nearly 93 million people aged 15 to 29 traveled abroad. According to Qinghua Zhong (2015) Chinese college students are a huge new tourist group in China. The number of undergraduate students in the country is about 26 million, and the student groups usually have many vocations, and the time for travel is relatively abundant. The potential of the college student travel market is very large. According to statistics, the tourist market for college students has exceeded 10 billion yuan/year, and 71.6% of college students have a strong desire to travel and have sufficient free time. Travel has become one of their favorite ways of leisure. According to Hanming Zhan (2015), stated in the survey report of China Merchants Information Network 2015 titled “Tourism O2O Segmentation Prospect: New Trends in the Development of College Student Travel Market”, the group of college students has become the third most popular tourist group. The value of college students' tourism market is getting more and more 8.
(9) recognition. In July 2015, the State Council of China promulgated the "Several Opinions on Further Promoting Tourism Investment and Consumption" and clearly stated that "supporting the development of academic travel and integrating research travel into the overall quality education of students" (The State Council of China, 2015). According to Pat and Susan (1981), travel behaviors of individuals are very complex and different from each other because of many factors such as location, time, cultural background etc. Travel behavior surveys are used to explore the preference or pattern of travel of the target group of people (Ingunn, 2000). According to Goulias (2003) Kilgren (2003) and Kim (2003) survey about travel behavior, shows that more people prefer to travel along than with others. As Gordon and Karen (2011) stated, the amount of trips made is usually strongly related to incomes and also influenced by other variables such as gender, age, economic activities etc. According to Sarah (2014,p.167), students’ travel behavior do different from other adults, for example, students’ trips are shorter, more frequent, and more likely to take place at off-peak travel times. And these differences imply that the change of general traveling model to attract students to travel more is feasible and meaningful. Dann (1981), Chon (1989), Pearce (1982), Uysal&Hagan (1993) argued that motivation refers to physiological, sociological, needs and wants and biological, which include both internal and external factors (as cited in Kanyapat, 2015, p.14).Cha, McCleary, and Uysal (1995) and You et al. (2000) argued people from different cultures have different push-and-pull travel motivations that result in distinct tourist behavior (as cited in Bongkosh, 2008, P.422). While Cristina and Dwayne (2008) also think nationality, gender and age will influence tourists travel motivation. Age is an important factor that affects tourists’ choice of destination and activities and young students are more interested in activities that are more with adventure, practical and diversity (Sirgy and Su, 2012). In recent years, there are many studies on the travel behavior of college students in China. For example: Li Huo (1997) took college students from Harbin as an example to analyze the psychology of college students' travel consumption; Bihu Wu (2001) applied tourism psychology and behavioral geography to College students' tourism security perception was evaluated; Limei Li (2000) and Pingbin Jin (2004) took Zhongshan University and colleges in Hangzhou as samples to conduct sample surveys to analyze the travel behaviors of college students in the region (as cited in Weixin Wei,2016); Jiawei Liu (2006) and Jiawen Wu (2010) took universities in China and Japan and South Korea as the sample survey area to compare and analyze the tourist behavior of college students; Xuemin Cui (2016) conducted a SWOT analysis study of the domestic college student travel market; Cheng Yao (2017) took Nanjing as an example conducted investigation and analysis of contemporary college students' tourism consumption; Yan Li (2016) conducted a survey and analysis of the status quo and market demand of domestic college students; Xinyi Liu (2017) studied the development strategy of college students' tourism 9.
(10) market; Jinxiu Zhang (2017) studied the travel motivation of college students. Among Chinese study of college students' travel behavior, there are few relevant studies on the comparison of Chinese and foreign college students' travel behaviors. Reference literature can be found: “Comparative study of college students' travel behavior between China and Japan- Take some universities in Kunming and Tokyo as examples” Jiawei Liu (2006) and “the comparative study of Chinese and Korean college students' travel behavior.” Jiawen Wu (2010). In 2006, Liu Jiawei stated in the "Comparison of College Students' Tourism Behavior between China and Japan: A Case Study of Some Universities in Kunming and Tokyo". He said that students from China and Japan, due to their cultural environment and the economic strength of the two countries, their travel behavior are quite different (Liu Jiawei, 2006). Jiawen Wu pointed out in 2010 "Comparative Study of College Students' Tourism Behavior between China and South Korea" that because of the similarities in age, concept, education level, and economic level, college students have a lot in common in their travel behavior. However, college students from different countries often have different performances in their tourism behavior due to their different cultural backgrounds and economic environments. For example, in his research, apart from winter and summer vacations, Korean university students prefer to travel during weekends, while Chinese college students prefer to travel on legal holidays. The reason is that compared to China, South Korea has a small land area and the domestic traffic is advanced, while its statutory holiday is mostly only a day off thus it is a bit rush to travel (Jiawen Wu, 2010). According to Jiawei Liu (2006) and Jiawen Wu (2010), there are many differences between Chinese college students and Japanese and Korean college students who are Asian countries. Then, under the influence of different factors, such as cultural background, economic environment, and education system, Chinese college students and Spanish students located in Europe will have more differences in their travel behavior. Through the analysis of all the types of literature above, and combined with my own actual situation, I came to the subject of this study "Comparative Study of Chinese and Spanish University Students' Travel Behavior - Taking Ningbo University and Balearic Islands University as an example". 3. The literature review of questionnaire designing According to Cambridge Dictionary, ‘a questionnaire is a set of written questions used to collect information from a number of people’. The questionnaire survey is an investigation method that indirectly collects research materials in written form. According to Thomas (2001), the steps of designing a questionnaire are: define your research aims; identify the population and sample; decide questionnaire recovery method; questionnaire design; run a pilot survey; carry out the main survey; analyze the data. 10.
(11) 3.1 Determining research goals Before the start of the research survey, it is necessary to clarify the purpose of the study. The first thing to do is to clarify whether the study is aimed at academic or commercial research, and then combine the research topics to read the relevant literature. After clearing the aim of the study, it should know what information is going to be collected (Crawford, 1997) 3.2 Determining target population and sample size The sample is the target group of the questionnaire survey. The population or sample size is the number of samples that need to be collected. According to University of Missouri’s report, the definition of populations is a complete set of elements (persons or objects) that possess some common characteristic defined by the sampling criteria established by the researcher. And the definition of samples is the selected elements (people or objects) chosen for participation in a study; people are referred to as subjects or participants. 3.3 Determining the recovery method According to the different respondents to the questionnaire, they can be divided into self-administered questionnaires and substitutive questionnaires. According to different methods of questionnaire transmission, self-administered questionnaire surveys can be divided into newspaper survey questionnaires, postal questionnaire surveys, and sent questionnaire surveys. According to the manner in which they communicate with respondents, the questionnaires filled in by substitution questionnaires can be divided into interview questionnaires and telephone questionnaires. 3.4 Questionnaire designing 3.4.1 The structure of questionnaire According to Nigel, Nick, and Amanda (2009), the general structure of the questionnaire is composed of four parts: initial introduction, questions and answers, code and other information. The initial introduction is the self-introduction of the survey. The content of it should include: the purpose and significance of the survey, the ways and methods of selecting the respondent, the wishes and requirements of the respondent, the description of the questionnaire, the method and time of the reply, the anonymity and confidentiality of the survey, as well as the name of the investigator. The questions and answers are the main part of the questionnaire, which generally includes the question of the survey, the way to answer the question, and the guidance and explanation of the answer method. The code is the question asked in the questionnaire and the respondent's answer are all converted to A, B, and C. - or a, b, c..., etc., code and number, for the use of electronic computers for data processing of questionnaires. Other information includes the title of the questionnaire, the interviewee's address (which can be a number), the interviewer's name, visiting start time and end time, visit completion status, auditor's name, and review comments. These data are the important basis for reviewing and analyzing the questionnaire. 11.
(12) 3.4.2 The structure of questions According to Teresa (2005) and Auriat (2005), “Two important aspects of questionnaire design are the structure of the questions and the decisions on the types of response formats for each question” (P.22). Three structures of survey questions are classified: closed questions, open-ended questions, and contingency questions. The closed questions refer to the list of several major and even all possible answers to the question. The respondent then selects one (single choice) or more (multiple choice) of the answers. The contingency questions are the questions which have the logical relation to other questions. It only applies to a subgroup of respondents because some respondents’ answer of the last question shows senseless with the next question, so they should skip the next question. 3.4.3 Principles of design a questionnaire (1) The principle of objectivity, that is, the problem of design must conform to objective reality. (2) The principle of necessity, that is, we must design the most necessary issues around the survey topics and research hypotheses. (3) The principle of possibility, that is, must meet the respondent's ability to answer questions. No question should be raised beyond the subject’s ability to understand, remember, calculate, and answer. (4) The principle of voluntariness, which must consider whether the respondent voluntarily answered the question. Any question that cannot be answered voluntarily by the respondent should not be raised. According to Datastar (2010), there are several tips to better design the questionnaire. When setting the question, one shouldn’t use emotional language or leading questions and should avoid negative and double negative sentences. And the number of open-ended questions should be kept to a minimum. 3.5 Run a pilot survey As Chase (2007) stated, that it is necessary to test the survey in advance among friends. By conducting test surveys on a small number of target respondents, the problems and deficiencies in the questionnaire can be examined. 3.6 Carry out the main survey After the pilot survey and improve the questionnaire, the questionnaire is formally placed and samples are collected. 3.7 Analyze the data According to John’s article “The Data Analysis Process: 5 Steps To Better Decision Making” that data analysis tools and software such as Visio, Minitab, SPSS, Microsoft Excel and Stata are quite good software to do data analysis. 3.8 The sample of questionnaire Here the author cited the questionnaire from Kanyapat (2015) in his thesis, “Analysis of Push and Pull Travel Motivation of Foreign tourist to Local Markets A case study of Phuket, Thailand” as the sample. The complete questionnaire is 12.
(13) attached in the Appendix. 3.9 The designing of the questionnaire for the study Basing on the requirements of the above theories, the author designed two questionnaires for students of Ningbo University and of the University of Balearic Islands. Because the main objective of the study is to compare the travel behavior of these two groups of students, the content of two questionnaires are actually the same but only in different languages and some small modifies are made to better understand. After the initial designing of the questionnaire, the author runs a pilot test between a small number of a target group of students. With their advice on question setting, typesetting, grammar, etc, the author modified the questionnaire as the final version below. The questionnaire is designed in two sections: personal information and the preference of travel behavior. Starting with the initial introduction: 宁波大学学生旅游消费行为调查问卷 各位同学好! 我是宁波大学旅游管理系的大四学生,为进行毕业论文的撰写,展开关于 大学生旅游消费行为的问卷调查。填写本问卷大概需要 5-8 分钟,非常感谢您的 参与和支持。 [以下题目共有 3 种题型,除排序题之外均为选择题,请在选项前勾选,多选题请 选择不少于一个选项。排序题请根据题目中的提示进行排序。请按照您的实际情 况答题,谢谢!] Travel Behavior Questionnaire for the Students of the University of Balearic Islands Dear friends, I am a student of the University of Balearic Islands. This is a questionnaire survey on college students' travel behavior. Thanks for your participation and support. [There are 3 types of questions in the following questions, all of which are multi-select questions besides the sort questions. Please mark “√ ” before the options. Please select more than one option for multiple choice questions. ] In this part, it introduces who is carrying out the research and the objective of it. It also shows the method to answer the question. Section 1 Personal information: 一、个人基本信息 1. 您的性别是 [单选题] * ○男 ○女 2. 您每月的生活费在以下哪个区间 [单选题] * ○1500 元及以下 ○1500 元到 2500 元(含 2500 元) ○2500 元到 4000 元(含 4000 元) ○4000 元以上 Section 1 1. What is your gender? 13.
(14) ○Male ○Female 2. How much is your living expenses monthly? ○Less than 200€ ○200-500€(include 500€) ○500-1000€ (include 1000€) ○More than 1000€ It collects the respondents’ personal information, including the gender and the living expense monthly. Asking for gender is to realize whether the questionnaire is evenly distributed in the sample and in later comparison, it can also be an indicator for the compare of the difference between male and female. And knowing the living expense of target sample shows whether they have the financial support to travel and will help to analysis their next travel behavior. Section 2 the preference of travel behavior. 3. 您是否喜欢旅游: [单选题] * ○非常喜欢 ○喜欢 ○一般 ○不喜欢 ○非常 不喜欢 4. 您在大学期间平均每年的出游频率是: [单选题] * ○1 次 ○2~4 次 ○5~7 次 ○7 次以上 ○未在大学期间旅游,但是打算出游 ○未在大学期间旅游,也不打算出游 3. Do you like travel? ○I love travel very much. ○I like travel. ○Just so-so. ○I don't like travel. ○I hate travel. 4. How many times do you usually travel every year? ○1 ○2-4 times ○5-7 times ○More than 7 ○Not yet but I’m planning to. ○Never and I’m not planning to neither. These two questions show the respondents’ preference to travel and tell the travel frequency during college. With these two questions, it indicates if it is a valid questionnaire reply or not. For example, if the respondent chooses “I hate travel” for the question 3 that means he (she) may not go traveling at all, thus this respondent should be invalid. 5. 您最常选择的出游时间段是: [多选题] * □周末 □小长假(如五一清明等三天假期) □长假(如国庆 7 天长假) □寒暑假 □平日 6. 您一次出游通常会花费多少时间(序号 1 表示选择几率最大,序号 6 表示最少 选择): [排序题,请在中括号内依次填入数字] * [ ]1 天 [ ]2 天 [ ]3~4 天 [ ]5~6 天 [ ]7~14 天 [ ]14 天以上 5. When do you usually go travel? (Multiple selections) □Weekends □Weekdays □Short holidays (generally 3-4 days) □Long holidays (generally 7-10 days) □During summer and winter holidays 14.
(15) 6. Rank your preference of how much days you would like to spend for a trip (This is a ranking question. No. 1 indicates the highest probability of selection and No. 6 indicates the least. Please write the numbers before the options.) [ ]1 day [ ]2 days [ ]3-4 days [ ]5-6 days [ ]7-14 days [ ]More than 14 days In these two questions, they are about the preference of when to travel and how much time spent on traveling. Between these two questions there is a logical relationship and from the data collected it could tell cause of the difference, generally it is because of the difference between the Chinese and Spanish culture and the arrangement of holiday system by government. And understanding when and how much time they would like to travel can also help the destination to better organize activities or promotions during that time and be well prepared to welcome them. 7. 您的旅游动机主要是: [多选题] * □游山玩水,娱乐消遣 □了解历史文化、风土人情 □结交新朋友 □探险与猎奇的需要 □疗养防病,强身健体 □探亲访友 □宗教活动 □调节心情,舒缓紧张的工作学习生活 □购物需要 □工作需要 7. What do you travel for? (Multiple selections) □Enjoy natural landscape □ Learn history, language, etc □Make new friends □To participate in extreme sports □To visit relatives, friends □Physical fitness □To participate in religious activities □To relax □Shopping □For working purpose Question 7 shows the travel motivation of the respondents. Different people may have different travel motivations. Between different countries and culture because of their different backgrounds, it influences their choices to visit a place and why or what they travel for. In this question, the data collected will show the big difference and from that, we can also think more about the reason. 8. 您的旅游信息获取渠道有: [多选题] * □旅游评价网站(例如驴妈妈、马蜂窝、穷游网等) □旅游目的地官方宣传网站及其官方公众号宣传 □社交类微博微信公众号及今日头条等社交软件的推送 □视频网站(哔哩哔哩、优酷等)up 主的推荐 □在线旅游产品销售网站(例如携程、途牛、Expedia 等) □朋友或亲戚推荐 □电视/广播节目 □杂志期刊 □旅行社及其官方网站和公众号宣传 □其他 8. Which channels do you usually use to get the travel information? 15.
(16) (Multiple selections) □Tourism evaluation website (like TripAdvisor) □TV show □The official website and social account of the destination □Social applications (like Facebook, Instagram etc.) □Video site (like YouTube) □Online travel agencies (like Expedia etc.) □The recommends of friends □Traditional travel agency and its website and social account □Magazines Question 8 shows how the consumers get information about their travel decisions. As Zheng, Vincent, Daniel (2014) stated that with the development of information technology (IT) and Internet, the tourism industry has changed a lot. Nowadays more and more tourism products are rolled out online with OTA or online social website or Apps. However, the development of these online organizations is quite different between China and Spain. Generally speaking, Spain develops better than China. For this reason, it implies that those consumers attitude or their search preference should be different. With this question, we can aware the actual fact of this industry’s information dissemination. And based on this several pieces of advice can be given to the market about how to better promote themselves. 9. 您对在旅游过程中的各个项目消费比重的排序(序号 1 表示所占消费比重最大, 序号 6 表示所占消费比重最小) [排序题,请在中括号内依次填入数字] * [ ]住宿 [ ]餐饮 [ ]交通 [ ]景点门票 [ ]购物 [ ]娱乐 10. 您在出游过程中通常会选择哪些交通工具: [多选题] * □飞机 □火车/高铁 □长途汽车 □自驾车 □公交车 □出租车 □船 □其他 11. 旅游时,您一般会选择哪种住宿方式: [多选题] * □星级酒店 □青旅 □同学朋友家 □Airbnb □自带帐篷 □经济型酒店 □其他 12. 您旅游是否会购买纪念品: [单选题] * ○每次都买 ○经常会买 ○偶尔会买 ○从来不买(选择此项请跳过第 16 题) 13. 您在旅游时主要购买哪些旅游商品: [多选题] * □土特产 □文物古玩 □手工艺品 □各类纪念品 □医疗保健品 □其他 14. 您在旅游时选择什么样的饮食: [多选题] * □团餐 □地方特色美食、小吃 □快餐 □便利店零食 □自己做饭 □景区餐饮 □其他 9. Rank the expenditure of various items in a trip (No.1 represents the largest share of expense, and No.6 represents the smallest share of expense). [ ]Accommodation [ ]Food & Beverage [ ]Transportation [ ]Tickets for attractions [ ]Shopping [ ]Entertainment 10. Which type of transportation do you usually choose when travelling? 16.
(17) (multiple selections) □Airplane □Train □Coach □Self-driving □Bus □Taxi □Ship □Other ways 11. Which type of accommodation do you usually choose when travelling? (multiple selections) □Star hotels □Youth hostel □Friends' home □Airbnb □Camping □Budget hotel □Others 12. Do you usually buy souvenirs? ○Every time ○Usually ○Sometimes ○Never( If you choose this option you should skip the question 13) 13. Which type of things you usually buy when travelling? (multiple selections) □Special local products □Antiques □Handicrafts □Various souvenirs (like postcards, key rings etc.) □Health care products □Others 14. What do you usually choose to eat when travelling? (multiple selections) □The food included in the package tour □Local specialties, snacks □Fast food □Snacks bought in the supermarket □Cook by myself □Food in the restaurants around the attraction □Others Questions 9-14 are all about consumers consume preference when traveling. Question 9 shows the ranking of how the respondents take the importance of the 6 travel factors. Then questions 10-14 show the preference of each factor. The analyz of these questions can show the consumption difference of the group and give inspiration to the department to better cater them. For example, many Chinese students show they will buy souvenirs when traveling, so the souvenir shop could be well prepared to welcome them. And here the question 12 and question 13 have a logical relationship, that if the respondents choose “never” when answer question 12 then he (she) should not reply on question 13, otherwise it will be meaningless. 4. Data analysis After the questionnaires were collected, all questionnaires were imported into the computer and SPSS, Excel was used for data analysis. The main purpose of this survey is to analyze whether there are differences between Chinese and Spanish university students' travel behaviors. And when doing data analysis it mainly adopted frequency analysis, correlation analysis, cross-tabulation analysis, mean analysis, ANOVA analysis, and other analysis methods. Correlation analysis is a statistical analysis method that studies the correlation between two or more random variables with the same status. It is the 17.
(18) process of describing the closeness of the relationship between objective things and using appropriate statistical indicators. In this study, Pearson Correlation Coefficient is used to analyze the correlation between different variables. The greater the absolute value of the correlation coefficient, the stronger the correlation is the closer the correlation coefficient is to 1 or -1, the stronger the correlation is, and the closer the correlation coefficient is to 0, the weaker the correlation. Normally, the relevant intensity of a variable is determined by the following range of values: Correlation coefficient 0.8-1.0 extreme strong correlation 0.6-0.8 strong correlation 0.4-0.6 moderate correlation 0.2-0.4 weak correlation 0.0-0.2 very weak or no correlation The significant test must be conducted before giving conclusions to correlation. The significance test is used to determine whether there is a difference between the effects of the experimental treatment group and the control group or the two different treatments and whether the difference is significant. Usually, the significant level is 0.05,0.01 or 0.001. The smaller the level, the better the evidence is for determining significance. Only when the result of significant test ‘significance’ is smaller than the significant level, then could we keep on observing on correlation coefficient to see if there is correlation or not. 4.1 Personal data analysis 4.1.1 Gender distribution During this survey, it collects 317 valid questionnaires and among them, 231 questionnaires are collected from China Ningbo University and 86 questionnaires are collected from Spain the University of Balearic Islands. The proportion of male and female respondents in the Chinese side is close to 3:7, which is in line with the distribution of male and female sex ratios among Ningbo University students. The ratio of male and female of Spanish respondents is close to 1:1. Overall, the data collection of students of different genders in the two schools was evenly distributed. Table 1.Gender distribution of respondents 1、What's your gender Category Total Male Female 51 180 231 Chinese university students 22.08% 77.92% 100.00% 41 45 86 Spanish university students 47.67% 52.33% 100.00% 92 225 317 Total 29.02% 70.98% 100.00% 18.
(19) 4.1.2 Economic analysis Through the level of living expense is easy to understand the financial ability of students. When designing the questionnaire, the question about living expense level of both countries is not exactly the same which is owing to the consideration of the differences between both countries’ economic level and consumption level. And here as some of the Spanish students rent houses off the school. When conducting the survey, they are asked not to include the house rent in this expense so as Chinese students. Table 2.Comparison of living expenses China Spain Category Category N Percentage N Percentage Less than Less than 138 59.74% 31 36.05% 1500¥ 200€ 200-500€ 1500-2500¥ 70 30.30% (include 44 51.16% 500€) 500-1000€ 2500-4000¥ 23 9.96% (include 11 12.79% 1000€) More More than 0 0.00% 0 0.00% than4000¥ 1000€ Total 231 100.00% Total 86 100.00% Pearson P=0.174** Significance. sig=0.001** * p<0.05 ** p<0.01. Consider Chinese and Spanish currency value are different, purchasing power parity is used to transfer the Chinese living expense into the same value as that of Spanish to make it easy to do the comparison. Purchasing power parity is an equivalent coefficient between currencies calculated based on different price levels in each country. The purchasing power parity exchange rate is used to compare the living standards of different countries. According to the data from Organization for Economic Co-operation and Development, the purchasing power parity indexes of China and Spain in 2017 are 3.554/$ and 0.656/$. With the formula: Y€=(Y¥*PPP€/$)/(PPP¥/$), Y means the quantity of money, PPP means the purchasing power parity, it can transfer the quantity of money of Chinese into that of Spanish. Here is the result: 1500¥ is equal to 276.87€; 2500¥ is equal to 461.45€; 4000¥ is equal to 738.32€. According to the chart, we can see the proportion of Chinese students’ living expenses of the level ‘less than 1500¥ (about equal to 276.87€)’ is 59.74%, the level ‘1500-2500¥ (about equal to 276.87-461.45€)’ is 30.30%, the level ‘2500-4000¥ (about equal to 461.45-738.32€)’ is 9.96% and the level ‘More than 19.
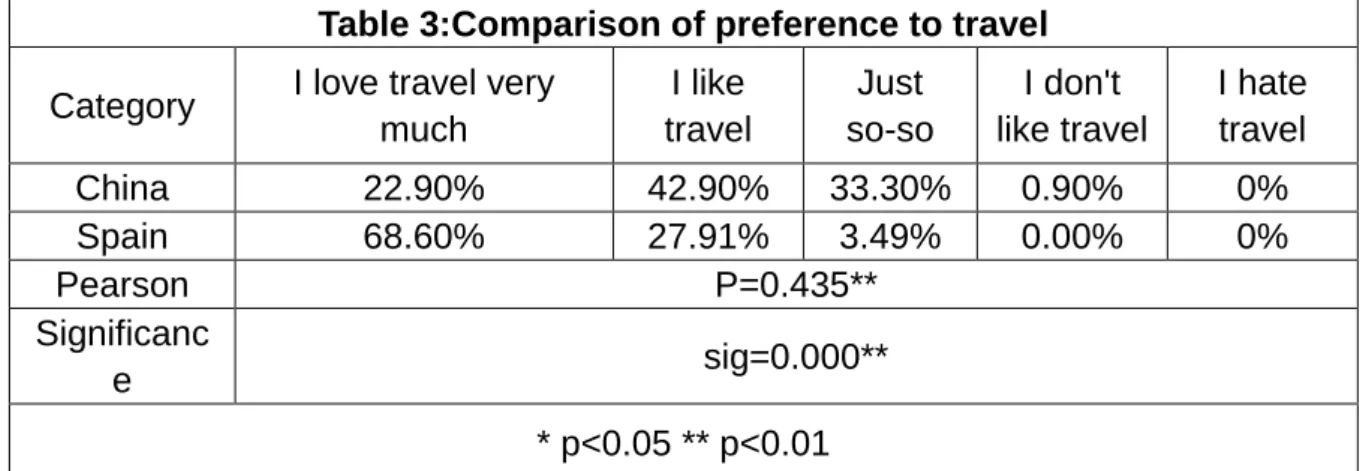
(20) 4000¥ (about equal to 738.32€)’ is 0.00%. The level of living expense of most Chinese respondents is ‘less than 1500¥’. The proportion of Spanish students’ living expenses of the level ‘Less than 200€’ is 36.05%, the level ‘200-500€’ is 51.16%, the level ‘500-1000€’ is 12.79% and the level ‘More than 1000€’ is 0.00%. The living expense level of most Spanish respondents is ‘200-500€’. Although the settings of this question are not exactly the same, it is designed according to both countries economic level, currency exchange ratio, and consumption level. It is easy to see the difference between both groups of respondents. The Spanish students’ proportion of higher level of living expense is much higher than that of Chinese students’. At the same time, the proportion of level ‘less than 1500¥ (about equal to 276.87€)’ of Chinese respondents is about 1/6 of total respondents while that of Spanish respondents is only about 1/4 of the total. The sample passed the significance test, which the significance=0.001, smaller than 0.01. And the Pearson Correlation Coefficient (in the following text abbreviation ‘P’ is used to take place Pearson Correlation Coefficient) is equal to 0.174, that shows there is a significant weak positive correlation between nationality and the level of expense. It means that the Spanish college students’ level of living expense is relatively higher than that of Chinese students. The result of correlation analysis is as the same as the result of frequency analysis. Thus the conclusion can be made that, the living standard of Spanish students is higher than that of Chinese students. 4.2 Correlation analysis between nationality and travel behavior 4.2.1 Comparison of the preference to travel Table 3:Comparison of preference to travel Category China Spain Pearson Significanc e. I love travel very much 22.90% 68.60%. I like travel. Just so-so. 42.90% 33.30% 27.91% 3.49% P=0.435**. I don't like travel. I hate travel. 0.90% 0.00%. 0% 0%. sig=0.000** * p<0.05 ** p<0.01. Observing the chart, it can be observed that the proportion of Chinese respondents who like to travel and love travel is 65.8%, and the proportion of Spanish respondents who like to travel and love travel is 96.52%;and in this question, very few of both Chinese and Spanish respondents choose ‘don’t like travel’ or ‘hate travel’. Therefore, overall speaking respondents from both countries like to travel. Among them, the proportion of Spanish respondents who love to travel is 68.6%, while the proportion of the Chinese respondents who choose this option is only 22.9%. And the proportion of Chinese respondents who choose option ‘just-so so’ is about 33.3%, while just 3.49% of Spanish 20.
(21) respondents chose this option. All these statistics show that Spanish respondents love to travel more than that of Chinese respondents. The sample passed the significance test, which the significance=0.000, smaller than 0.01. And the ‘P’ is equal to 0.435, which shows there is a significant moderate positive correlation between nationality and the preference to travel. It means that the Spanish college students’ preference to travel is significantly higher than that of Chinese students. The result of correlation analysis is as the same as the result of frequency analysis. Thus it can be deduced that although most of both groups like travel, Spanish respondents are love travel more than Chinese respondents. The difference on the preference to travel could because of the difference on how both countries’ people are used to express themselves. Generally speaking, Chinese people are shy to express very strong feelings about something, while Spanish people are more used to that. And their subjective comprehension of ‘travel’ may also influence the results. 4.2.2 Comparison of annual travel frequency, preference to travel period and trip length 4.2.2.1 Comparison of annual travel frequency Table 4.Comparison of annual travel frequency Never Not yet More and I’m but I’m Category 1time 2-4times 5-7times than 7 not planning times planning to to neither China 19.00% 60.20% 6.90% 2.20% 9.10% 2.60% Spain 19.77% 60.47% 9.30% 8.14% 2.33% 0.00% Pearson P=0.066 Significance sig=0.028* * p<0.05 ** p<0.01 Table 5.The annual frequency of travel Never and Not yet but 3trip I’m not Averag 1trip 6trips 7trips I’m N Sum s planning e planning to to neither China 44 139 16 5 21 6 231 592 2.5 Spain 17 52 8 7 2 0 86 270 3.1 The middle number of the interval is selected to calculate The average frequency of total respondents of Spain is about 3.1 times while which of Chinese respondents is 2.5 times, which means overall speaking that the average annual travel frequency of Spanish respondents is relatively higher than that of Chinese respondents. The sample passed the significance test, which the significance=0.028, smaller than 0.05. And the ‘P’ is equal to 0.066, which shows there is a 21.
(22) significant very weak positive correlation between nationality and the annual travel frequency. It means that the Spanish college students’ annual travel frequency is very weakly higher than that of Chinese students. The result of correlation analysis is as the same as the result of frequency analysis and mean analysis. Thus it can be deduced that the annual travel frequency of Spanish respondents is higher than that of Chinese respondents. The main reason can be told that the Chinese college students don’t love traveling as much as Spanish college students. Thus they don’t have much willingness to travel. And whether they have suitable time to travel will also influence on their travel frequency. Additionally, the economic level of Chinese students is much lower than that of Spanish students, the limitation of money can be the main restriction for them to travel. 4.2.2.2 Comparison of preference to travel period Table 6.Comparison of preference to travel period Short During Long holidays holidays summer and Weekends (generally 7-10 (generally winter days) 3-4 days) holidays. Weekdays. China. Percentage. 39.00%. 55.40%. 42.00%. 57.10%. 12.10%. Spain. Percentage. 29.07%. 66.28%. 23.26%. 23.26%. 11.63%. Pearson. -0.091. 0.098. -0.173. -0.302. -0.007. Significance. 0.103. 0.081. 0.002**. 0.000**. 0.904. Total percentages are based on respondents. * p<0.05 ** p<0.01 Observing the charts, we can see the comparison of preference to travel period between Chinese and Spanish respondents. The three mostly chosen periods of Chinese respondents are ‘during summer and winter holiday (57.1%)’, ‘short holidays (55.4%)’ and ‘long holidays (42%)’. While the three mostly chosen period of Spanish respondents are ‘during short holidays (66.28%)’, ‘weekends (29.07%)’ and ‘long holidays (23.26%)’ the same as ‘during summer and winter holidays (23.6%)’. The proportion of Chinese respondents’ choices is more balance while the most option of Spanish respondents is the short holiday. In options ‘long holiday’ and ‘during summer and winter vacations’, the sample passed the significance test. To option ‘long holiday’, the significance =0.002, smaller than 0.01 and the ‘P’ is equal to -0.173 which show there is a significant very weak negative correlation between nationality and the preference to travel during long holidays. To option ‘during summer and winter vacations’ the significance=0.000, smaller than 0.01 and the ‘P’ is equal to -0.302, which shows there is a significant weak negative correlation between nationality and the preference to travel during summer and winter holidays. It 22.
(23) means more Chinese students prefer to travel during long holidays and summer & winter holidays than Spanish students. In the other two options, the sample didn’t pass the significant test, which means there no significant difference between both countries’ respondents to those two options. The result of correlation analysis is as the same as the result of frequency analysis and mean analysis. Thus it can be deduced that Chinese respondents prefer to choose more time periods to travel while the Spanish respondents mainly concentrate on short holidays to travel. According to the above data analysis results, there are some differences in the preference to travel period between Chinese college students and Spanish college students. The main reasons for this discrepancy are the differences in the statutory holiday arrangements between the two countries and the different arrangements for students’ courses and tests. In China, there are only 11 days of national statutory holidays, and in addition to the 3 days holidays of the Spring Festival and National Day, the rest of the holidays are only one-day holidays. In general, during these holidays, the attractions are normally very crowded with too many tourists and many students will choose other off-time periods to avoid the crowd. Besides, college students also have a one-month winter vacation and a two-month summer vacation. Therefore, for Chinese college students, the summer and winter vacation with more leisure time will be the best time for traveling. Compared with the relatively small number of legal holidays in China, there are more holidays in Spain. Among them, long holidays are like Christmas and New Year during December to January, Holy Week and Easter during March to April. In addition, there are many national or state festivals almost every month. Abundant vacations offer Spanish students plenty of time to travel. During winter and summer vacations, students are more likely to stay home because of the arrangement of the exam weeks and celebration some festivals with their families, such as Christmas and New Year. 4.2.2.3 Comparison of preferred trip length Form 7. Comparison of preferred trip length China Category N Sum Mean ANOVA 1 day 231 925 4.004329 2.952155 2 days 231 689 2.982684 2.069264 3-4 days 231 448 1.939394 1.222398 5-6 days 231 665 2.878788 1.602635 7-14 days 231 926 4.008658 1.591229 More than 14 231 1197 5.181818 1.662451 days ANOVA analysis P-value=1.16E-134 Spain 23.
(24) Category N Sum Mean ANOVA 1 day 86 462 5.372093 1.38933 2 days 86 362 4.209302 1.132148 3-4 days 86 245 2.848837 1.682763 5-6 days 86 184 2.139535 1.297948 7-14 days 86 234 2.72093 1.66238 More than 14 86 320 3.72093 3.568263 days ANOVA analysis P-value=1.44E-53 This is a ranking question and is analyzed using the mean analysis and ANOVA analysis method. Firstly it needs assign values to each option. Since the setting of the question is that the most preferred option should be ranked first, and the least preferred option is ranked sixth, based on this, the first to sixth places are assigned value 1-6. Therefore, in the mean analysis, the option to get the minimum mean should be selected as the first option. The variance of each category is relatively small, most of them are around 1, which shows the data is stable and the value of P=1.16E-134, which is very small which shows the result is significant. According to each mean value, it shows that the order that best meets the preference to time spent in one trip of Chinese respondents is the first ‘3-4days’, the second ‘5-6days’, the third ‘2days’, the fourth ‘1day’, the fifth ‘7-14days’, and the sixth ‘more than 14days’. And the order that best meets the preference to time spent in one trip of Spanish respondents is the first ‘5-6days’, the second ‘7-14days’, the third ‘3-4days’, the fourth ‘more than 14days’, the fifth ‘2days’, and the sixth ‘1day’. According to the results of ANOVA analysis, the value of P=1.44E-53, which is very small which implies the difference between inter-groups is significant. The preference of Chinese respondents’ time spent on one trip is concentrated in 3-4 days and 5-6 days, while the longer time (7-14days and more than 14days) is ranked in the last. It implies that Chinese respondents mainly focus on short-term trips. The preference of Spanish respondents’ time spent on one trip is mostly concentrated in 5-6 days and 7-14 days, followed by 3-4days while 2 days and 1day are ranked in the last, which implies that Spanish respondents prefer medium and long-term trips. Based on the above data analysis, it can be seen that the difference between Chinese and Spanish college students in preference to time spent in one trip is relatively significant. The main reason for this is the difference in the arrangements for holidays between the two countries and the influence of the location of the sample. According to the above analysis of the causes of the differences in the preference to travel period, it is not difficult to know the effect of the holiday arrangement system on the differences in preference to time spent for one trip between Chinese and Spanish college students. In addition, the target audiences for this survey are the students from Ningbo University and the University of the Balearic Islands. Due to the special 24.
(25) geographical location of the University of Balearic Islands, it is relatively easy to produce the above differences. It is located in Majorca and people need more time to travel to the mainland compared to people who live in mainland. Therefore, local people prefer medium and long-term trips more. 4.2.3 Comparison of travel motivation Table 8.Comparison of travel motivation. China. Percentage. Enjoy natural landscape 87.00%. Percentage. Learn history, language,etc 59.30%. Make new friends 13.00%. To participate in extreme sports 25.10%. Physical fitness 5.60%. To participate To visit in relatives, religious friends activities 10.40% 1.30%. To relax 74.90%. For working Shopping purpose 10.80% 3.00%. 80.23%. 46.51%. 19.77%. 23.26%. 4.65%. 24.42%. 3.49%. 77.91%. 22.09%. 8.14%. Pearson. -0.085. -0.115**. 0.085. -0.019. -0.019. 0.179**. 0.071. 0.031. 0.145**. 0.111**. Significance. 0.131. 0.041*. 0.131. 0.734. 0.731. 0.001**. 0.203. 0.578. 0.010**. 0.049*. Spain. Total percentages are based on respondents. * p<0.05 ** p<0.01. The sample passed the significant test in options: ‘to visit relatives, friends’, and ‘shopping’. The value of ‘significance’ is 0.001 and 0.01 which are smaller than 0.05. To option ‘to visit relatives…’, the ‘P’ is equal to 0.179 which shows there is a significant very weak positive correlation between nationality and the motivation to visit relatives and friends. It implies more Spanish respondents have that motivation than Chinese respondents. To option ‘shopping’, the ‘P’ is equal to 0.145, which show there is a significant very weak positive correlation between nationality and the motivation of shopping. It implies more Spanish respondents have that motivation than Chinese respondents. And the data of other options didn’t pass the test, thus they have no significant correlation with nationality. The reason for the difference in the choice of ‘shopping’ may be due to the differences in both groups’ economic level. As Spanish students’ economic level is much higher than that of Chinese students, they may have much more money to buy. And in Europe many big brands are originally located here, thus it is easy and convenient for Spanish students to fly there and shopping. While for Chinese students, many of them are used to shopping online which is much cheaper, more convenient and relax. Compared to travel for shopping, many Chinese students prefer more to shopping online. And the main reason why the low proportion of the Chinese students’ choice of ‘to visit relatives and friends’ is due to one Chinese tradition. As we all know, the most important festival in China is the Spring Festival, during those days, all the families will come back to their hometown and they visit their friends and relatives. That is one of the most important customs for Chinese people. And also as the long summer and winter holidays coming, Chinese students get back home and meet their friends too.. 25.
(26) 4.2.4 Comparison of Travel Information Acquisition Channels Table 9.Comparison of Travel Information Acquisition Channels. The official Social Tourism website and applicatio evaluation Video site social ns (like website (like account of Facebook, (like Youtube) the Instagram Tripadvisor) destination etc.). Online travel agencies (like Expedia etc.). The recommends of friends. TV show. Magazines. Tradition al travel agency and its website and social account. China. Percentage. 57.60%. 34.60%. 48.90%. 22.10%. 24.20%. 59.30%. 17.30%. 26.40%. 24.20%. Spain. Percentage. 61.63%. 32.56%. 48.84%. 34.88%. 30.23%. 53.49%. 9.30%. 6.98%. 17.44%. Pearson. 0.037. -0.019. -0.001. 0.131**. 0.061. -0.052. -0.099. -0.212**. -0.073. Significance. 0.515. 0.729. 0.99 0.020* 0.279 0.351 Total percentages are based on respondents.. 0.077. 0.000**. 0.197. * p<0.05 ** p<0.01. The options: ‘video site (like YouTube)’, and ‘magazines’ has passed the significant test. The value of ‘significance’ is 0.02 and 0.000 which are smaller than 0.05. To option ‘video site (like YouTube)’, the ‘P’ is equal to 0.131 which shows there is a significant very weak positive correlation between nationality and through video site to acquire travel information. It implies more Spanish respondents use that channel than Chinese respondents. To option ‘magazines’, the ‘P’ is equal to -0.212, which shows there is a significant weak negative correlation between nationality and through magazines to acquire travel information. It implies more Chinese respondents use that channel than Spanish respondents. And the data of other options didn’t pass the test, thus they have no significant correlation with nationality. It can be deduced that there is no significant difference between the students of two countries in the choice of major travel information acquisition channels but in terms of the choice of secondary channels, Chinese college students tend to prefer more on traditional channels compared to Spanish college students. The main reason for this is that compared to Spain’s earlier development of the Internet and better development of online promotion of tourism, the Internet development and tourism development of China is relatively backward. Although nowadays in China there is a new trend to develop new Internet promotional media and online travel agencies are also moving very fast, they are new to many Chinese people and the traditional travel companies still play an important role. The potential of this new trend can be predicted just like the development of the new promotion channels of marketing. In the near future, this difference will be removed. 4.2.5 Comparison of the ranking of the spending proportion on tourism products Form 10. Comparison of the ranking of the spending proportion on tourism products China Category N Sum Mean ANOVA 26.
(27) Accommodation 231 Food & 231 Beverage Transportation 231 Tickets for 231 attractions Shopping 231 Entertainment 231 ANOVA analysis. 433. 1.874459. 1.379823. 730. 3.160173. 1.769885. 700. 3.030303. 3.081686. 828. 3.584416. 1.739582. 1030 1130. 4.458874 2.06678 4.891775 1.670845 P-value=5E-119 Spain. Category N Sum Mean ANOVA Accommodation 86 179 2.081395 1.887415 Food & 86 229 2.662791 1.732011 Beverage Transportation 86 305 3.546512 2.062517 Tickets for 86 415 4.825581 1.36922 attractions Shopping 86 370 4.302326 2.542818 Entertainment 86 308 3.581395 2.928591 ANOVA analysis P-value=2.17E-36 This is a ranking question and is analyzed using the mean analysis and ANOVA analysis method. Firstly it needs assign values to each option. Since the setting of the question is that the most preferred option should be ranked first, and the least preferred option is ranked sixth, based on this, the first to sixth places are assigned value 1-6. Therefore, in the mean analysis, the option to get the minimum mean should be selected as the first option. The variance of each category is relatively small, most of them are around 1, which shows the data is stable and the value of P=5E-119, which is very small which shows the result is significant. The order of spending proportion in these six factors of Chinese respondents is accommodation, transportation, food & beverage, tickets for attractions, shopping, and entertainment. And the order of Spanish respondents is accommodation, food & beverage, transportation, entertainment, shopping and tickets for attractions. And according to the result of ANOVA analysis the value of P=2.17E-36, which is very small, which implies that the difference between inter-groups is significant. The most spent factors are accommodation, food & beverage and transportation in which the order of both countries’ respondents is similar. About other three, Chinese respondents think that the expenditure in tickets for attractions is more than shopping and entertainment while the Spanish respondents spend more on entertainment. The reasons for this difference in the expenditure of tickets for attractions are quite obvious. Firstly the attractions charging system are different. In China, almost every attraction needs tickets even some excursions on mountains and 27.
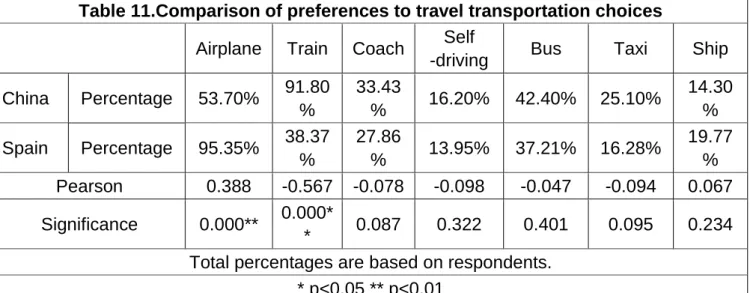
(28) temples. And the pricing of these tickets is not cheap at all. For some, you need to pay hundreds. While in Spain and European countries many attractions are free to enter, for example, mountains, many churches, parks etc. And the tickets to enter are not expensive as hundreds. Secondly, the preferential policies to students are different. In China, the preferential price for college students buying tickets with student cards is generally half price. And in some peak seasons and some attractions, there are no preferential prices. While in Europe, there are various preferential policies for students. For example, many museums are free for young students. In conclusion that Chinese students’ expenditure on tickets is more than that of Spanish students’. 4.2.6Comparison of travel consumption behavior 4.2.6.1 Comparison of preference to travel transportation choice Table 11.Comparison of preferences to travel transportation choices Self Airplane Train Coach Bus Taxi Ship -driving 91.80 33.43 14.30 China Percentage 53.70% 16.20% 42.40% 25.10% % % % 38.37 27.86 19.77 Spain Percentage 95.35% 13.95% 37.21% 16.28% % % % Pearson 0.388 -0.567 -0.078 -0.098 -0.047 -0.094 0.067 0.000* Significance 0.000** 0.087 0.322 0.401 0.095 0.234 * Total percentages are based on respondents. * p<0.05 ** p<0.01 The sample passed the significant test in options: ‘airplane’, and ‘train’. The value of ‘significance’ is both 0.000, smaller than 0.01. To option ‘airplane’, the ‘P’ is equal to 0.388 which shows there is a significant weak positive correlation between nationality and taking the airplane to travel. It implies more Spanish respondents prefer to take the airplane to travel than Chinese respondents. To option ‘train’, the ‘P’ is equal to -0.567, which show there is a significant moderate weak negative correlation between nationality and taking the train to travel. It implies more Chinese respondents prefer to take the train to travel than Spanish respondents. And the data of other options didn’t pass the test, thus they have no significant correlation with nationality. The first and most important reason is obvious. The special location of the target respondents who are now living in Majorca Island, decides the most convenient mode travel to the mainland is taking planes. According to that the data of Spanish college students’ preference to choose ‘airplane’ may not be the common case of the whole Spain but the common case of the college students of Palma. Recent years in China the development of rail net is extremely fast. Compared to expensive flight because there are no discounts for students when 28.
Figure


+7


Documento similar
78 Department of Physics and Astronomy, University College London, London, United Kingdom. 79 Louisiana Tech University, Ruston
Validation of the index for inclusion questionnaire for parents of non-university education students
The Index for Inclusion for families of non-university education students was shown to be a robust and adequate psychometric instrument to assess the degree of development of
We describe our experience using videos to teach Numerical Methods to fourth year students of the Agronomical Engineering degree at the Polytechnic University of
The aim of this study is to compare and contrast the prevalence and nature of traditional stalking and cy- berstalking victimization between American and Spanish university
The “Course for Erasmus and International Exchange Students” of the University of Mala- ga, 70 class hours, allows students to consolidate and acquire Spanish skills in order to
University or professional training programmes for presenters are limited to train students in vocal and non-verbal communication techniques, and do not take into
motivation and interest; to encourage their active participation in learning experiences; to explore a constructivist approach in which students build their own learning
This paper aims to present Airbnb as an example of the sharing economy and analyze how its growth has been affecting the hotel industry and the rental housing market.. In order
