Effect of high CO2 and water availability on whole plant carbon and water balance in grapevine
33
0
0
Texto completo
(2) Index. Abstract............................................................................................................................. 2 Introduction ...................................................................................................................... 3 Material and methods ...................................................................................................... 6 •. Plant material and site of study ........................................................................................ 6. •. Whole-plant gas exchange chambers ............................................................................... 6. •. Leaf area measurements .................................................................................................. 9. Results............................................................................................................................. 12 •. Variation of CO2 concentration at night ......................................................................... 12. •. Whole-plant net carbon exchange and transpiration in different water regimes ......... 12. •. Effect of high CO2 on net carbon exchange and transpiration ....................................... 13. • Light responses of carbon and water balance under different water regimes and CO2 conditions ................................................................................................................................ 15 •. WUE of watered and drought plants .............................................................................. 16. •. Rain’s effect on carbon assimilation and water transpiration in drought plants ........... 18. •. CO2 concentration effect on carbon assimilation of irrigated and non-irrigated plants 19. Discussion ....................................................................................................................... 22 •. CO2 concentration stability along the daily cycle ........................................................... 22. •. Whole-plant net carbon exchange and transpiration in different water regimes ......... 22. •. Effect of high CO2 on net carbon exchange and transpiration ....................................... 23. •. WUE of watered and drought plants .............................................................................. 24. •. Rain effect ....................................................................................................................... 24. •. CO2 concentration effect on carbon assimilation ........................................................... 24. Conclusions ..................................................................................................................... 26 References ...................................................................................................................... 27. 1.
(3) Abstract Water scarcity is one of the main challenges in vineyards sustainability in most of the grapevine áreas, now and even more in near future to due climatic change perspectives. For that reason, water use efficiency measurements are one of the highest interest to improve the sustainability of this crop. Since the vast majority of studies relays on measurements of carbon and water fluxes at the leaf scale, less data are available at the whole-plant scale.. For this reason, in this experiment, whole-plant water and carbon fluxes in grapevine exposed to two different water regimes and under high CO2 concentrations were measured, in order to check its effect at the whole-plant scale.. The results obtained showed that water and carbon fluxes are well coordinated between themselves under both water treatments. Under drought conditions, both fluxes were reduced, but surprisingly the estimated water use efficiency was decreased, contrarily to what is shown at the leaf scale. Finally, high CO 2 measurements indicated an increase of whole-plant NCE as well as increased whole-plant water use efficiency, mainly in non-watered plants.. 2.
(4) Introduction Among other human activities, the combustion of fossil fuels as well as the clearing of forests are increasing the atmospheric CO 2 concentration (Clark, 1982; Houghton et al., 1983; Rotty and Marland, 1986; Houghton, 1988). The predicted increase in atmospheric CO2 concentration may have direct effects on individual plants, populations, communities and ecosystems (Strain, 1987; Bazzaz, 1990; Woodward et al., 1991). One of its biological effects on plants would be an increase of the net photosynthesis and plant growth, since CO2 is the first component for plants metabolism (Strain, 1987).. Meanwhile plants fix Carbon, this induce an obligatory loss of water, since CO2 and water share the same pathway to enter in (for CO 2) and go out (for H2O) the leaf. Thus, the Water Use Efficiency (WUE) can be basically defined as the ratio of Carbon fixed per unit of water lost. But several definitions of WUE can be found, following the scale at which it is defined: extrinsic WUE is known as the ratio between leaf assimilation rate (A) to leaf transpiration rate (E) (at the leaf scale of at the whole plant scale) and intrinsic WUE correspond to the ratio of leaf assimilation rate to leaf stomatal conductance (g s). WUE can also be defined as the yield (or total biomass production) to the total water consumed by the plant (for agricultural purpose). The importance of this parameter in agriculture lays on the capacity to increase yield production and decrease transpiration water loss (Douthe et al., 2018, in press).. In the literature, it is described that WUE increases with drought (when measured at the leaf scale) or with increased CO2 (Strain, 1987).. Leaf gas exchange depends on many factors related to crop management and the environment, such as cultural practices and the considered genotype (Escalona et al., 2016). One of the most important environmental factors determining these parameters is the soil water availability (Escalona et al., 2016). The progressive water shortage during summer, typical of Mediterranean climate, results in a decrease of leaf photosynthetic activity, which results in a slowdown and a subsequent shutdown of vegetative growth, which can substantially compromise the production and quality of grapes (Medrano et al., 2002; Chaves et al., 2010). Water deficit causes a significant reduction in both. 3.
(5) instantaneous values of photosynthesis, daily integral of net carbon uptake and also leaf transpiration (Escalona et al., 2016). Interestingly, it is accepted that water deficit increase the leaf WUE (Medrano et al., 2002; Escalona et al., 2016).. Simultaneous estimation of canopy water use (E) and dry matter production (A) can be done by using portable infrared gas analyzers (IRGA) at the single leaf level and scaled up to the canopy using canopy leaf area (Greco and Baldocchi, 1996) or by enclosing canopies in open system flow-through chambers in which water vapor and CO 2 fluxes are measured using an IRGA (Garcia et al., 1990). The main disadvantage of the first system to estimate canopy gas exchange are errors associated with the non-destructive estimation of canopy leaf area and the overestimation of whole-canopy CO2 assimilation rates due to the proportion of non-photosynthesizing or respiring leaves in a given canopy (Poni et al., 1997). Furthermore, the heterogeneous architecture of grapevine canopies mean that individual leaves vary in terms of their position on the canopy e.g. interior (shaded) vs. exterior (exposed) leaves (Schultz, 1993), age, temperature and position on the shoot, all of which affect leaf physiological performance such as stomatal conductance and CO 2 assimilation rate (Petrie et al., 2009).. The very large majority of studies focused on plant gas exchange have been conducted at the leaf scale, but very few data are available at the whole plant scale. In grapevine, the use of whole plant chambers has led to novel findings that involve effects of regulated deficit irrigation (Poni et al., 2009; Tarara et al., 2011). Furthermore, these systems can also permit to continuously monitor the concentrations of both CO2 and H2O inlet and outlet water-vapor pressure, allowing measurements of whole-canopy carbon and water net exchange, and hence, the whole-canopy water-use efficiency (WUE) (Poni et al., 2014). Many researches (Petrie et al., 2009) indicate that WUE can be reliably measured on a whole-canopy basis and compared to other techniques, including single-leaf intrinsic and extrinsic WUE (Schultz and Stoll, 2010), isotopic composition (13C/12C), or biomass accumulation per unit of water used (Gibberd et al., 2001).. Considering that, the aim of this experiment was to determine the net carbon exchange (NCE) and transpiration (E) of grapevine plants at whole-plant scale in different 4.
(6) environmental conditions: in irrigated and non-irrigated conditions and under atmospheric CO2 concentration and higher CO2 concentrations.. 5.
(7) Material and methods •. Plant material and site of study. The experiment was conducted during the summer 2018 in an experimental vineyard planted in 2009 at the University of the Balearic Islands. The plant material used during the experiment consisted of Grenache vines submitted to two different water regimes: a moderate water irrigation and non-irrigation. The measurements were carried out in two representative plants of each water regime, which were used along the entire experiment. The measurements were performed during the months of July and August and were developed as it follows: firstly, irrigated plants were measured (beginning with atmospheric CO2 conditions and ending with high CO2 conditions) and secondly, non-irrigated plants were measured (also beginning with atmospheric CO2 conditions and ending with high CO2 conditions). For each session of measurement, plants remained inside the whole-plant chamber 2 or 3 days before the measurements were taken to avoid the disturbing effect of the chamber installation. Each measuring session last at least 3 consecutive days. •. Whole-plant gas exchange chambers. During the entire experiment, plants were kept inside two open-top whole-plant gas exchange chambers (Figure 1) and were measured continuously. Firstly, chambers’ structures were assembled and then covered with plastic film (RX 140-PropafilmTM). The entering air flow from the atmosphere was pushed into the chambers by a turbine (S & P 500), at a constant air flow of 280 mol min-1.. 6.
(8) Figure 1. The two whole-plant gas exchange chambers used during the experiment.. The circuit which was controlling all parameters measured included (Figure 2): -. Gas Analyzer (Li-840, Li-Cor, Inc., Lincoln, NE, USA): which measured in and out CO2 and H2O concentrations.. -. Flowmeter (Series 641 Air Velocity Transmitter, Dwyer, Indiana, US): to regulate the amount of flow entering into the chambers.. -. Thermocouples (type K, RoHS, Model TP-01): which measured the temperatures inside and outside the chambers.. -. Electro-valves: to sequentially inject the air from the different chambers to the Li-840 analyzer.. -. Data logger (Campbell CR1000): data logger of the rest of devices.. 7.
(9) Figure 2. System that controlled and measured all the inputs and outputs of both chambers.. The air flow entering and outgoing the chamber was measured during 5 consecutive minutes each, alternatively. The 4 first minutes of data were eliminated to ensure a complete turn-over of the gas in the measuring circuit. With data collected, net carbon exchange (NCE) and transpiration (E) were calculated through the following equations:. 𝑁𝐶𝐸 =. 𝐸=. 𝐹(𝐶𝑒 − 𝐶𝑜 ) 𝐿𝑎. 𝐹(𝑊𝑜 − 𝑊𝑒 ) 𝐿𝑎. where F is the air flow through the chamber, Ce and We are the entering [CO2] and [H2O] of the chamber, Co and Wo are the outgoing [CO2] and [H2O] of the chamber and La is the total leaf area of the plant.. 8.
(10) •. Leaf area measurements. In order to choose the useful method to obtain plant leaf area of the measured plants, a revision of the methods that can be find in the literature was made.. -. Lopes and Pinto (2005) proposed an empirical model for estimating primary shoot leaf area. Primary leaf area of shoots is estimated by a model using a calculated variable obtained from the average of the largest and smallest primary leaf area multiplied by the number of primary leaves. For lateral leaf area estimation another model is presented which uses the same type of calculated variable plus the area of the largest leaf.. -. Carbonneau (1976) method is based on measurement of MVL (main vein length) for one of every three leaves on four representative fruiting shoots (4-5 plants per row). This method is simple and accurate but in order to estimate total leaf area one still has to measure all primary and lateral leaf veins, a very laborious procedure.. -. In several fruit tree species (citrus, almond, pecan olive, walnut and asian pear) Spann and Heerema (2010) found a linear relationship between the biggest leaf length multiply by shoot leaf number and shoot leaf area. This method has some advantages like that it allows the primary and lateral leaf area to be estimated separately. This method is easy, accurate and non-destructive; it also reduces measuring time.. -. Plant canopy analyzers (LAI-2000, LI-COR Inc., Lincoln, NE, USA). This kind of sensor measures the light extinction through the foliage. However, a general trend towards underestimating LAI due to foliage clumping (Jonckheere et al., 2004; Johnson and Pierce, 2004), and the requirement for an above canopy reference reading in order to get accurate LAI estimations are known weaknesses of the LAI-2000 approach.. -. Ground-based sensors to get information about the geometry and/or structure of the canopy. Specifically, laser sensors have been tested in grapevine, in 9.
(11) which in addition to laser sensors (Llorens et al., 2011), radiometric sensors mounted on tractors were used (Mazzetto et al., 2010).. -. Hemispherical canopy photography is a technique for studying plant canopies via photographs acquired through a hemispherical (fisheye) lens from beneath the canopy (oriented towards zenith) or placed above the canopy looking downward. It is able to capture the species-, site- and age-related differences in canopy architecture, based on light attenuation and contrast between features within the photo (sky versus canopy). One of the main problems cited in the literature of hemispherical photography for determination of LAI is the selection of the optimal brightness threshold in order to distinguish leaf area from sky area thus producing a binary image, affected by camera angle and resolution, and analysis software, among other factors (O’Neil et al., 2002, Phattaralerphong et al., 2006).. -. Inclined point quadrat. This method was developed by Wilson (1960) and consists of piercing a vegetation canopy with a long thin needle (point quadrat) under known elevation (i.e. the angle between the needle and the horizontal plane when vertically projected) and azimuth angles (i.e. the bearing of the needle from north when horizontally projected) and counting the number of hits or contacts of the point quadrat with “green” canopy elements. It is the elevation angle that determines the impact of the canopy structure on the number of hits.. Finally, once all different methods were studied, leaf area of the plants used in the experiment was calculated following Sánchez de Miguel et al. (2010) methodology. For this, it was previously needed to record data on a representative sample of leaves of all size in order to obtain a calibration equation. Once the calibration equation was calculated, measurements on all shoots of the plants subsequently used in the experiment were taken. In these shoots three different measurements in the main shoot (1) and another three in its lateral shoots (2) were taken: the length of the main nerve of the largest leaf (L) and the smallest leaf (S) of the main shoot, the length of the main nerve of the largest leaf (L) and the smallest leaf (S) of the lateral shoots and the number of leaves. So, 6 parameters per shoot were finally obtained.. 10.
(12) Then, for a given shoot whether it was a main or lateral, the data regarding the length of the main nerve (cm) was converted to an area (cm2) by using the relationship found between both variables.. 11.
(13) Results •. Variation of CO2 concentration at night. It was observed that atmospheric CO 2 concentration (so the concentration entering the chamber) varied largely depending on the hour of the day or night. While during the day CO2 concentration was pretty stable with a variation of 7-8 mol mol-1 at the most, during the night values were much more instable. During the darkest hours, variations in CO2 concentration reached 12 mol mol-1 between two consecutive hours. 420. chb1 chb2. 415 410. CO2 (mol mol-1). 405 400 395. 390 385 380 375 370 365 0. 5. 10. Time (h). 15. 20. Figure 3. Daily cycle of atmospheric CO2 concentration in both chambers. Green circle dots for “Chamber 1” and orange circle dots for “Chamber 2”.. •. Whole-plant net carbon exchange and transpiration in different water regimes. Whole-plant net carbon exchange and transpiration measurements of watered plants at atmospheric CO2 concentrations were performed in July (pea size). In those conditions, whole plant net carbon exchange (NCE) reached its maximum peak at 10-11 h. with values of 10 μmol m-2 s-1 (Figure 1). Whole-plant transpiration (E) values followed almost the same pattern, achieving its maximum peak of 3 mmol m-2 s-1 at 10-12 h. and decreasing since then.. When measured in August (ripening) in non-irrigated conditions, a decrease in both NCE and E plant was observed (Figure 4). Regarding to whole-plant net carbon. 12.
(14) exchange, values diminished near 4 ppm in comparison to those obtained in irrigated conditions. Also, maximum peak of 8 μmol m-2 s-1 was reached earlier in the morning, around 8 h. Whole-plant transpiration maximum peak was observed at 13 h. approximately, with E values of 1.5-1.7 mmol m-2 s-1.. Furthermore, night respiration values obtained in non-irrigated conditions (August) were greater than those observed in irrigated conditions (July) (Figure 1).. 3. 10. Drought (August 2018). Transpiration (mmol m-2 s-1). 3.5. NCE (mol m-2 s-1). 15. Watered (July 2018). 5 0 0. 5. 10. 15. 20. -5. Watered (July 2018) Drought (August 2018). 2.5 2 1.5. 1 0.5. 0. -10. -0.5 -15. 0. 5. 10. -1. Hour. 15. 20. Hour. Figure 4. Net carbon exchange (left, mol m-2 s-1) and transpiration (right, mmol m-2 s-1) daily cycle for 2 treatments: orange circle dots for “Watered” (measured in July) and blue triangle dots for “Drought” (measured in August).. •. Effect of high CO2 on net carbon exchange and transpiration. Once plants were measured at CO2 environmental conditions, they remained inside the whole-plant chambers where CO2 concentration was artificially increased. For this, a CO2 tank was connected directly to the chambers flow, increasing CO2 concentration from atmospheric to 900 mol mol-1.. Both irrigated and non-irrigated plants used this CO2 concentration increase to raise its net carbon exchange. In watered plants, the maximum peak of assimilation was at 10 h., reaching the 22 mol m-2 s-1, so a NCE around 12 mol m-2 s-1 higher than under atmospheric conditions (Figure 5). In non-irrigated plants, NCE values were also higher. 13.
(15) reaching 10 mol m-2 s-1, so close to the values observed in irrigated plants at atmospheric conditions.. 30. Watered Atm. CO2 Watered High CO2 Drought Atm. CO2 Drought High CO2. 25. NCE (mol m-2 s-1). 20 15 10 5 0 7. 9. 11. 13. 15. 17. 19. 21. 23. -5 -10 -15. Hour. Figure 5. Net carbon exchange (NCE, mol m-2 s-1) values of a daily cycle for 4 different treatments: orange circle dots for “Watered plants at atmospheric CO 2 concentration”, blue circle dots for “Watered plants at high CO2 concentration”, yellow triangular dots for “Drought plants at atmospheric CO 2 concentration” and grey triangular dots for “Drought plants at high CO 2 concentration”. The “High CO2” corresponds to ~900 µmol mol-1.. Regarding to transpiration values, surprisingly there wasn’t a big difference between the two CO2 treatments in irrigated plants. However, this difference did exist in nonirrigated plants, where those exposed to higher CO 2 concentrations decreased their E values until 0.7-0.8 mmol m-2 s-1 at their maximum peak (Figure 6).. 14.
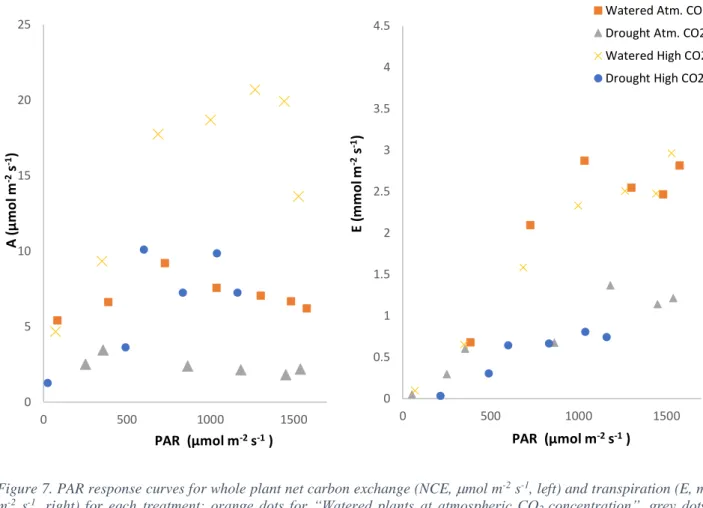
(16) 4.5. Watered Atm. CO2 Watered High CO2 Drought Atm. CO2 Drought High CO2. 4. Transpiration (mmol H2O·m-2·s-1). 3.5. 3 2.5 2 1.5 1 0.5 0 7. 9. 11. 13. 15. 17. 19. 21. 23. -0.5 -1. Hour Figure 6. Transpiration (E, mmol m-2 s-1) values of a daily cycle for 4 different treatments: orange circle dots for “Watered plants at atmospheric CO 2 concentration”, blue circle dots for “Watered plants at high CO2 concentration”, yellow triangular dots for “Drought plants at atmospheric CO2 concentration” and grey triangular dots for “Drought plants at high CO 2 concentration”. The “High CO2” corresponds to ~900 µmol mol-1.. •. Light responses of carbon and water balance under different water regimes and CO2 conditions. With NCE and E data obtained in all different conditions, it was possible to establish the whole plants NCE and E responses to light (Figure 7). Under atmospheric conditions it was observed that surprisingly NCE values of watered plants reached its maximum peak at 700 µmol m-2 s-1 and after it began to decrease as light increased. On the other hand, E values seemed to follow a positive relationship with the light until 1000 µmol m-2 s-1 when they began to decrease. When the same plants were exposed to higher CO2 concentration, their NCE values increased while their E values slightly decreased. The carbon assimilation increased together with the light until approximately 1300 µmol m-2 s-1 where they began to saturate. Instead, E values followed a positive relationship with PAR values and didn’t show saturation.. 15.
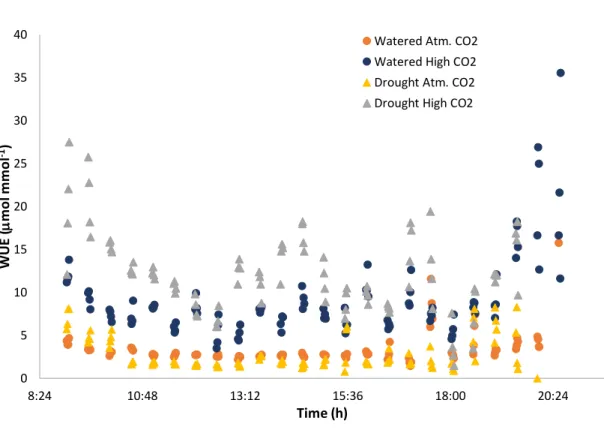
(17) In non-irrigated plants, NCE and E values were lower than in irrigated plants. In atmospheric conditions, NCE values were the lowest among all treatments, reaching its maximum peak before 500 µmol m-2 s-1 and then decreasing with increasing light. When submitted to higher CO2 concentration, drought NCE values followed an irregular shape with values that increase and decrease at highest lights. E values, instead, followed almost the very same pattern in both CO2 concentrations, being a bit lower at highest CO2 conditions. 25. Watered Atm. CO2. 4.5. Drought Atm. CO2 Watered High CO2. 4 20. Drought High CO2. A (µmol m-2 s-1). E (mmol m-2 s-1). 3.5. 15. 3 2.5 2. 10 1.5 1. 5. 0.5 0. 0 0. 500. 1000. 0. 1500. 500. 1000. PAR (µmol. PAR (µmol m-2 s-1 ). m-2 s-1. 1500. ). Figure 7. PAR response curves for whole plant net carbon exchange (NCE, mol m-2 s-1, left) and transpiration (E, mmol m-2 s-1, right) for each treatment: orange dots for “Watered plants at atmospheric CO 2 concentration”, grey dots for “Drought plants at atmospheric CO2 concentration”, yellow dots for “Watered plants at high CO 2 concentration” and blue dots for “Drought plants at high CO2 concentration”. The “High CO2” corresponds to ~900 µmol mol-1.. •. WUE of watered and drought plants. Once net carbon exchange and transpiration values were obtained, we were able to calculate the whole-plant water use efficiency (WUE) of plants subjected to each treatment. Under atmospheric conditions, plants subjected to both water regimes described basically the same pattern. We can observe that drought plants had a lower WUE than the watered plants, both under ambient and high CO 2 (Figure 8). Under high. 16.
(18) CO2, WUE always increased respect to the values obtained at atmospheric conditions. Irrigated plants increased their WUE at higher CO 2 concentration, reaching values from 5-10 mol mmol-1. But it was in drought plants where the increase was even more evident. Non-irrigated plants increased their WUE hugely, reaching values from 10 to 20 mol mmol-1 and even achieving 27 mol mmol-1 of WUE during the first hour in the morning.. In atmospheric conditions, plants showed maximum value in the early morning and late afternoon. Then, they showed a very constant WUE along the day, in both water regimes. When subjected to high CO2 conditions, plants WUE described the same shape with peaks in the morning and late afternoon. However, we observed an increase of WUE around 14h, and then a decrease.. 40. Watered Atm. CO2 Watered High CO2. 35. Drought Atm. CO2 Drought High CO2. WUE (mol mmol-1). 30 25 20 15 10. 5 0 8:24. 10:48. 13:12. 15:36. 18:00. 20:24. Time (h) Figure 8. Water use efficiency as NCE/E (WUE, mol mmol-1) during day hours (from 9-20:30 h) for all different treatments tested: blue circle dots for “Watered plants at atmospheric CO 2 concentration”, orange circle dots for “Watered plants at high CO 2 concentration”, yellow triangular dots for “Drought plants at atmospheric CO2 concentration” and grey triangular dots for “Drought plants at high CO2 concentration”. The “High CO2” corresponds to ~900 µmol mol-1.. 17.
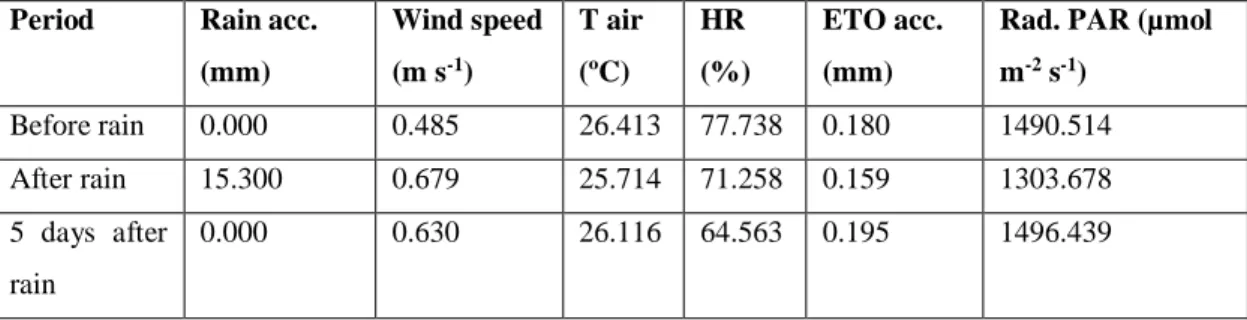
(19) •. Rain’s effect on carbon assimilation and water transpiration in drought plants. Unexpectedly, during non-irrigated conditions measurements rain fell allowing us to compare net carbon exchange and transpiration values before and after the rain. This was useful to observe how drought plants responded to a rapid increase of water availability and also how they could readjust gas exchange once drought was restored after the rain. Table 1. Values of rain accumulated (mm) and mean values of wind speed (m s-1), air temperature (ºC), relative humidity (%), accumulated evapotranspiration (ETO, mm) and maximum radiation PAR (µmol m-2 s-1). Period. Rain acc.. Wind speed. T air. HR. ETO acc.. Rad. PAR (µmol. (mm). (m s-1). (ºC). (%). (mm). m-2 s-1). Before rain. 0.000. 0.485. 26.413. 77.738. 0.180. 1490.514. After rain. 15.300. 0.679. 25.714. 71.258. 0.159. 1303.678. 5 days after. 0.000. 0.630. 26.116. 64.563. 0.195. 1496.439. rain. Two days before rain, drought plants transpiration was 1.5-2 mmol m-2 s-1 and NCE about 4-5 mol m-2 s-1 (Figure 9). Later, two days after the rain fell, transpiration and net carbon exchange of non-watered plants increased. At that time, plants transpiration increased to 2-2.5 mmol m-2 s-1 meanwhile NCE 5-7 mol m-2 s-1. So, it can be observed that when water availability increased, plants tended to photosynthesize and transpire more but at the same time, their WUE tended to decrease. Five days later, drought conditions were not only restored, but strengthened.. 18.
(20) 8 7. NCE (mol m-2 s-1). 6 5. 4 Before rain After rain Drought recovery. 3 2 1 0 0. 0.5. 1. 1.5. E (mmol m-2 s-1). 2. 2.5. 3. Figure 9. Net carbon exchange (NCE, mol m-2 s-1) vs transpiration (E, mmol H2O m-2 s-1) values of drought plants submitted to 3 water conditions at photosynthetic peak hours (11-14 h.): orange triangular dots for “Two days before rain”, grey triangular dots for “2 days after the rain” and blue circle dots for “Drought recovery (5 days after the rain)”.. •. CO2 concentration effect on carbon assimilation of irrigated and nonirrigated plants. When CO2 concentration was artificially increased, the range of concentration allowed us to observe how net carbon exchange varied from atmospheric CO 2 concentration ( 375 mol mol-1) to 1000 mol mol-1 (Figure 10).. 19.
(21) 30 Watered Drought Single Leaf. NCE (mol m-2 s-1). 25. 20. 15. 10. 5. 0 0. 200. 400. 600 800 CO2 (mol mol-1). 1000. 1200. Figure 10. Net carbon exchange (mol m-2 s-1) of watered and non-watered plants measured during the day (from 11-13 h.) in both chambers at different CO2 concentration (mol mol-1): blue circle dots are for “Watered plants” and triangular grey dots for “Drought plants”. Green square dots are for values of NCE of a single leaf.. In both irrigated and non-irrigated plants, it can be observed how assimilation values during the day increased as CO2 reference concentration rose. In irrigated plants, values followed a curve slightly higher than in non-irrigated plants. In non-irrigated plants, under atmospheric concentration (370 mol mol-1), net carbon exchange reached a maximum peak of 5.3 mol m-2 s-1. When [CO2] increased to 600 mol mol-1, NCE values increased almost to 9.5 mol m-2 s-1. Few values were observed near 700-750 mol mol-1 and were irregular and not as higher as expected. Finally, at 1000 mol mol-1, net carbon exchange increased more than in the other concentrations, to reach a maximum peak of near 15 mol m-2 s-1. Also, it can be observed the curve expected for a single leaf which followed a logarithmic shape that saturated at 1000 mol mol-1.. 20.
(22) 50. chb1 chb2. 40. 30. NCE (mol m-2 s-1 ). 20 10 0 -10. 0. 200. 400. 600. 800. 1000. 1200. 1400. -20 -30 -40 -50. CO2 (mol mol-1 ). Figure 11. Net carbon exchange (NCE, mol m-2 s-1) of non-watered plants measured during the night (from 22-5 h.) in both chambers at different CO2 concentration (mol mol-1). Green circle dots are for “Chamber 1” and blue circle dots for “Chamber 2”.. In order to correct for leaks the day values of NCE at different CO 2 concentration, we measured the NCE during the night (ignoring the night respiration). Surprisingly, when measured at night, the apparent NCE did not increase along with the CO 2 concentration, suggesting no leaks of the chambers (Figure 11). We nevertheless observed an increase of the noise on measurement along with CO2 concentration.. 21.
(23) Discussion •. CO2 concentration stability along the daily cycle. We observed two things about daily cycle of the atmospheric CO 2 concentration: it was clearly higher during the night and also very instable when compare to during the day. This phenomenon has been already observed and described (Douthe et al., 2018, in press). The strong decrease at sunrise can be explained by the surrounding vegetation that starts to fix CO2 when light is sufficiently available to induce photosynthesis. On the other hand, the huge instability during the night is harder to explain (not related to wind speed, data not shown). The main problem of night instability is that it prevented to correctly estimate night respiration.. •. Whole-plant net carbon exchange and transpiration in different water regimes. When plants grow in irrigated conditions, their net carbon exchange and transpiration values are thought to be greater than plants grown in non-irrigated conditions. That is based on the fact that transpiration is reduced by stomatal closure (Medrano et al., 2002). Stomatal closure limits CO2 entry inside the leaf, and decrease at the same the rate of photosynthesis (Chaves, 1991; Nam et al., 1998; Cornic, 2000; Flexas et al., 2004). Results observed during the experiment followed those expectations, since watered plants photosynthesized 5 mol mol-1 more than plants subjected to water stress (Figure 4, left). Stomatal closure deprives the leaves of CO 2 and photosynthetic carbon assimilation but also favor of photorespiration (Anjum et al., 2011), reducing the observed net photosynthesis as shown in Figure 4, left.. It is well-documented that water stress in grapevines decreases both leaf and canopy transpiration (Medrano et al., 2002; Merli et al., 2015; Tarara and Pena, 2015; Escalona et al., 2016). Furthermore, as regard to net carbon exchange, it can be observed that in watered plants the maximum peak of photosynthesis is achieved near 10-11 h, whereas in drought plants its maximum peak is reached earlier, 3 hours before (at 7-8 h.). A possible explanation for this effect could be that stressed plants open their stomas very. 22.
(24) early in the morning and then they closed them rapidly in order to reduce water lost during the peak solar hours. Because of that, transpiration of drought plants was also lower than in irrigated plants, near 1 mmol m-2 s-1 less than the watered plants.. One of the major drivers of transpiration in grapevines is light interception; at a given VPD (vapor pressure deficit) and water status, whole-plant transpiration is strongly determined by canopy light interception (Jones, 2014). Because of that, during the hours of higher light, transpiration reached their maximum values, also being higher in watered plants and lower in non-irrigated ones (Figure 7, right). Our results reproduced the same typical photosynthesis versus light curves, as usually obtained for a singleleaf. The whole-plant measurements are noisier that using classical gas exchange systems, but the saturating shape of the light response curves is conserved. •. Effect of high CO2 on net carbon exchange and transpiration. As Aston (1984) reported, increasing CO2 leads to stomatal closure, causing transpiration to decline while net photosynthesis increases. The values obtained during the experiment followed this statement. In irrigated plants, NCE values were 12 mol m-2 s-1 higher than NCE values under atmospheric conditions. At that time of measurements, E values didn’t diminish as expected in higher CO 2 conditions, and in contrast values remain at the same level as those observed in atmospheric conditions. However, it did exist differences in E values in non-irrigated plants case. In comparison of drought plants under atmospheric conditions, a slightly decrease of E values at high CO2 conditions was observed during the day. It seems that when plants are subjected to a double stress (water stress and high CO2), they close their stoma in a more evident way, while when they are well watered and under high CO 2 conditions, that closure is not so notable. This is consistent with the findings of Gerardin et al. (2018), who find that the stomata of leaves under drought stress were more sensitive to changes in light that under well-watered conditions. It is probable that the stomata are also more sensitive to change of CO2 concentration when they are subjected to water limitation.. 23.
(25) •. WUE of watered and drought plants. Water use efficiency (WUE) values obtained help us to determine which water regime and under which conditions, plants are more capable of using the water available in a more efficient way. Under atmospheric conditions, watered plants have better WUE than non-irrigated plants. This result is inversed to the classical observation based on single-leaf (WUE usually increase with drought). It is hard to explain why the wholeplant observations do not respect this pattern. Probably, the fact that the whole canopy is the sum of sun and shaded leaves, that act in different ways in terms of photosynthesis and transpiration, could explain this pattern. Nevertheless, the same thing was observed by Douthe et al. (2018, in press), confirming the validity of our results. Under high CO2, drought plants are the ones that increased more their WUE values when compared to atmospheric CO2, practically doubling the WUE values under atmospheric conditions. In watered plants, the increase of WUE under high CO 2 conditions is also notable, but in a less extended way. These differences in the increase in WUE under high CO2 can be explained by the fact that transpiration decreased much more for the drought plants under high CO 2 than for the watered ones. This increased much more the NCE/E ratio, so the WUE. •. Rain effect. When rain fell during the measurement of water-stressed plants, plants were able to use that water in to improve both their photosynthetic rate and transpiration rate. Curiously, 5 days after the rain, when plants returned to non-irrigated conditions, it seemed that drought stress was even harder than the initial one, since their A and E values were lower than those reached before the rain (Figure 10). When soil-available water content was reduced, the stomata opened less in order to prevent dehydration (Taiz and Zeiger, 2002; Anjum et al., 2011; Hoshika et al., 2013), this also resulted in a decrease of the photosynthesis rate (Pirasteh-Anosheh et al., 2016). •. CO2 concentration effect on carbon assimilation. Those values could be useful to predict at canopy level and at different CO2 concentration which net carbon exchange the plant is going to achieve. At canopy level, it must be considered that all leaves are accounted, even those that aren’t exposed 24.
(26) completely to the sun. When we compare these values with values measured for one leaf with a LICOR, the latter is clearly higher, because the measured leaf is exposed to a saturating light. Even with this, we observed the classical saturating shape at high CO2, confirming that the whole-plant chambers are able to measure correctly the CO 2 response of the whole canopy.. When measured at night, NCE values observed were useful to notice CO 2 leaks of the chamber. We curiously noticed that they were no detectable leaks from the chambers. This result is different from what observed with the same chamber in a previous experiment (Douthe et al., 2018, in press), probably for an improved sealing of the chambers use in the present study.. 25.
(27) Conclusions One of the aims of this experiment was to use whole-plant chambers in order to determine net carbon exchange and transpiration values of a whole vineyard plant. With the results obtained, and agreeing with several authors that conducted similar experiments, it seems that whole-plant chambers are a good alternative to scale up from leaf level to canopy level.. Taking into account the values obtained, it seems that in vineyard plants, water stress leads to a decrease of both net carbon exchange and transpiration, proving that water availability is a crucial factor to perform both processes. As well as water availability, light is also important to achieve high photosynthetic and transpiration values since NCE and E values increase along with light. Again, in drought plants, NCE and E values are always lower than non-stressed well-watered plants.. As regard to CO2, in general, when its concentration rises, plants tend to increase its net carbon exchange and decrease its transpiration. This was observed both in irrigated and non-irrigated plants although in well-watered plants, it seemed that plants didn’t close their stomas as much as drought plants did and so their transpiration remained mainly the same as in atmospheric conditions. However, in both water regimes (irrigated and non-irrigated) higher CO2 increased their WUE, especially in drought plants.. We propose that next studies should focus on the reason of why drought decreases the whole canopy WUE, while it is the inverse for the single-leaf WUE.. 26.
(28) References ANJUM, S.A., XIE, X., WANG, L., SALEEM, M. F., MAN, C. and LEI, W. (2011). Morphological, physiological and biochemical responses of plants to drought stress. African Journal of Agricultural Research, 6 (9), 2026-2032.. ASTON, A.R. (1984). The effect of doubling atmospheric CO2 on streamflow: A simulation. Journal of Hydrology, 67, 273-280.. BAZZAZ, F.A. (1990). The response of natural ecosystems to the rising global CO2 levels. Annual Review of Ecology, Evolution and Systematics, 21, 167–196.. CARBONNEAU, A. (1976). Principes et méthodes de mesure de la surface foliaire. Essai de caractérisation des types de feuilles dans le genre Vitis. Annales de l’amélioration des plantes.. CHAVES, M.M. (1991). Effects of water deficits on carbon assimilation. Journal of Experimental Botany, 42, 1-16.. CHAVES, M.M., ZARROUK, O., FRANCISCO, R., COSTA, J.M., SANTOS, T., REGALADO, A.P., RODRIGUES, M.L. and LOPES, C.M. (2010). Grapevine under deficit irrigation: hints from physiological and molecular data. Annals of Botany, 105, 661–676.. CLARK, W.C. (1982). Carbon dioxide review. Oxford University Press.. CORNIC, G. (2000). Drought stress inhibits photosynthesis by decreasing stomatal aperture - not by affecting ATP synthesis. Trends Plant Science, 5, 187-188.. DOUTHE, C., MEDRANO, H., TORTOSA, I., ESCALONA, J.M., HERNÁNDEZMONTES, E. and POU, A. (2018). Whole-plant water use in field grown grapevine: seasonal and environmental effects on water and carbon balance.. 27.
(29) ESCALONA, J. M., POU, A., TORTOSA, I., HERNÁNDEZ-MONTES, E., TOMÁS, M., MARTORELL, S., BOTA, J. and MEDRANO, H. (2016). Using whole-plant chambers to estimate carbon and water fluxes in field-grown grape vines. Theoretical and Experimental Plant Physiology, 28, 241-254.. FLEXAS, J., BOTA, J., LORETO, F., CORNIC, G. and SHARKEY, T.D. (2004). Diffusive and metabolic limitations to photosynthesis under drought and salinity in C3 plants. Plant Biology, 6, 1-11.. GARCIA, R.L., NORMAN, J.M. and MCDERMITT, D.K. (1990). Measurements of canopy gas exchange using an open chamber system. Remote Sensing Reviews, 5, 141– 162.. GERARDIN, T., DOUTHE, C., FLEXAS, J., and BRENDEL, O. (2018). Shade and drought growth conditions strongly impact dynamic responses of stomata to variations in irradiance in Nicotiana tabacum. Environmental and Experimental Botany.. GIBBERD, M.R., WALKER, R.R., BLACKMORE, D.H and CONDON, A.G. (2001). Transpiration efficiency and carbon-isotope discrimination of grapevines grown under well-watered conditions in either glasshouse or vineyard. Australian Journal of Grape Wine Research, 7, 110-117.. GRECO, S. and BALDOCCHI, D.D. (1996). Seasonal variations of CO 2 and water vapour exchange rates over a temperate deciduous forest. Global Change Biology, 2, 183–197.. HOSHIKA, Y., OMASA, K. and PAOLETTI, E. (2013). Both ozone exposure and soil water stress are able to induce stomatal sluggishness. Environmental and Experimental Botany, 88, 19–23.. HOUGHTON, R.A. (1988). The global carbon cycle (letter to the editor). Science, 241, 1736.. 28.
(30) HOUGHTON, R.A., HOBBIE, J.E., MELILLO, J.M., MOORE, B., PETERSON, B.J., SHAVER, G.R. and WOODWELL, D.M. (1983). Changes in the carbon content of terrestrial biota and soils between 1860 and 1980: a net release of CO 2 to the atmosphere. Ecological Monographs, 53, 235–262.. JOHNSON, L. and PIERCE, L. (2004). Indirect measurement of leaf area index in California North Coast Vineyards. Hort Science, 39 (2), 236-238.. JONCKHEERE, I., FLECK, S., NACKAERTS, K., MUYS, B., COPPIN, P., WEISS, M. and BARET, F. (2004). Review of methods for in situ leaf area index determination: Part I. Theories, sensors and hemispherical photography. Agricultural and Forest Meteorology, 121 (1-2), 19-35.. JONES, H.G. (2014). Plants and Microclimate: a Quantitative Approach to Environmental Plant Physiology. Cambridge University Press.. LLORENS, J., GIL, E., LLOP, J. and ESCOLÀ, A. (2011). Ultrasonic and LIDAR sensors for electronic canopy characterization in vineyards: advances to improve pesticide application methods. Sensors, 11 (2), 2177-2194.. LOPES, C. and PINTO, P.A. (2005). Easy and accurate estimation of grapevine leaf area with simple mathematical models. Vitis, 44 (2), 55-61.. MAZZETTO, F., CALCANTE, A., MENA, A. and VERCESI, A. (2010). Integration of optical and analogue sensors for monitoring canopy health and vigour in precision viticulture. Precision Agriculture, 11 (6), 636-649.. MEDRANO, H., ESCALONA, J.M., BOTA, J., GULÍAS, J., and FLEXAS, J. (2002). Regulation of photosynthesis of C3 plants in response to progressive drought: the interest of stomatal conductance as a reference parameter. Annals of Botany, 89, 895– 905.. MERLI, M.C., GATTI, M., GALBIGNANI, M., BERNIZZONI, F., MAGNANINI, E., PONI, S. (2015). Water use efficiency in Sangiovese grapes (Vitis vinifera L.) subjected 29.
(31) to water stress before veraison: different levels of assessment lead to different conclusions. Functional Plant Biology, 42, 198–208.. NAM, N.H., SUBBAROA, G.V., CHAUHAN, Y.S. and JOHANSEN, C. (1998). Importance of canopy attributes in determining dry matter accumulation of pigeon pea under contrasting moisture regimes. Crop Science, 38, 955-961. O’NEIL, M., LANDIS, D., ISAACS, R. An inexpensive, accurate method for measuring leaf area and defoliation through digital image analysis. Journal of Economic Entomology, 95 (6), 1190-1194.. PETRIE, P.R., TROUGHT, M.C.T., HOWELL, G.D., BUCHAN, G.D. and PALMER, J.W. (2009). Whole-canopy gas exchange and light interception of vertically trained Vitis vinifera L. under direct and diffuse light. American Journal of Enology and Viticulture, 60, 173-182.. PHATTARALERPHONG, J., SATHORNKICH, J and SINOQUET, H. A photographic gap fraction method for estimating leaf area of isolated trees: assessment with 3D digitized plants. Tree physiology, 26 (9), 1123-1136.. PIRASTEH-ANOSHEH, H., SAED-MOUCHESHI, A., PAKNIYAT, H. and PESSARAKLI, M. (2016). Stomatal responses to drought stress. Water Stress and Crop Plants: A Sustainable Approach, Volume 1.. PONI, S., BERNIZZONI, F., CIVARDI, S., GATTI, M., PORRO, D. and CAMIN, F. (2009). Performance and water-use efficiency (single-leaf vs. whole- canopy) of wellwatered and half-stressed split-root Lambrusco grapevines grown in Po Valley (Italy). Agriculture, Ecosystems and Environment, 129, 97-106.. PONI, S., MAGNANINI, E., REBUCCI, B. (1997). An automated chamber system for measurements of whole-vine gas exchange. HortScience, 32, 64–67.. PONI, S., MERLI, M. C., MAGNANINI, E., GALBIGNANI, F. B, VERCESI, A. and GATTI, M. (2014). An improved multichamber gas exchange system for determining 30.
(32) whole-canopy water-use efficiency in grapevine. American Journal of Enology and Viticulture, 65 (2).. ROTTY, R.M. and MARLAND, G. (1986). Fossil fuel consumption: recent amounts, patterns, and trends of CO2. The changing carbon cycle, 474-490.. SÁNCHEZ DE MIGUEL, P., BAEZA, P., JUNQUERA, P. and LISSARRAGUE, J. R. (2010). Vegetative growth, total leaf area and surface indexes. Methodologies and Results in Grapevine Research, 31-44.. SCHULTZ, H.R. (1993). Photosynthesis of sun and shade leaves of field-grown grapevine (Vitis vinifera L.) in relation to leaf age. Suitability of the plastochron concept for the expression of physiological age. Vitis, 32, 197–205.. SCHULTZ, H.R., and STOLL, M. (2010). Some critical issues in environmental physiology of grapevines: Future challenges and current limitations. Australian Journal of Grape Wine Research, 16 (S1), 4-24.. SPAN, T.M. and HEEREMA, R. J. (2010). A simple method for non-destructive estimation of total shoot leaf area in tree fruit crops. Scientia Horticulturae, 125 (3), 528-533.. STRAIN, B.R. (1987). Direct effects of increasing atmospheric CO 2 on plants and ccosystems. Trends in Ecology & Evolution, 2, 18–21.. TAIZ, L. and ZEIGER, E. (2002). Plant Physiology.. TARARA, J.M. and PENA, J.E.P. (2015). Moderate water stress from regulated deficit irrigation decreases transpiration similarly to net carbon exchange in grapevine canopies. Journal of the American Society for Horticultural Science, 140, 413–426.. TARARA, J.M., PEREZ, J.E., KELLER, M., SCHREINER, R.P. and SMITHYMAN, R.P. (2011). Net carbon exchange in grapevine canopies responds rapidly to timing and extent of regulated deficit irrigation. Functional Plant Biology, 38, 386-400. 31.
(33) WILSON, J. W. (1960). Inclined point quadrats. New Phytologist, 59 (1).. WOODWARD, F.I., THOMPSON, G.B. and MCKEE, I.F. (1991). The effects of elevated concentrations of carbon dioxide on individual plants, populations, communities and ecosystems. Annals of Botany, 67, 23–38.. 32.
(34)
Figure


+7


Documento similar
a) Ao alumnado que teña superado polo menos 60 créditos do plan de estudos da licenciatura que inclúan materias troncais e obrigatorias do primeiro curso recoñeceráselles o
low river run-off (5 m 3 s ¡1 ) and Levitus August monthly mean, that corresponds to ENACW in the whole water column, imposed at the open boundary. Tidal currents are not
Lo más característico es la aparición de feldespatos alcalinos y alcalino térreos de tamaño centimétrico y cristales alotriomorfos de cuarzo, a menudo en agregados policristalinos,
Imparte docencia en el Grado en Historia del Arte (Universidad de Málaga) en las asignaturas: Poéticas del arte español de los siglos XX y XXI, Picasso y el arte español del
De esta manera, ocupar, resistir y subvertir puede oponerse al afrojuvenicidio, que impregna, sobre todo, los barrios más vulnerables, co-construir afrojuvenicidio, la apuesta
Index includes: access to improved drinking water and sanitation; the availability of renewable water and the reliance on external supplies; the relationship between available
• Inadvertently, virtual water will play a greater role in food trade – simply as a function of increasing water scarcity and the disparity of water availability between countries
The differing responses of the roots to drought and infection were reflected in the early reduction of photosynthetic activity and relative changes in biomass allocation under
