Comparison of the rate of spread between natural and constructed radiata pine litter samples at different wind speeds and controlling permeabilities
75
0
0
Texto completo
(2) PONTIFICIA UNIVERSIDAD CATÓLICA DE CHILE ESCUELA DE INGENIERÍA. COMPARISON OF THE RATE OF SPREAD BETWEEN NATURAL AND CONSTRUCTED RADIATA PINE LITTER SAMPLES AT DIFFERENT WIND SPEEDS AND CONTROLLING PERMEABILITIES. SOFIA FIGUEROA RAMIREZ. Members of the Committee: WOLFRAM JAHN VON ARNSWALDT MAGDALENA WALCZAK JUAN DE DIOS RIVERA AGÜERO NESTOR ESCALONA BURGOS. Thesis submitted to the Office of Research and Graduate Studies in partial fulfillment of the requirements for the degree of Master of Science in Engineering.
(3) Santiago de Chile, August 2018 © 2018, S OF ÍA F IGUEROA R AMIREZ. iii.
(4) Gratefully to my parents and siblings.
(5) ACKNOWLEDGEMENTS. I would like to start recognizing all those involved somehow in my learning process through my entire life as this thesis and paper summarize two years of hard work. Thanks to my family, to my mom who was always there for me, to my siblings who always made me laugh when I was stressed and specially to my dad, because he came with me to the forest, many kilometers aways, and helped me to get the samples needed for my experiments. He has always been there for me. Thanks friends for all the patience and support and for always motivating me to keep moving forward. I would also like to thank Ramón Mella, who allowed me to go sampling in several occasions to his forest and to Manuel Guerrero, who helped me with the sampling and set up of the experimental equipment. My time in the Mechanical Engineering Department was really amazing, specially thank to all the people who work there: Marcelo, Luis, Ingacio, Cristopher, Enrique, Miguel Ángel, Marı́a Paz, Katherine, Anita, Patricio and Manuel. Finally I want to specially thank professor Wolfram Jahn for his goodwill and for being always available and also for coming with me to sample very early in the morning.. v.
(6) TABLE OF CONTENTS. ACKNOWLEDGEMENTS. v. LIST OF FIGURES. viii. LIST OF TABLES. xi. ABSTRACT. xii. RESUMEN. xiii. 1.. Article introductory background Introduction . . . . . . . . . . . . . . . . . . . . . . . . . . . . . . . . .. 1. 1.1.1.. Wildfires’ situation . . . . . . . . . . . . . . . . . . . . . . . . . . .. 1. 1.1.2.. Objectives and hypothesis . . . . . . . . . . . . . . . . . . . . . . .. 4. 1.2.. Literature review . . . . . . . . . . . . . . . . . . . . . . . . . . . . . .. 5. 1.3.. Methodology . . . . . . . . . . . . . . . . . . . . . . . . . . . . . . . .. 7. 1.3.1.. Equipment and instrumentation . . . . . . . . . . . . . . . . . . . .. 7. 1.3.2.. Variables and parameters . . . . . . . . . . . . . . . . . . . . . . . .. 8. 1.3.3.. ROS determination – Semi-automatic flame tracker . . . . . . . . . .. 10. 1.3.4.. Statistical analysis . . . . . . . . . . . . . . . . . . . . . . . . . . .. 14. 1.4.. Results . . . . . . . . . . . . . . . . . . . . . . . . . . . . . . . . . . .. 16. 1.5.. Conclusions and future work . . . . . . . . . . . . . . . . . . . . . . . .. 19. 1.1.. 2.. 1. Comparison of the rate of spread between natural and constructed radiata pine litter samples at different wind speeds and permeabilities. 21. 2.1.. Introduction . . . . . . . . . . . . . . . . . . . . . . . . . . . . . . . . .. 21. 2.2.. Theoretical framework . . . . . . . . . . . . . . . . . . . . . . . . . . .. 25. Factors influencing RoS of forest litter . . . . . . . . . . . . . . . . .. 26. Materials and Methods . . . . . . . . . . . . . . . . . . . . . . . . . . .. 29. Experimental design . . . . . . . . . . . . . . . . . . . . . . . . . .. 29. 2.2.1. 2.3.. 2.3.1.. vi.
(7) 2.3.2.. Sampling technique . . . . . . . . . . . . . . . . . . . . . . . . . .. 33. 2.3.3.. Sample Preparation . . . . . . . . . . . . . . . . . . . . . . . . . . .. 35. 2.3.4.. Experimental procedure . . . . . . . . . . . . . . . . . . . . . . . .. 38. 2.3.5.. Data processing . . . . . . . . . . . . . . . . . . . . . . . . . . . .. 38. 2.4.. Results and Discussion . . . . . . . . . . . . . . . . . . . . . . . . . . .. 41. 2.5.. Conclusions . . . . . . . . . . . . . . . . . . . . . . . . . . . . . . . . .. 48. REFERENCES. 50. APPENDIX. 55. A.. First Appendix . . . . . . . . . . . . . . . . . . . . . . . . . . . . . . . .. 56. B.. Second Appendix. . . . . . . . . . . . . . . . . . . . . . . . . . . . . . .. 57. C.. Third Appendix . . . . . . . . . . . . . . . . . . . . . . . . . . . . . . .. 58. vii.
(8) LIST OF FIGURES. 1.1. Number of fires and affected surface per period during the last decade. Periods start on August and finish one year later according to CONAF’s public information available on their website. . . . . . . . . . . . . . . . . . . . .. 1.2. Distribution of types of fires and the surface they affect, based on the information of CONAF of the last decade’s yearly average. . . . . . . . . . .. 1.3. 2. 2. Ignition system of the wind tunnel, note that the sample holder does not appear in the picture. . . . . . . . . . . . . . . . . . . . . . . . . . . . . . . . . .. 8. 1.4. Stored natural sample after the box has been opened. . . . . . . . . . . . . .. 9. 1.5. Resulting frame of the first modifications of the videos, in order to prepare them for analysis. . . . . . . . . . . . . . . . . . . . . . . . . . . . . . . .. 10. 1.6. The glowing pine needles (circled) move separately from the flames ahead. .. 11. 1.7. Fire spreading through the path near the edges of the sample holder . . . . .. 12. 1.8. Frame of a cropped video ready for analysis. The zones along the edges of the sample holder were cut out . . . . . . . . . . . . . . . . . . . . . . . . . .. 12. Fire spotting and starting ahead the main fire front (circled) . . . . . . . . . .. 13. 1.10 Fire reigniting (circled) behind the main spreading flame . . . . . . . . . . .. 13. 1.11 Semi-automatic flame tracker with the RGB filters and contour finder . . . .. 14. 1.9. 1.12 Plot of the position of the flame in pixels versus time in seconds of the first set of experiment with conditions for wind speed and permeability of 3.6 m/s and 5 · 10−7 m2 respectively. . . . . . . . . . . . . . . . . . . . . . . . . . . . . 1.13 Plots of permeability curves of the mean rate of spreads obtained for each condition and their respective standard deviations as a function of wind speed. viii. 15.
(9) The permeability groups are made according to the results of the classification tree, in which each of these groups behave similarly for wind speeds greater than 1.3 m/s. . . . . . . . . . . . . . . . . . . . . . . . . . . . . . . . . . . 2.1. 18. Lateral view of the wind tunnel and plan view of the sample holder indicating the main dimensions and the position of the thermocouples; wind comes from the left. . . . . . . . . . . . . . . . . . . . . . . . . . . . . . . . . . . . .. 2.2. 31. Approximation curves for permeability of natural and constructed samples as a function of their bulk density Fehrmann et al. (2017), where APS, HPS and VPS stand for artificially reconstructed, horizontal and vertical permeability specimens, respectively. . . . . . . . . . . . . . . . . . . . . . . . . . . . .. 2.3. Other species found when collecting litter for constructed samples which are excluded. They were, however, present in the natural samples. . . . . . . . .. 2.4. 33. 35. Sampling materials used for the collection of natural samples. In the image a) corresponds to the wooden board placed over the site to sample, b) is used to place the samples in boxes, c) shows a horizontal knife used to cut the soil horizontally and d) is used to cut the borders of the sample. . . . . . . . . . .. 36. 2.5. Lateral and superior view of the natural sample once its edges have been cut .. 37. 2.6. A burned natural sample inside the sample holder. . . . . . . . . . . . . . .. 38. 2.7. Resulting frame of the video after the cropping, RGB filter and contour finder are performed. . . . . . . . . . . . . . . . . . . . . . . . . . . . . . . . . .. 2.8. 40. Classification tree of the data obtained from the experiments. The maximum number of levels of the tree was limited to four because by analysing the resulting trees when varying parameters, following splittings are not necessary to assess the results. . . . . . . . . . . . . . . . . . . . . . . . . . . . . . .. 2.9. Plots of permeability curves of the mean rate of spreads obtained for each condition and their respective standard deviations as a function of wind speed. ix. 43.
(10) The permeability groups are made according to the results of the classification tree, in which each of these groups behave similarly for wind speeds greater than 1.3 m/s. . . . . . . . . . . . . . . . . . . . . . . . . . . . . . . . . . . A.1. 47. Summary of studied variables and parameters by author and year of publishing 56. x.
(11) LIST OF TABLES. 2.1. Determination of the dry mass of needles md to introduce in the sample holder, where K is the desired permeability based on Fehrmann et al. (2017). . . . .. B.1. 32. Data on ROS filtered, experiments are separated by set. “wSpeed” is wind speed in m/s, “Perm” is permeability in 10−7 m2 , R2i is the coefficient for each experiment i within the same set of conditions and ROSi is the rate of spread in mm/s. Experiments 0 to 56 are made with constructed samples and 57 to 71 with natural samples. . . . . . . . . . . . . . . . . . . . . . . . . . . . . .. xi. 57.
(12) ABSTRACT. The rate of spread (ROS) in pine forest litter have been studied under laboratory conditions, but little research has been made regarding the differences between artificially constructed and natural litters. By using a specially designed sampling method, it was possible to asses within a combustion tunnel with controlled wind speed both natural and constructed samples, differences in the rate of spread. A total of 68 experiments were conducted at four levels of wind speeds and six levels of permeabilities, five for the constructed samples and a unique one for the natural samples. It was found that permeability has a strong influence in rate of spread when wind speeds are high (2.1 - 3.6 m/s), therefore, in zones prone to wildfires, forest litter with high permeabilities should be removed. Also, wind speed and permeability do have a strong influence on the rate of spread but their interaction effect is not significative, therefore, both of these variables may be treated independently from one another. Lastly, this research found that constructed samples with permeability of 1 · 10−7 m2 behaves similarly to natural samples. These promising findings suggests that it is possible to match the behaviour of the ROS between natural and constructed samples if the permeabilities are matched too, which would allow to use constructed samples in laboratory replicating field conditions. Keywords: permeability, rate of spread, constructed and natural samples.. xii.
(13) RESUMEN. La velocidad de propagación del fuego en lechos de pino han sido ampliamente estudiadas en condiciones de laboratorio, pero no se he investigado mucho acerca de las diferencias entre muestras reconstruidas artificialmente y muestras naturales. Mediante el uso de un método de muestreo especialmente diseñado, fue posible evaluar las diferencias en la velocidad de propagación de muestras naturales y construidas, dentro de un túnel de combustión y bajo condiciones de velocidad de viento controladas. En total, 68 experimentos se realizaron bajo cuatro velocidades de viento distintas y seis valores de permeabilidad, uno de ellos es único y está asociado a las muestras naturales. Se observó que la permeabilidad tiene una fuerte influencia en la velocidad de propagación cuando la velocidad del viento es alta (2.1 - 3.6 m/s), por lo tanto, en zonas propensas a incendios forestales, lechos con alta permeabilidad debiesen ser removidos. Además, la velocidad del viento y la permeabilidad tienen ambas una fuerte influencia en la velocidad de propagación del fuego, sin embargo, el efecto combinado de estas no es significativo y por lo tanto, ambas variables pueden ser tratadas de forma independiente. Por último, esta investgación concluyó que para muestras construidas con una permeabilidad de 1 · 10−7 m2 , la velocidad de propagación del fuego es similar a la de las muestras naturales, para las mismas velocidades de viento. Estos hallazgos son prometedores y sugieren que es posible imitar el comportamiento de la velocidad de propagación del fuego si es que las permeabilidades se igualan. lo que permitirı́a el uso de muestras construidas para replicar en laboratorio condiciones de campo. Keywords: permeabilidad, velocidad de propagación, muestras naturales y construidas.. xiii.
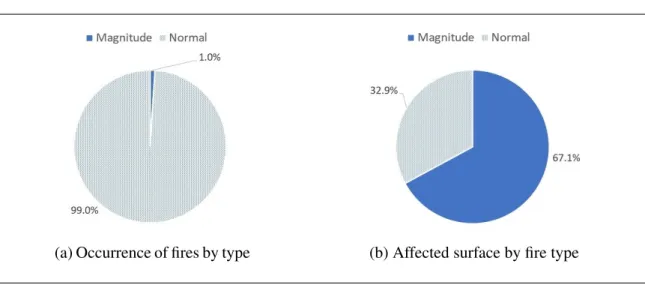
(14) 1. ARTICLE INTRODUCTORY BACKGROUND 1.1. Introduction 1.1.1. Wildfires’ situation Wildfires have been a common phenomenon throughout Chile’s history. Although forest fires have always been present in regions with Mediterranean climate such as California, central Chile, South Africa and Australia, and have actually shaped their ecosystems Bond (n.d.), fire events have grown in terms of frequency, intensity and damage Ubeda & Sarricolea (2016). Analysing the information and historical data published every year by the National Forest Corporation of Chile1, the overall tendency until 2016 was a slow but steady growth both in frequency of wildfires and burnt surface. During January and February of 2017 the tendency changed in terms of burnt area, but not in number of fires. As seen in Figure 1.1, last summer’s wildfires burnt five times more surface than the national yearly average of the last decade. As illustrated in Figure 1.1, there is no correlation between the number of fires and the affected surface. This is explained because magnitude fires (fires that burn more than 200 hectares) represent less than 1% of the total number of chilean wildfires in the last decade, but accounted for almost 60% of the total affected surface, as seen in Figure 1.2. In Chile, wildfires caused by natural means such as volcanic eruptions and lightnings represent only 1% of the total causes, the rest of the known causes are related to humans, either accidental of intentional Ubeda & Sarricolea (2016). Prevention of wildfires through education and a stronger protection of areas prone to wildfires are important, but understanding the propagation mechanisms of these fires is essential for an adequate control that prevents them from growing into larger ones Ubeda & Sarricolea (2016).. 1. Or CONAF by its Spanish name, Corporación Nacional Forestal. 1.
(15) Figure 1.1. Number of fires and affected surface per period during the last decade. Periods start on August and finish one year later according to CONAF’s public information available on their website.. (a) Occurrence of fires by type. (b) Affected surface by fire type. Figure 1.2. Distribution of types of fires and the surface they affect, based on the information of CONAF of the last decade’s yearly average. During the last decade, according to CONAF and leaving aside shrub and pasteurland, surface planted with radiata pine has been more prone to burning, representing 21.9% of 2.
(16) the affected area. However, the private sector invests 27 times more resources in protecting radiata pine plantations than the public sector in protecting native forest Aguirre (2016), which accounts for 16.8% of the affected surface. This is explained because the plantations of pine leave litter on the forest floor, which allows fire to spread by acting as a continuous matrix of fuel Fuentes & Consalvi (2014); Ganteaume et al. (2014); El Houssami et al. (2016) where the growth of the fire is sustained. The high flammability of forests is due to the presence of pine needle litter in large amounts, which are fine fuels and ignite easily, allowing a faster spread of the flames when compared to other woody fuels Jervis & Rein (2015). Authors like Fateh (Fateh et al., 2016), Ubeda Ubeda & Sarricolea (2016), Tihay Tihay et al. (2015) and Santoni Santoni et al. (2014) agree that in order to prevent and improve combat techniques, it is necessary to further study the fire dynamics of different types of vegetation and also the parameters influencing the rate of spread (ROS). This research focuses on studying and analysing the ROS of the fire front in forest litter, particularly radiata pine needle beds. Fire dynamics in pine needle beds of different species have been extensively studied in the past. Chiaramonti et al. Chiaramonti et al. (2017) studied the combustion dynamics and smoke emissions during the burning of pine needles from two species at two different scales, using a standard cone calorimeter and a large scale heat release cone calorimeter. Fateh et al. Fateh et al. (2016) performed experiments on pine needles in a cone calorimeter in order to study de gaseous emissions and other flammability metrics. Jervis et al. Jervis & Rein (2015) used the Fire Propagation Apparatus (FPA) to look for differences in fire behaviour parameters between live, dead and aged pine needles, at different moisture contests achieved by oven drying. Fuentes and Consalvi Fuentes & Consalvi (2014) varied fuel loads of pine needle samples and exposed them to different heat fluxes in the FPA. Santoni et al. Santoni et al. (2014) performed experiments in the FPA with different pine species in order to test the influence of permeability on fire dynamics, particularly on the heat release rate and time to ignition. Other authors performed experiments with pine litter in order to gather data for fire behaviour model validation Schemel et al. (2008); El Houssami et al. (2016); J. C. Thomas et al. (2017). 3.
(17) All of these studies were carried out using either the FPA or a cone calorimeter Simeoni et al. (2012), where the air flow is vertical. This is not representative of a real wildfire, as the buoyancy effect also influences fire dynamics Varner et al. (2015). Since fire propagation in the FPA or cone calorimeter is vertical (aligned with the air flow), measurements of the ROS are of less practical value, which is presumably the reason it was not reported in the above mentioned studies. The vast majority of studies have used constructed litter samples, which are not necessarily similar to samples in field conditions in terms of their physical properties. Natural litters accumulate on the floor in a relatively orderly fashion, as needles form layers when falling on top of each other Fehrmann et al. (2017). Only Ganteaume et al. Ganteaume et al. (2014) used natural litter samples, and found differences between the ROS of these natural and constructed samples, when matching the thickness of the samples Ganteaume et al. (2014).. 1.1.2. Objectives and hypothesis Since permeability is the main bulk property driving fire dynamics Santoni et al. (2014); Varner et al. (2015), it should be possible to match permeabilities between natural and constructed samples and achieve similar rate of spreads when burning the pine beds. The main objective of this research is to determine the rate of spread of the fire front in constructed and natural radiata pine litter beds, which are burnt in a controlled environment within a combustion tunnel, allowing an horizontal propagation of the fire and also to control the wind speed. The samples of radiata pine litter have different permeabilities and the goal is to determine how does the permeability influences the fire dynamics, in particular the rate of spread, when there are surface winds.. 4.
(18) 1.2. Literature review When forest fuel is exposed to a heat source, its water content is evaporated before pyrolysis begins. Under certain circumstances, the volatiles ignite resulting in flaming combustion until all the fuel is consumed and the flame extincts Varner et al. (2015). During the flaming combustion, the unburned fuel ahead is heated by radiative heat transfer from the flame, eventually starting the pyrolysis, and thus producing the gases that will ignite into new flames. This type of combustion is characterised mainly by visible flames occurring in the gas phase above the fuel. They can reach temperatures of 1500°C and spread at rates around 1000 mm h−1 . Smouldering combustion propagates much slower (ROS of around 1-50 mm h−1 ) and produces lower peak temperatures (between 500-700 °C) Rein et al. (2008). The ROS of a fire front in wildfires is mainly influenced by three environmental factors Rothermel (1972); Varner et al. (2015) which are Fuel Moisture Content (FMC), wind speed and slope. FMC is one of the most important parameters El Houssami et al. (2016). The higher the FMC of a fuel, more energy has to be supplied to the fuel in order to evaporate the water before the pyrolysis starts generating volatiles that can ignite J. A. N. C. Thomas et al. (2014). Wind speed is crucial for sustaining flaming combustion in litter beds because it provides oxygen to the fuel bed and it can also change the flame shape, influencing the preheating of the unburnt fuel ahead Simeoni et al. (2012). The slope of the fuel bed plays an important role too. The heat transfer by radiation rises with the slope due to purely geometric reasons Tihay et al. (2015), i.e. because the flame is closer to the unburnt fuel ahead. There are some authors that have studied the influence of the FMC on time to ignition, heat release rate, mass loss rate J. A. N. C. Thomas et al. (2014), exhaust gases composition Jervis & Rein (2015) and ROS Boboulos & Purvis (2012). Other authors have studied the limits of FMC for which there is fire propagation under different wind speeds Valdivieso & Rivera (2014); Fernandes et al. (2008). 5.
(19) Wind speed has also been studied for fire front propagation over pine litter beds. Valdivieso and Rivera Valdivieso & Rivera (2014), who studied the upper moisture content for fire propagation, and Kasymov Kasymov et al. (2016) and Fernandez-Pello FernandezPello et al. (2015) who studied the ignition of fuel beds by firebrands or other particles, varied the wind speed in their experiments within the range of 0–3 m s−1 . Other authors like Santoni Santoni et al. (2014) have considered natural or forced convection (without varying the speed), mainly due to the use of FPA or cone calorimeters in order to perform their experiments. The slope effect on fire spread has also been extensively studied. Additional to the work of Boboulos et al. Boboulos & Purvis (2012), Mendes-Lopes et al. Mendes-Lopes et al. (2003) also studied the ROS in pine needle beds and found that it increases with the wind speed for wind-driven fires but that for backing fire spread, the influence of wind is negligible. There is general consent that the steeper the slope, under otherwise same conditions, the fire spread velocity is faster. In most of the pine litter experiments reported in the literature, the sampling technique consists of collecting pine needles from the upper layer of the ground, transporting them to the laboratory, conditioning them to adjust the moisture content and finally placing them randomly in the sample holder. Only Ganteaume et al. have used undisturbed natural litter beds for their experiments Ganteaume et al. (2014). This research’s main finding is that the rate of spread is different whether natural or constructed samples are burnt. The geometric properties of the pine needle beds have a strong influence on their fire dynamics. Although the influence on rate of spread of bulk density, surface-to-volume ratio and loading of the fuelbed has been studied Varner et al. (2015), only one author Santoni et al. (2014) has studied the influence of permeability and actually found that it is the main bulk property driving the combustion dynamics of litters Varner et al. (2015). Another study Chiaramonti et al. (2017) performed combustion experiments using different species of pine needles, and also observed similar fire behaviours when permeabilities were the same among samples. 6.
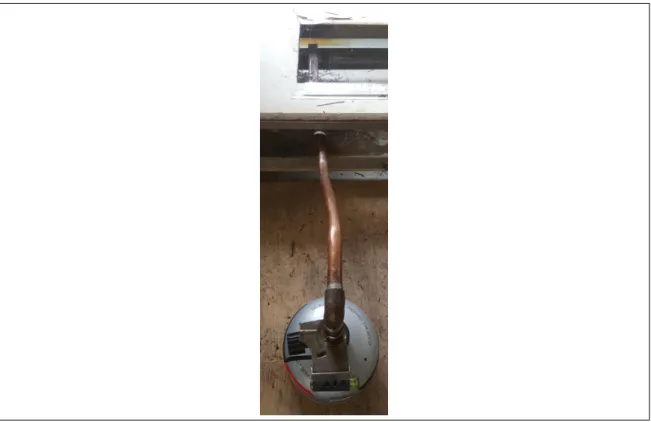
(20) In Appendix A, Figure A.1, there is a summary of studied variables and parameters in pine litter experiments. It is possible to see that so far, the influence of wind speed on rate of spread when permeability is being controlled has not been studied yet.. 1.3. Methodology 1.3.1. Equipment and instrumentation The combustion-wind tunnel where the experiments were carried out, consists of a stainless steel frame with acrylic walls, with a wind conditioning zone and a test zone. In the conditioning zone the wind temperature and speed is setted within a range from 0.2 to 5.2 m/s, aided with a vane anemometer which allows a precise adjustment of both temperature and speed of the wind. The heating of the wind is done by turning on quartz heaters. There are 16 of them and in order to achieve the desired temperature only some of them are turned on. In this zone, there is also an airflow homogenizer located before the quartz heaters which can heat up the tunnel up to approximately 35°C when wind speed is 5.2 m/s at an ambient temperature of 15 - 20 °C. The test zone consists of a sample holder in which pine needle beds are located. The sample holder is made entirely of fibrosilicatum boards and has eight thermocouples located from below and to the top of the pine needle bed. Above the tunnel there is a camera Sony α7s recording every experiment. This recordings will be analysed in order to gather data for rate of spread estimation. To start the experiments, an ignition system is required. This system consists of a copper tube connected to a butane can, as shown in Figure 1.3 located at the start of the sample holder, respect to the airflow direction. This system allows an homogeneous start of the fire.. 7.
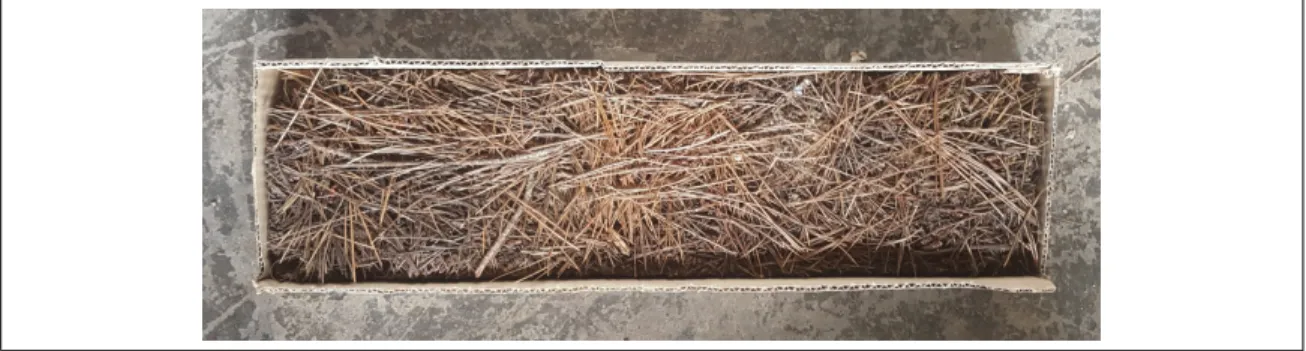
(21) Figure 1.3. Ignition system of the wind tunnel, note that the sample holder does not appear in the picture. 1.3.2. Variables and parameters The experiments consists of the burning of pine needle beds with different permeabilities, sampling methods and wind speeds, in order to measure the fire front speed. There is a total of 90 experiments, 75 of which are made using constructed samples and 15 using natural samples. All of the samples were collected from the central region of Chile, close to the sea shore (34°35’51.5”S, 71°52’29.6”W) and characterized because of its Mediterranean climate and prolonged dry season. The sampling methods for constructed and natural samples are different. Constructed samples consist of loose pine needles that are collected from the upper layer of the soil in the forest. The natural sampling technique requires more time and consists of grabbing a piece of the forest floor as it is. In order to do this, a wooden table with the same dimensions of the sample holder of the combustion tunnel is placed on top of the forest 8.
(22) floor. Then, using a knife, the borders have to be cut at a depth of approximately 40 mm. A specially designed instrument that resembles a knife is used to horizontally cut the soil. The sample is then ready to be carefully placed in a cardboard box as seen in Figure 1.4.. Figure 1.4. Stored natural sample after the box has been opened. Once the samples are in the laboratory, they are oven-dried in order to reduce their moisture content as close as possible to 0%. This is made because 0% FMC resembles critical wildfire conditions in many seasonally dry ecosystems Varner et al. (2015) and also to reduce the number of influencing variables on the rate of spread. The FMC obtained for the samples of this experiment range from 1% to 7%. Each day of burning, a portion of the samples were weighed and oven-dried at 60°C, then weighed again. The weight difference is the water that evaporated. Five different wind speeds (0.6, 1.3, 2.1, 2.8 and 3.6 m/s) are tested for both natural and constructed samples and for the latter, permeability is also a variable and has five different values. The natural samples have their own unique permeability but this geometric property can be controlled in constructed samples by varying their bulk densities Fehrmann et al. (2017). Five different values for permeability of constructed samples are tested (0.5, 1, 1.5, 3 and 5 · 10−7 m2 ) and each experiment is repeated three times. The values for the permeabilities were chosen similar to what other authors used in their laboratory Simeoni et al. (2012); Santoni et al. (2014) and also because the values of the permeability of natural samples round the lowest numbers of this range. 9.
(23) 1.3.3. ROS determination – Semi-automatic flame tracker As stated before, each experiment was filmed from above using a digital camera. The recordings were first processed in order to apply corrections to the position and orientation. In Figure 1.5, one resulting frame of a modified video is shown. Note that the green dots are the locations of the thermocouples.. Figure 1.5. Resulting frame of the first modifications of the videos, in order to prepare them for analysis.. The frames of these recordings were the input into for computational routine with the objective to semi-automatically track the flame base. It was not always possible to automatically track the base of the flame, due to phenomena like re-ignition, splitting of the fire front or counter-flow spread in cases of low wind speeds. The routine aids the user to find the base of the flame in each moment with as less bias as possible. In order to correctly use the semi-automatic flame-tracker and to make the user inputs as homogeneous as possible among the videos’ analysis, constraints and criteria must be defined because the fire front is not always linear. It is possible that two or more fire fronts appear and the difference between the flaming front and the smouldering front must also be considered. The fire front tends to travel faster near the edges of the sample box as they act as a discontinuity. All of the phenomena mentioned can difficult the measurement of the ROS. Therefore, the videos were carefully observed with the purpose of determining these phenomena. The following is a brief summary of the criteria and constraints defined to minimize the bias of the user.. 10.
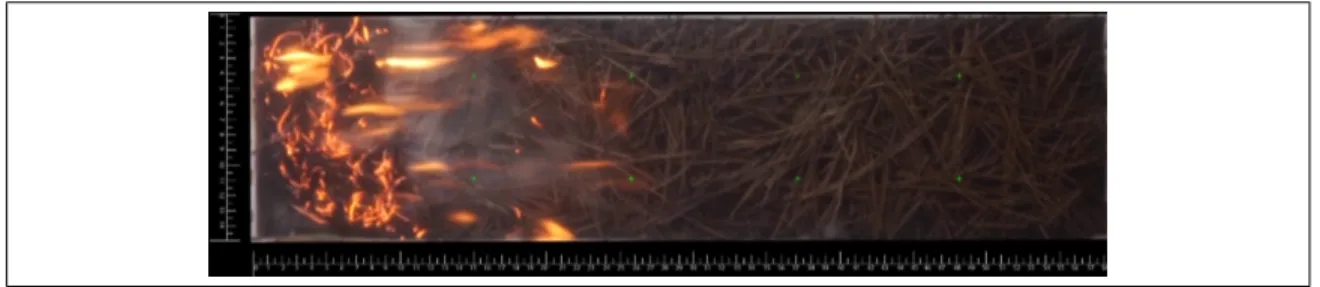
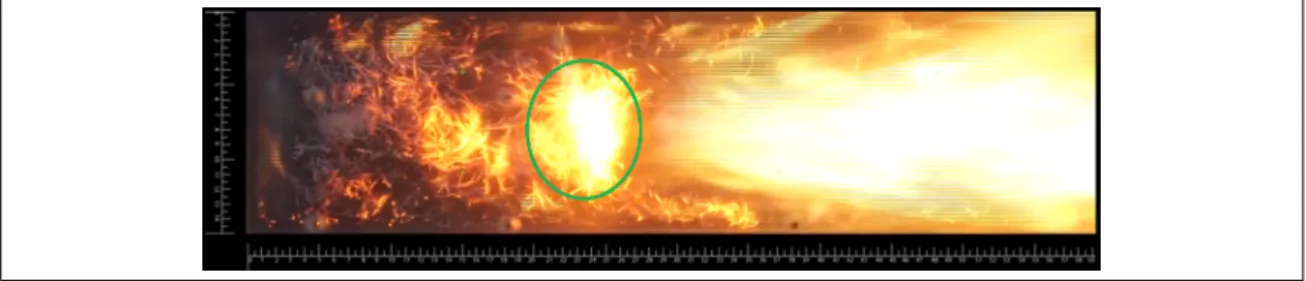
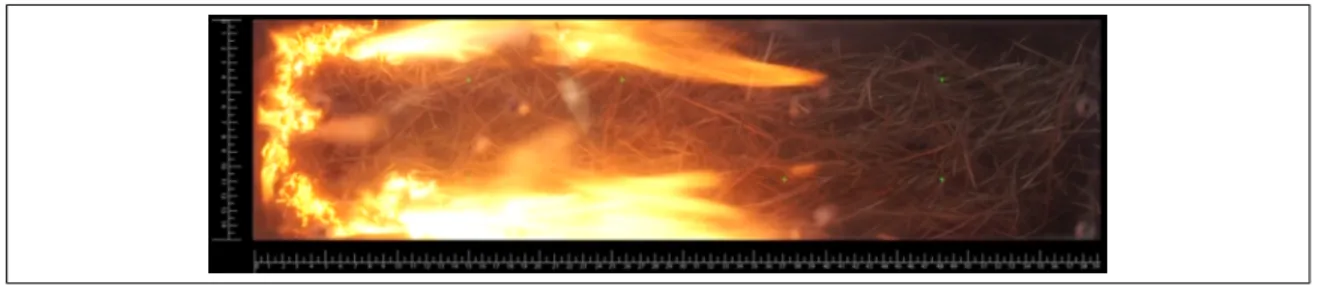
(24) (a) When the wind speed was high, it was possible to see a front of glowing pine needles and the flames above as shown in Figure 1.6. Sometimes they moved at the same speed but other times they did not. Since the flames are the first to arrive to the end of the sample holder, the base of them will be considered for measuring ROS and not the glowing embers.. Figure 1.6. The glowing pine needles (circled) move separately from the flames ahead. (b) Fire spread along the edges of the sample holder, as shown in Figure 1.7. This is possibly due to an involuntary sorting of the pine needles in which the zones near the edges had fewer needles, possibly resulting in a higher permeability. This happens because the average length of the needles is similar to the width of the sample holder. Moreover, the walls of the sample holder act as discontinuities and may affect fire spread. The fire front is not linear and tends to spread faster along the edges. To avoid the ROS difference between the centre and edges, the analysis zone for the ROS determination will be the rectangle delimited by the thermocouples, which are the green dots in the images, plus half of the distance to the edges. One resulting frame for analysis can be seen in Figure 1.8. The new analysis zone had in almost every experiment a linear fire front.. 11.
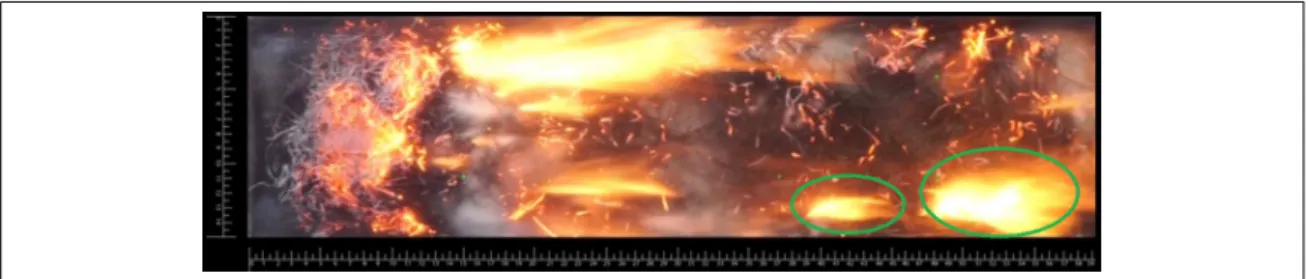
(25) Figure 1.7. Fire spreading through the path near the edges of the sample holder. Figure 1.8. Frame of a cropped video ready for analysis. The zones along the edges of the sample holder were cut out (c) Ignition of the fuel bed ahead when there is still a considerably distance between the first fire front and the new one, making the fire reach the end of the fuel bed faster. This is illustrated in Figure 1.9 and tends to occur when there are higher wind speeds, which lower the flame making it almost parallel to the ground and therefore it can easily start new fire spots ahead. For ROS determination, the main fire front will be considered unless the new fire front ahead joins the latter. If so, the measurement of the position against time of the flame will be terminated in that instant. Also, there may be reignition of the fuel bed behind once the flame has already passed, making the fire front grow bigger, as shown in Figure 1.10. The same criteria as before will be considered. Note that this criteria implies that in some experiments the ROS is estimated along the first or second half of the pine needle bed.. 12.
(26) Figure 1.9. Fire spotting and starting ahead the main fire front (circled). Figure 1.10. Fire reigniting (circled) behind the main spreading flame (d) Fire may move in the opposite direction of the wind speed. This phenomena was observed almost exclusively in natural samples when the wind speed was low. Another phenomena occurring under these conditions, is that the flames sometimes got extinct before it could reach the end of the fuel bed. For ROS determination, only the portion moving forward will be considered and during the time the flame is not extinct. The flames are tracked using an RGB filter and a contour finder. The RGB filter deletes from each frame of the recordings, everything that is not flames or embers. Then, the contour finder shows the user the borders of the flames and embers, as illustrated in Figure 1.11. Finally, the user has to click on the base of the flame, where the contour ends, and the routine stores the position and the frame number. This process is repeated every 1, 5, 13 or 25 frames, equivalent to 0.04, 0.2, 0.5 or 1 seconds of the recording. The user chooses this parameter in order to minimize the error induced by the flame flickering frequency. The routine of the semi-automatic flame tracker can be found in Appendix B.. 13.
(27) Figure 1.11. Semi-automatic flame tracker with the RGB filters and contour finder Once the data is gathered, the position in pixels versus frame number is processed in order to obtain position in pixels versus time in seconds for each experiments. The resulting plots of the slope, which represents the rate of spread, for one particular set of experiments, can be seen in Figure 1.12. The resulting R-squared for each linear regression made is also shown. Considering the set of every experiment made, the average R-squared obtained was 0.94 ± 0.04, which is a good fit. Once the R-squared of the linear regression of the pixels versus time is calculated, the conversion for pixels to millimetres is made and the linear regression performed on the data of position versus time for each experiments outputs the value of the slope, which is the rate of spread.. 1.3.4. Statistical analysis During the research 90 experiments were conducted but only 68 considered for analysis. There were 7 left out because it was not possible to track the flame in a consistent manner. The 15 experiments with a wind speed of 2.8 m/s were all discarded, because the samples used were not correctly dried due to a lack of space within the oven. Therefore, 68 experiments were left for analysis. For these experiments, the average R2 for the linear regressions performed on their data was 0.941 ± 0.043. The summary of the results can be found in appendix B. In order to assess the results and find significant relationships between variables, a Classification and Regression Tree Analysis (C&RT) is performed. This analytic tool helps to determine the most important variables within a dataset. The process is similar to 14.
(28) Figure 1.12. Plot of the position of the flame in pixels versus time in seconds of the first set of experiment with conditions for wind speed and permeability of 3.6 m/s and 5 · 10−7 m2 respectively. other regression techniques, but allows for a simpler way to visualise the data thus making the interpretation easier Morgan (2014). The classification tree was made using the SPSS software. There are two independent variables, wind speed and its five different levels (0.6, 1.3, 2.1, 2.8 and 3.6 m/s) and permeability with six different levels (0.5, 1, 1.5, 3, 5 · 10−7 m2 and natural’s sample permeability which is unique). The dependent variable is the rate of spread. This analysis splits the experiments by groups according to the dependent variable, 15.
(29) when there is statistical significance to assure that the behaviour of this group is indeed different from other groups with different levels of wind speeds and permeabilities. A two-way ANOVA is also performed in order to see the results in a different manner, which led to the fact that the resulting categories of the classification tree behaves significantly different according to a trust level of 90%, which was particularly chosen for this analysis.. 1.4. Results Santoni et al. Santoni et al. (2014) concluded that permeability is the main bulk property driving fire dynamics in pine needle beds, but these observations were tested only under natural and forced convection, and therefore the influence of high winds on the combustion dynamics of litters is yet unknown. The purpose of the following analysis is to complement the work made by Santoni et al.Santoni et al. (2014), who were not able to test their experiments for different wind speeds nor for natural samples. If permeability is the main bulk property to drive fire dynamics, then it could be possible to satisfactorily reproduce the ROS of natural litter beds with constructed litter beds of the right permeability. For constructed samples it is easy to achieve a certain permeability, but for natural samples, the permeability is unique, fixed and hard to estimate. According to the available data, permeability of natural samples varies between 1 and 0.4 · 10−7 m2 Fehrmann et al. (2017). The levels chosen for permeability of constructed samples are 5, 3, 1.5, 1 and 0.5 · 10−7 m2 . The two-way ANOVA showed that the main effect on the ROS–consistency of both wind speed and permeability are significant (P = 0.0001 and P = 0.035, respectively). The combined effect of wind and permeability is not significant (P = 0.263), meaning that the influence of these variable on the ROS is equal to the sum of their independent effects separately, therefore, there is no added effect by combining both variables.. 16.
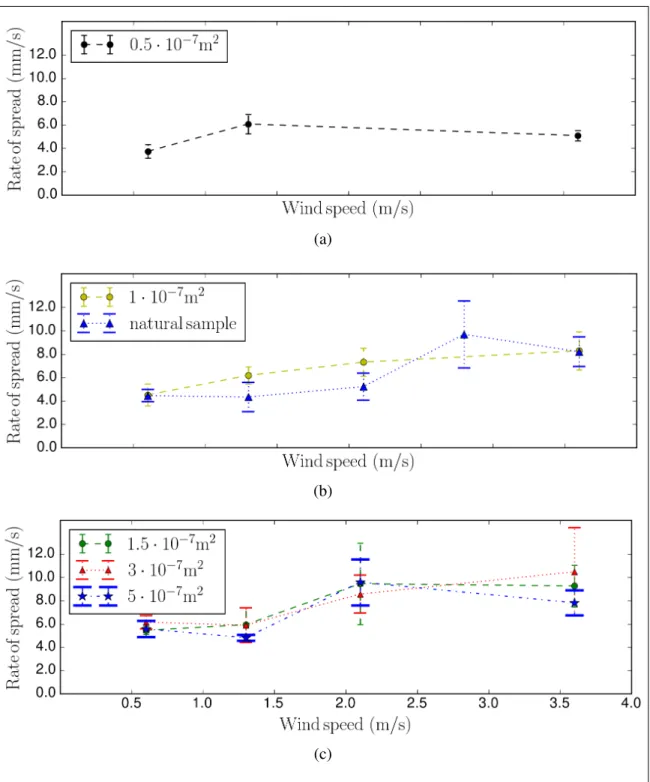
(30) The main effects are significant at some level of the independent variables, therefore, the analysis of the results of the two-way ANOVA and the classification tree of Figure 2.8 should be assessed. A higher permeability results in a more rapid fire spread only when wind speed is equal or higher than 2.1 m/s. While this was expected for the case of smouldering (where the air must flow through the bed), it confirms the conjecture that a surface wind will induce an air flow in the bed, and that permeability is, as originally proposed by Santoni, an important parameter for determining the ROS over a litter bed. For higher wind speeds (2.1 - 3.6 m/s) and very low permeability (0.5 · 10−7 m2 ) the mean ROS is 5.1 mm/s, which differs a lot for the results with same wind speed ranges but higher permeabilities (1.5 - 3 - 5 · 10−7 m2 ), where the mean ROS is 9.2 mm/s. This could be explained because the air is not able to flow trough the pine needle bed due to the high level of compaction, independent of the value of the wind speed. Figure 2.8 shows that for lower wind speeds (0.6 and 1.3 m/s in this experiment), the difference between rate of spreads by type of sample is not significant. This means that permeability does not have a significant influence on ROS when the wind speed is low compared to the relative influences within this dataset. For higher wind speeds (2.1 and 3.6 m/s), the type of samples are separated in three categories. These categories are C0.5, C1.5 - C3 - C5 and C1 - N. This means, that the natural samples behave significantly similar to the constructed samples which have a permeability equal to 1 · 10−7 m2 , for high wind speeds. This information is illustrated in Figure 2.9. Moreover, Figure 2.9b also shows that the ROS in natural samples is unaffected by wind speeds lower than 2.8 m/s. This could be due to the particular ordering of the pine needles. When they fall from the trees, the litter grows by layers with a low permeability in the horizontal direction which tends to be higher than the permeability in the vertical direction Fehrmann et al. (2017)2. This restricts the amount of air flowing through the sample and consequently limits the ROS. Only for significant wind speeds the air penetrates sufficiently to induce a stronger air-flow. 2. For the same range of bulk density, horizontal permeability varies between 1 and 0.5 · 10−7 m2 and vertical permeability between 1 and 0.1 · 10−7 m2. 17.
(31) (a). (b). (c). Figure 1.13. Plots of permeability curves of the mean rate of spreads obtained for each condition and their respective standard deviations as a function of wind speed. The permeability groups are made according to the results of the classification tree, in which each of these groups behave similarly for wind speeds greater than 1.3 m/s. 18.
(32) 1.5. Conclusions and future work The fire dynamics of pine needle beds has been extensively studied during the lasts decades and has primarily focused on understanding how does different variables influence the rate of spread. Since the wildfires have shown a steady tendency of growth in terms of intensity and affected surface, it is very important to understand how does the fire spread so fast in order to develop new techniques to mitigate them. This research focused on studying how does wind speed and permeability influences the rate of spread and also into assessing the differences of fire behaviour between natural and constructed samples. Note that the results and findings published in this study are valid only for the conditions and ranges specified in the previous section and they should not be extrapolated to other species of pine tree nor other variables. The main findings are as following: • Given that permeability has a strong influence when wind speeds are high, which is the case in the Mediterranean countries during the summer, forest litter on the ground characterized by having higher permeabilities should be removed because they represent higher hazard compared to litter with lower permeability. Another way of lowering permeability should be related to compaction, but as seen in Fehrmann’s findings Fehrmann et al. (2017) in Figure 2.2, permeability of pine needle natural samples does not vary much by increasing bulk density, which is the equivalent of compacting the sample. • Wind speed and permeability do have a strong influence on the rate of spread, and since the influence of their interaction effect is not significative, both of these variables may be treated independently from one another. • The values for ROS of this research and Ganteaume’s are similar, although the sampling technique and place are different. This research found that constructed samples with permeability of 1 · 10−7 m2 behaves similarly to natural samples. These findings suggests that it is possible to match the behaviour of the ROS 19.
(33) between natural and constructed samples if the permeabilities are matched too. The practical implications of these finding are promising. By matching permeabilities it is possible to obtain similar fire spread behaviour with constructed litter samples, therefore it should be possible to use constructed samples in the laboratory replicating field conditions. It is preferable to use constructed samples because collecting natural samples is difficult and time consuming. Further research and more experiments are required in order to find the exact relationship between natural and constructed samples that will allow a similar fire behaviour. Another variable that should be considered in future work, is the moisture content. The moisture content lowers the rate of spread because part of the heat released by the combustion is used to evaporate the moisture. This variable induces a strong appearance of smouldering, which is a slower form of combustion which unlike flaming combustion, consumes the fuel.. 20.
(34) 2. COMPARISON OF THE RATE OF SPREAD BETWEEN NATURAL AND CONSTRUCTED RADIATA PINE LITTER SAMPLES AT DIFFERENT WIND SPEEDS AND PERMEABILITIES 2.1. Introduction Wildland fires have always been present in regions with Mediterranean climates. In fact, fire is frequently an integral part of the ecosystem in these regions, determining their landscape structure and composition, and shaping their ecosystems since the Paleozoic Bond (n.d.). However, human influence has significantly altered the frequency and extension of wildfires, and during the last years wildfires have become a major hazard to many regions and countries, such as California, central Chile, South Africa, south Australia and the Mediterranean Basin. Between January and November of 2017, 3.6 million ha burnt in the USA according to the National Interagency Fire Center. This is 40% higher than the year to year average from the last decade. The number of fires occurred during 2017, however, is lower by 10% compared to the year to year average from the last decade. This suggests that the number of large fires, which are considered to consume more than 400 ha, have risen. In Europe, the burnt area during 2017 increased in almost every country in comparison to the yearly average of the last decade. The most critical case is Portugal, where the increase of burnt area so far is seven times larger than the average, according to the European Forest Fire Information System 1. Although many factors influence the overall fire risk, experts agree that as a consequence of climate change wildfire frequency and intensity will increase in the future due to warmer and drier summers Hennessy et al. (2005); Flannigan et al. (2009). As wildfires account for approximately 23% of the anthropogenic greenhouse emissions Surawski et al. (2015), they actively contribute to climate change resulting in a positive feedback loop.. 1. Retrieved from http://effis.jrc.ec.europa.eu/ in August 2017.. 21.
(35) Wildfires have been a common phenomenon throughout Chile’s history, but similarly to many other Mediterranean countries, fire events have grown in terms of frequency, intensity and damage Ubeda & Sarricolea (2016). Analysing the information and historical data published every year by the National Forest Corporation of Chile2, the overall tendency until 2016 was a slow but steady growth both in frequency of wildfires and burnt surface. During January and February of 2017 the tendency changed in terms of burnt area, although not in terms of number of fires. According to data published by CONAF, last summer’s wildfires burnt five times more surface than the national yearly average of the last decade. CONAF also reports that large fires represented less than 1% of the total number of Chilean wildfires in the last decade, but accounted for almost 60% of the total affected surface. In Chile, wildfires caused by natural means such as volcanic eruptions and lightnings represent only 1% of the total causes. Accidental wildfires caused by humans represent 56% and intentional fires (for agricultural land management or arson) 28%. The rest are unknown causes according to CONAF’s latest report. Understanding the propagation mechanism of these fires is essential for an adequate control and management that prevents them from growing into large fires Ubeda & Sarricolea (2016). During the last decade, out of the total burnt surface in Chile, 21.9% are plantations of radiata pine. Other non native plantations represent 10.9%, while native forest and shrub and pasteurland represent 16.8% and 50.4%, respectively. Plantations belong to private companies, while native forest is under public management. During 2017 the private sector invested 27 times more resources than the public sector in protective measures Aguirre (2016). Nevertheless, radiata pine plantations were still the most affected by fires in terms of burnt surface. In spite of all the monetary investment made by the private sector and the effort of the government to educate people, the number of fires and burnt surface area is still rising. Authors like Fateh Fateh et al. (2016), Ubeda Ubeda & Sarricolea (2016), Tihay Tihay 2. Or CONAF by its Spanish name, Corporación Nacional Forestal. 22.
(36) et al. (2015) and Santoni Santoni et al. (2014) agree that in order to prevent and improve combat techniques, it is necessary to further study the fire dynamics of different types of vegetation and also the parameters influencing the rate of spread (RoS) and intensity of a wildfire. Moreover, studying forest litter combustion is important, because as authors like Jervis Jervis & Rein (2015), Fuentes Fuentes & Consalvi (2014), Ganteaume Ganteaume et al. (2014) and El Houssami El Houssami et al. (2016) have stated, litter allows the fire to spread, sustaining its growth and transition to crown fires. Hazardous wildland fuel (in particular pine needle beds) accumulates on the forest floor and near structures located in the Wildland Urban Interface, increasing the fire risk Mell et al. (2010); El Houssami et al. (2016). Actually, the high flammability of forest in the Mediterranean area is mostly due to the presence of pine needle litter in large amounts, which ignites easily and allows for the flames to spread faster than other woody fuels Jervis & Rein (2015). The present study focuses on assessing and analysing the RoS of the fire front in forest litter, particularly radiata pine needle beds.. Fire dynamics in pine needle beds of differ-. ent species have been extensively studied in the past. Chiaramonti et al. Chiaramonti et al. (2017) studied the combustion dynamics and smoke emissions during the burning of pine needles from two species at two different scales, using a standard cone calorimeter and a large scale heat release cone calorimeter. Their main findings are related to changes in some flammability metrics as a result of both species and scale. They did not report measurements of RoS. Fateh et al. Fateh et al. (2016) performed experiments on pine needles in a cone calorimeter in order to study de gaseous emissions and other flammability metrics. They found that although pine needles are thermally thin, the pine needle beds behave as a thermally thick material. RoS was not measured in this study. Jervis et al. Jervis & Rein (2015) used the Fire Propagation Apparatus (FPA) to look for differences in fire behaviour parameters between live, dead and aged pine needles, at different moisture contests achieved by oven drying. They concluded that the moisture content is important in the burning behaviour, but the differences in fire behaviour obtained for live and dead samples could not be explained only because of moisture content, but plant chemistry and sample drying should also be taken into account. Fuentes and Consalvi Fuentes & 23.
(37) Consalvi (2014) varied fuel loads of pine needle samples and exposed them to different heat fluxes in the FPA. They concluded that an augmentation in fuel load usually reduces permeability which influences the flow conditions inside the fuel beds. Santoni et al. Santoni et al. (2014) performed experiments in the FPA with different pine species in order to test the influence of permeability on fire dynamics, particularly on the heat release rate and time to ignition. They found that the behaviour is similar when permeabilities are matched across these three species rather than any other property, although measurements of RoS were not reported. Other authors performed experiments with pine litter in order to gather data for fire behaviour model validation Schemel et al. (2008); El Houssami et al. (2016); J. C. Thomas et al. (2017). All of these studies were carried out using either the FPA or a cone calorimeter Simeoni et al. (2012), where the air flow is vertical. This is not representative of a real wildfire, as the buoyancy effect also influences fire dynamics Varner et al. (2015). Since fire propagation in the FPA or cone calorimeter is vertical (aligned with the air flow), measurements of the RoS are of less practical value, which is presumably the reason it was not reported in the above mentioned studies. The vast majority of studies have used constructed litter samples, which are not necessarily similar to samples in field conditions in terms of their physical properties. Natural litters accumulate on the floor in a relatively orderly fashion, as needles form layers when falling on top of each other Fehrmann et al. (2017). Only Ganteaume et al. Ganteaume et al. (2014) used natural litter samples, and found differences between the RoS of these natural and constructed samples, when matching the thickness of the samples Ganteaume et al. (2014). Santoni et al. Santoni et al. (2014) concluded that permeability is the bulk property that has a major influence in the RoS in pine litter beds, although the degree of influence of this property with real surface winds was not studied. Based on Santoni’s conclusions, Fehrmann et al. Fehrmann et al. (2017) measured the difference in permeability between constructed samples with different bulk densities and natural samples, finding that natural samples are much less permeable than constructed ones. However, whether 24.
(38) the permeability of the litter bed affects the flame spread velocity is cannot be conclusively confirmed by those studies. The objective of the present study is to analyse the influence of physical characteristics of the fuel bed (in particular permeability) and of the wind speed on the RoS, and to assess the difference in burning behaviour of natural litter beds and constructed litter samples. For this purpose samples are arranged in a realistic manner within a wind tunnel, so that the flaming front propagates horizontally. Natural litter samples are collected directly from the forest floor with as little alteration as possible. A layer of forest soil is included to maintain their physical integrity. Reconstructed litter beds are built from recollected pine needles with different levels of permeability. The experimental set-up is conceived in a manner such that it represents an intermediate step between full scale field experiments and laboratory experiments conducted in the FPA or the cone calorimeter. Field experiments are difficult and expensive to conduct, and due to the large amount of external factors, it is very hard to achieve repeatability. With traditional laboratory experiments (FPA or cone calorimeter), on the other hand, it is difficult to replicate realistic conditions (e.g. forced air-flow through the sample), and thus they usually focus on fuel characterisation, rather than fire spread. A two-way ANOVA analysis is performed on the data of the experiments with constructed samples in order to assess the interaction effect of the two independent variables, permeability and wind speed, on the RoS.. 2.2. Theoretical framework When forest fuel is exposed to a heat source, its water content is evaporated before pyrolysis begins. Under certain circumstances, the volatiles produced by pyrolysis ignite resulting in flaming combustion until all the fuel is consumed and the flame extincts Varner et al. (2015). If the volatiles produced in the pyrolysis do not ignite, combustion can still take place in the form of flameless smouldering combustion. In this case the char produced by the pyrolysis reacts heterogeneously with oxygen from the air.. 25.
(39) In the case of flaming combustion the unburned fuel ahead is heated by radiative heat transfer from the flame, eventually starting the pyrolysis, and thus producing the gases that will ignite into new flames. This type of combustion is characterised by visible flames occurring in the gas phase above the fuel. They can reach temperatures of up to 1500°C and spread at rates around 1000 mm h−1 . Smouldering combustion propagates much slower (RoS of around 1-50 mm h−1 ) and produces lower peak temperatures (between 500-700 °C) Rein et al. (2008). Smouldering combustion is common in porous fuels where air can penetrate in order to provide the oxygen necessary for combustion, including natural fuels such as forest pine litters Rein (2016). Smouldering might occur during long periods, and eventually lead to flaming combustion Aldushin et al. (2007). It is generally harder to suppress than flaming combustion, because, unlike flaming combustion, which is shallower, smouldering penetrates deep into the forest soil layers Rein (2016). Propagation of forest fires can also occur by smouldering firebrands, which are glowing particles (branches, seed etc) produced during wildfires and transported by the wind over several kilometres, starting new fires far ahead Manzello et al. (2006). These firebrands can initiate smouldering combustion and even transition to flaming, as observed by some authors Kasymov et al. (2016).. 2.2.1. Factors influencing RoS of forest litter The RoS of a fire front in wildfires is mainly influenced by three environmental factors Rothermel (1972); Varner et al. (2015), the fuel moisture content (FMC), wind speed and slope. Fuel moisture content is one of the most important parameters El Houssami et al. (2016). The higher the FMC of a fuel, more energy has to be supplied to the fuel in order to evaporate the water before the pyrolysis starts generating volatiles that can ignite J. A. N. C. Thomas et al. (2014). Wind is crucial for sustaining flaming combustion in litter beds because it provides oxygen to the fuel bed and it can also change the flame shape, influencing the preheating of the unburned fuel ahead Simeoni et al. (2012). The 26.
(40) slope of the fuel bed also plays an important role because the heat transfer by radiation rises with the slope due to purely geometric reasons Tihay et al. (2015) Many authors rely on dry flammability, i.e. they oven-dry the pine litter samples, until the FMC is close to 0% and then perform the experiments Fuentes & Consalvi (2014); Santoni et al. (2014). The argument made for this method is that it resembles critical wildfire conditions in many seasonally dry ecosystems Varner et al. (2015). There are some authors that have studied the influence of the FMC on time to ignition, heat release rate, mass loss rate J. A. N. C. Thomas et al. (2014), exhaust gases composition Jervis & Rein (2015) and RoS Boboulos & Purvis (2012). Other authors have studied the limits of FMC for which there is fire propagation under different wind speeds Valdivieso & Rivera (2014); Fernandes et al. (2008). Moisture content has a damping effect on RoS Catchpole et al. (1998), which is why in this study all the samples will be oven-dry in order to focus on dry flammability as described before. Wind speed has also been widely studied for fire front propagation over pine litter beds. Valdivieso and Rivera Valdivieso & Rivera (2014), who studied the upper moisture content for fire propagation, and Kasymov Kasymov et al. (2016) and Fernandez-Pello Fernandez-Pello et al. (2015) who studied the ignition of fuel beds by firebrands or other particles, varied the wind speed in their experiments between 0 and 3 m s−1 . Wang Wang et al. (2016) compared fire behaviour parameters of smouldering and flaming combustion in radiata pine needles also varying the speed, finding that smouldering combustion occurs only when airflow velocity was low – for high wind speeds, flaming occurred. Other authors (e.g. Santoni Santoni et al. (2014)) have considered natural or forced convection (without varying the speed), mainly due to the use of FPA or cone calorimeters in order to perform their experiments. The slope effect on fire spread has also been extensively studied. Additional to the work of Boboulos et al. Boboulos & Purvis (2012), Mendes-Lopes et al. Mendes-Lopes et al. (2003) also studied the RoS in pine needle beds and found that RoS increases with the wind speed for wind-driven fires but that for backing. 27.
(41) fire spread, the influence of wind is negligible. There is general consent that the steeper the slope, under otherwise same conditions, the fire spread velocity is faster. In most of the pine litter experiments reported in the literature, the sampling technique consists of collecting pine needles from the upper layer of the ground, transporting them to the laboratory, conditioning them to adjust the moisture content and finally placing them randomly in the sample holder. Only Ganteaume et al. have used undisturbed natural litter beds for their experiments Ganteaume et al. (2014). Their sampling method approximates the real field composition more closely, because not only pine needles are collected, but also other species found in the forest litter. This is desirable in order to structurally escalate laboratory results to wildland fires Varner et al. (2015).. 2.2.1.1. Forest litter The chemical composition and geometric properties are the main characteristics of a fuel in terms of their influence on the RoS. Chemical composition may be different for species within the same family. This has been studied by several authors for pine litter Bartoli et al. (2011); Boboulos & Purvis (2012).. Jervis et al. analysed the fire. spread differences among live, aged and dead pine needles and their findings were related to changes in the chemical composition when oven-drying Jervis & Rein (2015); Varner et al. (2015). They concluded that the pine needle’s state influenced the fire behaviour, although to what degree was not quantified. Geometric properties are of interest because pine litter beds are porous. Some parameters related to their geometry are fuel load, porosity, bulk density, surface to volume ratio, fuel bed depth and permeability. All these parameters are physically related. Fehrmann et al. found evidence for a relationship between bulk density and permeability Fehrmann et al. (2017), while Santoni et al. found a relationship between porosity and permeability in pine needles Santoni et al. (2014).. 28.
(42) Permeability is a property that relates pressure drop through the material to flow velocity. It is independent of the fluid and its velocity, and it is related to the specific geometric configuration of the material, taking into account the connectivity between pores Fehrmann et al. (2017). It has been shown that permeability affects the combustion rates by changing the flow of oxygen through the fuel bed Varner et al. (2015). The geometric properties of the pine needle beds have a strong influence on their fire dynamics. Although the influence on rate of spread of bulk density, surface-to-volume ratio and loading of the fuelbed has been studied Varner et al. (2015), only one author Santoni et al. (2014) has studied the influence of permeability and actually found that it is the main bulk property driving the combustion dynamics of litters Varner et al. (2015). Another study Chiaramonti et al. (2017) performed combustion experiments using different species of pine needles, and also observed similar fire behaviours when permeabilities were the same among samples.. 2.3. Materials and Methods In this section an account of the methodology and the equipment used is given. First the experimental setup is presented, and then an overview of the sample preparation process is provided. Finally the experimental procedure and data analysis is explained.. 2.3.1. Experimental design 2.3.1.1. Equipment and instrumentation The combustion and wind tunnel where the experiments were carried out, consists of a stainless steel frame with acrylic walls, with a wind conditioning zone and a test zone. The total length of the wind tunnel is 2.19 m of which 1.06 m correspond to the test zone. The cross section of the tunnel available for air flow is 320 × 320 mm, and is constant along the full length. A fan is located at the entrance of the wind conditioning zone for flow generation. Flow velocity can be controlled from a minimum of 0.2 m/s to a maximum 29.
(43) of approximately 5.2 m/s by changing the voltage of the electric power supply using an autotransformer. The wind conditioning zone has an airflow homogeniser immediately after the fan. The airflow homogeniser consists of an aluminium sheet grill, made of 1 mm thick sheets at 40 mm intervals and 130 mm deep.. The wind temperature is controlled by means. of 16 quartz heaters located in the conditioning zone, with a total power of 8 kW. This allows increasing the air temperature by up to 12°C at maximum velocity. At the end of the conditioning zone there is a vane anemometer used to measure the wind temperature and verify its speed. For velocities ranging from 0.2–5.2 m/s, the velocity profile corresponds to a turbulent flow3 resembling a “top hat” profile typical for this type of flow. The Reynolds number varied for the mentioned velocity range from 4000 to 100000, which corresponds to the transition from laminar to turbulent flowValdivieso & Rivera (2014). The test zone is in the second half of the tunnel, with a rectangular sample holder where the pine needle bed is placed. The sample holder is made of fibrosilicatum boards of 12 mm thickness. The depth of the sample holder is 40 mm. All other dimensions are shown in Figure 2.1. Eight thermocouples are inserted through the bottom of the sample holder and positioned at a vertical height of 2 mm above the top of the holder. The thermocouples are connected to a data acquisition system which is connected to a computer that registers temperatures every 340 ms. There is another thermocouple positioned between the start of the test zone and the beginning of the sample holder from left to right. This is used to measure the wind temperature and adjust it according to need. Above the tunnel a digital camera (Sony α7s) recorded the experiments. The ignition system consists of a copper tube connected to a butane can. The tube has two sets of holes side by side with a diameter of 0.5 - 1 mm approximately. The sample holder has a cut-out in the lateral wall through which the copper tube can be introduced 3. See Valdivieso & Rivera (2014) for details on how this was measured.. 30.
(44) Figure 2.1. Lateral view of the wind tunnel and plan view of the sample holder indicating the main dimensions and the position of the thermocouples; wind comes from the left. once the sample has been placed in the wind tunnel. This igniter provides a uniform flame along the width of the sample holder, which ignites the sample and starts the burn.. 2.3.1.2. Variables and parameters Since the main objective of this study is to compare the RoS in constructed and natural samples for different wind speeds, the two main controlled variables are the wind speed and the permeability of the constructed samples. Five different wind speeds were used, 0.6, 1.3, 2.1, 2.8 and 3.6 m/s, respectively. In the regions of high fire risk during the dry season in Chile, wind speeds can reach up to 4 m/s on certain days, according to the Meteorology Direction of Chile. The air temperature 31.
(45) was controlled by using the quartz heaters. The target temperature ranges between 31°C and 34°C, which is similar to the average temperature during the dry season in the most fire prone zones in Chile. The permeability of the constructed samples was chosen before the tests based on the work of Fehrmann Fehrmann et al. (2017), in which a relationship between bulk density of the sample and permeability is derived, as shown in Figure 2.2. The values of permeability chosen to perform the experiments are shown in Table 2.1 and they are obtained from equation (2.1), where ρb is the bulk density. This equation is valid for bulk densities ranging from 10 to 110 kg/m3 . Bulk density is obtained by weighing the loose needles and dividing it by the volume of the sample holder. The values for the permeabilities were chosen similar to what other authors used in their laboratory Simeoni et al. (2012); Santoni et al. (2014) and because the permeability of natural samples is around the lower numbers of this range. Natural samples have a unique permeability which cannot be controlled. An estimation of it is made based on the work of Fehrmann Fehrmann et al. (2017). It is important to mention that Fehrmann’s samples were taken from the same place as the samples of this study.. K = 0.4 + 250e−0.17ρb. (2.1). Table 2.1. Determination of the dry mass of needles md to introduce in the sample holder, where K is the desired permeability based on Fehrmann et al. (2017). K (10−7 m2 ) ρb (kg/m3 ) md (g) 5 23.5 91 3 26.9 104 1.5 31.9 124 1 35.5 138 0.5 46 178 In order to measure the RoS, the data from the camera recording and the data from the thermocouples was used. Each experiment was performed three times for each set of 32.
(46) Figure 2.2. Approximation curves for permeability of natural and constructed samples as a function of their bulk density Fehrmann et al. (2017), where APS, HPS and VPS stand for artificially reconstructed, horizontal and vertical permeability specimens, respectively. conditions (wind and permeability) in order to assure repeatability. As a consequence, a total of 75 experiments with constructed samples and 15 with natural samples were conducted. The detailed process of determination of the RoS, is described in section 2.3.5.. 2.3.2. Sampling technique 2.3.2.1. Sampling site The research presented in this manuscript builds on Fehrmann’s work on the permeability of natural and constructed litters Fehrmann et al. (2017). As a consequence, samples were collected from the same site used by Fehrmann. The site is located in the central 33.
(47) region of Chile, close to the sea shore (34°35’51.5”S, 71°52’29.6”W). This region has a temperate Mediterranean climate with a prolonged dry season. The last five years have been drier than average. Only radiata pine trees were growing on the site. The only other species present within the litter bed were fungi in the horizon between the pine needles and the soil. The forest from where the samples were taken is 25 years old and was chosen because radiata pine litters reach a stable depth once the trees are about 12 years old Forrest & Ovington (1970). The constructed samples were collected during July 2017 and the natural samples during September of the same year, corresponding to winter and early spring in the southern hemisphere, respectively.. 2.3.2.2. Constructed samples For the artificially constructed samples loose needles were collected from the leaf horizon only. Needles that were bound by fungi were not collected, nor were any other species found in the site such as the species shown in Figure 2.3. Once the samples were in the laboratory, they were oven dried in order to eliminate the moisture content from the analysis. Oven dry needles had an average diameter, thickness and length of 1.34 mm, 0.9 mm and 111 mm, respectively. The average weight was 30 mg per needle and the average density and surface to volume ratio are 380 kg/m3 and 4832 m−1 . The porosity of the dry samples ranged from 87.9 and 93.8%.. 2.3.2.3. Natural samples To collect the natural samples, the methodology proposed by Fehrmann et al. Fehrmann et al. (2017) was used. There are two basic requirements for selecting the specific sampling site: First, the site has to be at least one meter away from the trunk surface or any other species and second, it has to be at least 20 m away from the nearest road, path or forest limit. Also, the litter must not have been disturbed.. 34.
(48) Figure 2.3. Other species found when collecting litter for constructed samples which are excluded. They were, however, present in the natural samples. The sampling technique consists of four steps. First, the wooden board (Figure 2.4 a.) is placed on top of the site to sample. Secondly, with one hand on top of the wooden table and the other one holding the sharp knife (Figure 2.4 d.), the person has to cut vertically along the edges of the wooden table, at a depth of approximately 40 mm. The resulting sample is shown in Figure 2.5. Thirdly, the specially designed knife (Figure 2.4 c.) is used to cut the soil horizontally, at a depth 40 millimetres. Finally, the samples are carefully put into specially designed boxes with the same dimensions of the sample, using the tool shown in Figure 2.4 b.), and then the boxes are closed and sealed in place.. 2.3.3. Sample Preparation The loose needles were stored in bags and the natural samples in boxes and all were oven-dried during 24 hours at 80°C Valdivieso & Rivera (2014). The reason was to mimic 35.
(49) Figure 2.4. Sampling materials used for the collection of natural samples. In the image a) corresponds to the wooden board placed over the site to sample, b) is used to place the samples in boxes, c) shows a horizontal knife used to cut the soil horizontally and d) is used to cut the borders of the sample. the environmental conditions during the dry season of the country, where moisture content of the forest litter is near zero Varner et al. (2015). In order to keep natural samples undisturbed, a special rig to hold ten samples at a time during drying was designed. The moisture content was measured for every test and it varied between 1 and 7%, which is consistent with what other authors that also oven-dried their samples have stated El Houssami et al. (2016); Fuentes & Consalvi (2014); Santoni et al. (2014). Reconstructed samples were made by letting needles fall freely into the sample holder. It is important to mention that since the width of the sample holder is similar to the needle’s length, it was not possible to achieve complete randomness when placing them in such 36.
(50) Figure 2.5. Lateral and superior view of the natural sample once its edges have been cut manner. The needles tended to align to the longitudinal direction of the sample holder and the borders usually had reduced fuel load. In order to correct for that, the analysis of the RoS will consider only the area of the imaginary rectangle formed by connecting the thermocouples. The preparation of the natural samples was somewhat more complex mainly because they had to be relocated from the box into the sample holder. One of the main problems was that the thermocouples are introduced from the bottom of the sample holder. They had to be taken out, and put back once the sample was in the holder. In order to make holes in the samples for thermocouples to go through, the boxes with the samples were pressed against a table with nails that pierced the sample in the places where thermocouples will be passed through. The superior and lateral faces of the cardboard box are then removed and the remaining sample and base of the box are put into the sample holder. Lastly, the base of the box is carefully removed and the sample is pushed down into the holder. In Figure 2.6, a burnt natural sample inside the sample holder is shown.. 37.
(51) Figure 2.6. A burned natural sample inside the sample holder. 2.3.4. Experimental procedure. Before starting each test by igniting the sample, steady state conditions in terms of wind speed and air temperature were assured. The igniter was fired during 2 seconds before cutting off the gas flow. Experiments were finished after 15 minutes, or when no more flaming nor smouldering combustion was observed. Ashes, unburned fuel and soil, in the case of natural samples, were carefully discarded.. 2.3.5. Data processing Rate of spread is not an easy parameter to determine, because it requires handling many constraints and assumptions. Several ways of measuring it have been proposed in the literature. Thomas et al. J. C. Thomas et al. (2017) measured it by determining the fire arrival time to certain position, taken as the time of gas temperature exceeding 300°C. Other authors Prat-Guitart et al. (2016); El Houssami et al. (2016) use IR imagery and 38.
Figure
+7
Documento similar
Parameters of linear regression of turbulent energy fluxes (i.e. the sum of latent and sensible heat flux against available energy).. Scatter diagrams and regression lines
It is generally believed the recitation of the seven or the ten reciters of the first, second and third century of Islam are valid and the Muslims are allowed to adopt either of
In the preparation of this report, the Venice Commission has relied on the comments of its rapporteurs; its recently adopted Report on Respect for Democracy, Human Rights and the Rule
H I is the incident wave height, T z is the mean wave period, Ir is the Iribarren number or surf similarity parameter, h is the water depth at the toe of the structure, Ru is the
If the concept of the first digital divide was particularly linked to access to Internet, and the second digital divide to the operational capacity of the ICT‟s, the
In the “big picture” perspective of the recent years that we have described in Brazil, Spain, Portugal and Puerto Rico there are some similarities and important differences,
1. S., III, 52, 1-3: Examinadas estas cosas por nosotros, sería apropiado a los lugares antes citados tratar lo contado en la historia sobre las Amazonas que había antiguamente
We seek to characterize the transport in a time-dependent flow by identifying coherent structures in phase space, in particular, hyperbolic points and the associated unstable and
