Structural characterization of liquid food foams stabilized by proteins
171
0
0
Texto completo
(2) PONTIFICIA UNIVERSIDAD CATOLICA DE CHILE ESCUELA DE INGENIERIA. STRUCTURAL CHARACTERIZATION OF LIQUID FOOD FOAMS STABILIZED BY PROTEINS. JUAN CARLOS GERMAIN GUZMÁN. Members of the Committee: JOSÉ MIGUEL AGUILERA R. FRANCO PREDESCHI P. DOMINGO MERY Q. PEDRO BOUCHON A. HUGO GLORIA-HERNÁNDEZ CRISTIÁN VIAL E. Thesis submitted to the Office of Research and Graduate Studies in partial fulfillment of the requirements for the Degree of Doctor in Engineering Sciences Santiago de Chile, January, 2013.
(3) Dedicated. to. my. four. women,. Beatriz, Valeria, Paulina and Sofía, and the memory of my beloved father, Juan Armando.
(4) AKNOWLEDGMENTS Even though this thesis bears the name of just one person, achieving this work would not have been possible without the help and support of a number of people. Therefore, I would like to take this opportunity to acknowledge all those who in a way or another have been part of this journey. Due to my lousy memory, I apologize in advance to those that I might have forgotten to mention in these lines but that are present in my memories. First of all I would like to thank my parents, Beatriz and Juan, for their unconditional support and encouragement during my so many years of university studies. Thanks a lot for all the love that you have given me and the education that not without effort you have provided me. Thank you for all your sacrifices, everything I am, I owe you. Dear father, although you had to leave us along the way, I know you have been looking after and guiding me all this time from above. I would like to express my deepest acknowledgment to my advisor, Dr. José Miguel Aguilera. Thank you very much JM for your continuous guidance, your unconditional support and for your friendship. I apologize because this work took much longer than what I expected, and I thank you for never abandoning me and always being there when needed. But above all I would like to thank you for giving the opportunity to embark in this adventure that changed my life and that has opened me the doors to live experiences that otherwise I would have never lived. I would like to express my thanks to all my colleagues at Chemical Engineering Department and particularly to my friends of Dr. Aguilera’s group. Thanks Javier, Wenceslao, Olivier, Rommy, Elizabeth, Ross Mery, Cristián, Guillermo and Loreto for all those good moments spent together. I would like to give special thanks to Loreto for her support in completing this thesis. Thanks Lore for your words, encouragement and for being there whenever I needed. Thank you also Clarita for your friendship and for having the patience to withstand all of us daily. ii.
(5) I would like also to thank the students I work with during my research. Thanks María de los Angeles, Verena and Patricia for your valuable contribution to this thesis; it was a pleasure to work with you. I am very grateful also to the Nestlé Research Center for co-funding this research and allowing me to do part of my work at their facilities. My thanks to all NRC scientists who shared with me their precious knowledge. I would like to express my most sincere acknowledgments to my dearest and lovely wife Pauli. Thanks Pauli for your support, your understanding, your confidence in me, your sincere love, and for making me a happy person sharing every moment of our lives. Thank you for being my support and pillar in all those moments when things seemed too difficult to endure. Last and not least, thank you Sofia for coming to my life and fill it with a joy I could have never imagined. Your little smile makes me feel that everything is possible. Research has been funded by CONICYT’s doctoral fellowship. iii.
(6) GENERAL INDEX Page DEDICATORY ................................................................................................................. ii AKNOWLEDGMENTS ................................................................................................... ii TABLE INDEX .............................................................................................................. vii FIGURE INDEX ............................................................................................................ viii RESUMEN..................................................................................................................... xiv ABSTRACT ................................................................................................................... xvi 1.. GENERAL INTRODUCTION - MULTIPLE FOAM SCALES ............................ 1 1.1. Introduction and objectives of the thesis ......................................................... 1 1.2. Molecular and liquid film levels ..................................................................... 5 1.2.1. Proteins as surface active compounds .................................................. 5 1.2.2. Film forming ability of proteins at gas/liquid interfaces ...................... 7 1.3. Foam architectures ........................................................................................ 15 1.3.1. Equilibrium rules for films and bubbles ............................................. 15 1.3.2. Evaluation of foams ............................................................................ 17 1.3.3. Image analysis of foams ..................................................................... 19 1.4. Foam rheology .............................................................................................. 28 1.4.1. Elastic behaviour ................................................................................ 29 1.4.2. Viscoelastic behaviour ........................................................................ 30 1.4.3. Yielding behaviour ............................................................................. 31 1.4.4. Non-Newtonian flow behaviour ......................................................... 32 1.5. Outline of the thesis ...................................................................................... 33 1.6. References ..................................................................................................... 34. 2.. CHANGES IN SODIUM CASEINATE INTERFACIAL AND FOAMING PROPERTIES BY CONJUGATION ................................................ 48 2.1. Introduction ................................................................................................... 48 2.2. Materials and Methods .................................................................................. 50 2.2.1. Samples and preparation ..................................................................... 50.
(7) 2.2.2. Interfacial Measurements .................................................................... 50 2.2.3. Foaming Experiments ......................................................................... 51 2.2.4. Diminishing Bubble Method .............................................................. 52 2.3. Results and Discussion .................................................................................. 53 2.3.1. Surface tension with Wilhelmy Plate ................................................. 53 2.3.2. Foaming Behaviour ............................................................................ 55 2.3.3. Results of drop/bubble shape analysis ................................................ 61 2.3.4. Diminishing Bubble experiments ....................................................... 66 2.4. Conclusions ................................................................................................... 70 2.5. References ..................................................................................................... 71 3.. DESCRIBING BUBBLE SPATIAL DISTRIBUTIONS ON FOAM STRUCTURES ...................................................................................................... 76 3.1. Introduction ................................................................................................... 76 3.2. Materials and Methods .................................................................................. 78 3.2.1. Samples and solution preparation ....................................................... 78 3.2.2. Experimental sep-up for foam formation ........................................... 79 3.2.3. Image acquisition, processing and analysis ........................................ 80 3.2.4. Bubble size determination .................................................................. 81 3.2.5. Determination of spatial distributions by Minkowski analysis .......... 82 3.3. Results and Discussion .................................................................................. 86 3.3.1. Physical interpretation of Euler characteristic values ......................... 86 3.3.2. Size and spatial measurements on model bubble structures ............... 88 3.3.3. Size and spatial measurements on real foams ..................................... 89 3.4. Conclusions ................................................................................................... 93 3.5. References ..................................................................................................... 94. 4.. IDENTIFYING INDUSTRIAL FOOD FOAM STRUCTURES BY 2D SURFACE IMAGE ANALYSIS AND PATTERN RECOGNITION ................. 99 4.1. Introduction ................................................................................................... 99 4.2. Materials and Methods ................................................................................ 102 4.2.1. Foam sample preparation and structure imaging .............................. 102 4.2.2. Structural parameters determination ................................................. 103 4.2.3. Foam structure identification according to structural parameters ......................................................................................... 109.
(8) 4.3. Results and Discussion ................................................................................ 110 4.3.1. Foam structure images ...................................................................... 110 4.3.2. Structural parameters selected by canonical discriminant analysis ............................................................................................. 112 4.3.3. Foam structures indentified by Bayesian discriminant analysis ............................................................................................. 114 4.4. Conclusions ................................................................................................. 123 4.5. References ................................................................................................... 123 5.. GENERAL CONCLUSIONS AND FUTURE PROSPECTS ............................ 129. 6.. REFERENCES .................................................................................................... 130. 7.. NOMENCLATURE ............................................................................................ 148.
(9) TABLE INDEX Page Table 3.1: Results of the image analysis of idealized foam structures ........................... 89 Table 4.1: Percentage of foam structure images correctly classified using the canonical discriminant analysis with sequential forward selection for each concentration/pH combination and when considering all samples simultaneously. Calculations done for feature groups including parameters from Euler characteristic and Minkowski fractal analyses together with textural features calculated from intensity images of different sizes. ...................................................................................................... 113 Table 4.2: Selected structural parameters determined by canonical discriminant analysis with sequential forward selection for each concentration/pH combination and when considering all samples simultaneously. Parameters correspond to those giving highest percentage of foam structure images correctly classified indicated in Table 4.1. ............................... 114 Table 4.3: Percentage of foam structure images correctly classified using structural parameters indicated in Table 4.2 and determined by non-linear Bayesian discriminant analysis for each concentration/pH combination and when considering all samples simultaneously. ............................................. 115. vii.
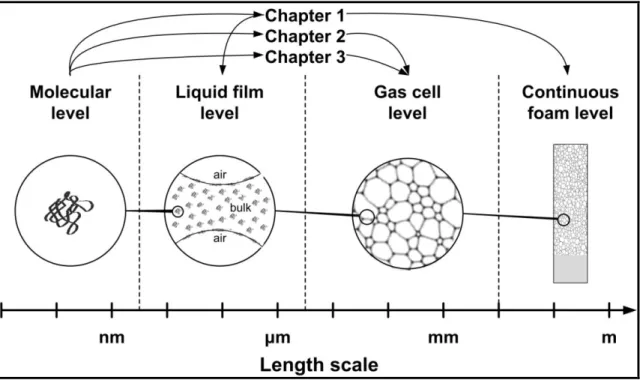
(10) FIGURE INDEX Page Figure 1.1: Graphical representation of 4 levels in foams analysis. Molecular, liquid film, gas cell, and continuous foam size levels are all characterized by specific lengths. Study of protein stabilized foams focuses at each particular level and addresses aspects relevant at the different length scales. Their relation to the different chapters in this thesis is also depicted. ................................................................................................................... 4 Figure 1.2: Schematic description of the protein adsorption process at gas/liquid interfaces. Native folded proteins diffuse towards the interface where they are adsorbed and undergo denaturation and networking with other proteins through molecular interactions. ........................................................ 8 Figure 1.3: Schematic representation of gas diffusion process from a small bubble into the outer medium due to Laplace pressure in the diminishing bubble approach. Film formed at the top of the bubble is a bilayer as those formed in foams. .......................................................................................... 13 Figure 1.4: Foam structure description. (A) In dry foams bubbles adopt polyhedral forms where Plateau borders can intersect only 3 at a time and at angles of 120º. (B) In wet foams liquid is contained in Plateau borders where they join an adjacent film. Surface normal is the same on both sides of the intersections. ....................................................................................... 16 Figure 1.5: (A) Processed grey-level and thresholded images of fresh protein foams. (B) Cumulative bubble sized distributions for the foams in A determined by image analysis. (C) Classification of foams images through texture and discriminant analysis. ............................................................ 20 Figure 1.6: (A) Idealized foam structures describing totally different spatial arrangements. Structures are built with discs of two sizes but in one case are randomly distributed, segregated, or clustered. (B) Plots of nearestneighbour distribution function (G-function) and linearized reduced second-moment distribution function (L-function) for simulated images like those shown in A, together with the complete spatial random model viii.
(11) plots. Each curve corresponds to the average of three simulated images considering either a random, segregated or clustered spatial distribution. ............ 26 Figure 1.7: Schematic diagram of liquid foams stress-strain response adapted from Weaire et al. (1994). Foams behave as elastic solids at low stressstrain values, whereas, over a certain yield stress bubbles begin to come apart as foams flow like viscous non-Newtonian fluids. ....................................... 29 Figure 2.1.: Experimental set up for the Diminishing Bubble method. Observation cell is showed from above (A), and from the side (B). ..................... 53 Figure 2.2: Surface tension versus concentrations curves for thermally treated sodium caseinate and conjugate samples at pH 7.0. Additional data are shown to illustrate that the surface tension of sodium caseinate was unaffected by the thermal treatment or pH change. ............................................... 54 Figure 2.3: Surface tension values plotted against the logarithm of the concentration for sodium caseinate and conjugate. In both cases, curves correspond to replica 3 in Figure 2.2. .................................................................... 55 Figure 2.4: Foamscan results for sodium caseinate samples sparged at 30 or 80 mL/min. Curves represent the amount of liquid contained in the foam during formation and drainage. Images describe foam appearances after 30 minutes.............................................................................................................. 56 Figure 2.5: Foamscan results for conjugate samples prepared at high concentration and sparged at 30 or 80 mL/min. Curves represent the amount of liquid contained in the foam during formation and drainage. Images describe foam appearances after 30 minutes. ............................................ 58 Figure 2.6: Foamscan results for conjugate samples prepared at low concentration, pH 5.5 and sparged at 30 or 80 mL/min. Curves represent the amount of liquid contained in the foam during formation and drainage. Images describe foam appearances after 30 minutes. ........................... 59 Figure 2.7: Foamscan results for mixtures at pH 5.5 containing increasing concentrations of conjugate at a constant sodium caseinate concentration (1.0 mg/mL or 4.0 mg/mL) and sparged at 30 or 80 mL/min. Curves ix.
(12) represent the amount of liquid contained in the foam during formation and drainage. Images describe foam appearances after 30 minutes. ..................... 60 Figure 2.8: Foamscan results for conjugate/sodium caseinate mixtures (0.80 mg/mL total protein concentration) at pH 5.5 and sparged at 30 or 80 mL/min. Percentages represent conjugate mass fraction in the mixture. Curves represent the amount of liquid contained in the foam during formation and drainage. Images describe foam appearances after 30 minutes................................................................................................................... 61 Figure 2.9: Surface tension versus time curves measured using automatic drop/bubble shape analysis for sodium caseinate, conjugate, and mixture solutions prepared at different concentrations and pH conditions......................... 63 Figure 2.10: Apparent adsorption rates derived from the data in Figure 2.9 as the slope of the surface tension versus time curves. .............................................. 65 Figure 2.11: Surface dilational modulus and phase angles measured at different concentrations and pH conditions for sodium caseinate and conjugate interfaces. ............................................................................................................... 67 Figure 2.12: Shrinking rate versus bubble radius curves derived from the experimental data for selected samples. ................................................................ 69 Figure 3.1: Simulated model foam structures with identical size distributions but different spatial arrangements. The three simulated structures share equal dimensions and number of small and large bubbles, but in (A) bubbles are randomly distributed, in (B) small bubbles are clustered at the center, and in (C) small bubbles are segregated at the top. ............................. 78 Figure 3.2: Scheme of the experimental apparatus used for the controlled formation and structural analysis of foams. ........................................................... 80 Figure 3.3: Original grey level images recorded during foaming experiments and processing and binarization results. Frames showed correspond to those immediately after sparging was stopped. Conditions in all cases are 0.1 wt% protein and pH 5.5. .................................................................................. 82. x.
(13) Figure 3.4: Decomposition of the black and white pattern representing a disk into squares, edges and vertices. For this example: number of squares ns = 13, number of edges ne = 36, and number of vertices nv = 24. ........................... 84 Figure 3.5: Typical plot of the Euler characteristics versus increasing disk radius resulting from the analysis of the simulated random foam structure shown in Figure 3.1A. Arrows indicate the four representative curve values. Figures along the plot exemplify graphically the disk growing process from the bubble centroids spatial distribution. ......................................... 85 Figure 3.6: Physical interpretation of the Euler characteristic values. Diagrams compare situation where only one Euler characteristic value is modified, while the other three remain equal......................................................................... 87 Figure 3.7: Gallery showing examples of resulting segmented binary images of foam structures. Pictures are grouped according to concentration and pH values of solutions used to prepare foams. Numbers under each image indicates the time in minutes at which the picture was taken, measured immediately after sparging was stopped................................................................ 90 Figure 3.8: Results of size and spatial distribution measurements on real foam structures. Values of Euler characteristic parameters are plotted against corresponding mean equivalent diameters............................................................. 92 Figure 4.1: Comparison between original grey level images recorded during foaming experiments with their corresponding processed and binarized results. Images represent samples prepared with (A) 0.4 wt% whey protein isolate at pH 5.5 and (B) 0.1 wt% sodium caseinate at pH 7.0. .............. 104 Figure 4.2: (A) Demonstration of iterative erosion and dilation image processing to determine Minkowski fractal dimensions. Boundary images are built from the segmented binary image shown in Figure 4.1A. (B) Double logarithmic plot of effective width versus number of dilating/eroding cycles resulting from processing shown in A. The linear regressions are adjusted to the data to determine Minkowski fractal parameters. ........................................................................................................... 107. xi.
(14) Figure 4.3: Intensity images made from the segmented binary image shown in Figure 4.1A. Each intensity image was obtained by dividing the original image into 22xn (n=1...7) square sections and replacing the value in each one with its corresponding average grey level. ................................................... 108 Figure 4.4: Pictures showing the resulting foam structure segmented binary images obtained from sparing experiments of protein/conjugate aqueous solutions at four concentration/pH combinations. The individual images shown are representative of image sets describing each experimental condition. Values indicate mean bubble sizes and standard errors for each sample class. ........................................................................................................ 111 Figure 4.5: Three dimensional plot of non-linear functions determined by Bayesian discriminant analysis used to classify structure images of foams formed by sparging 0.1 wt% protein/conjugate aqueous solutions at pH 5.5. Data points and discriminant functions are projected onto x-y, x-z and y-z axis to visualize the ability of selected structural parameters to separate different foam sample classes. ............................................................... 117 Figure 4.6: Three dimensional plot of non-linear functions determined by Bayesian discriminant analysis used to classify structure images of foams formed by sparging 0.1 wt% protein/conjugate aqueous solutions at pH 7.0. Data points and discriminant functions are projected onto x-y, x-z and y-z axis to visualize the ability of selected structural parameters to separate different foam sample classes. ............................................................... 118 Figure 4.7: Three dimensional plot of non-linear functions determined by Bayesian discriminant analysis used to classify structure images of foams formed by sparging 0.4 wt% protein aqueous solutions at pH 5.5. Data points and discriminant functions are projected onto x-y, x-z and y-z axis to visualize the ability of selected structural parameters to separate different foam sample classes. ............................................................................. 120 Figure 4.8: Three dimensional plot of non-linear functions determined by Bayesian discriminant analysis used to classify structure images of foams formed by sparging 0.4 wt% protein aqueous solutions at pH 7.0. Data points and discriminant functions are projected onto x-y, x-z and y-z axis xii.
(15) to visualize the ability of selected structural parameters to separate different foam sample classes. ............................................................................. 121 Figure 4.9: Three dimensional plot of non-linear functions determined by Bayesian discriminant analysis used to classify structure images of foams formed by sparging protein/conjugate aqueous solutions at 4 concentration/pH combinations. Data points and discriminant functions are projected onto x-y, x-z and y-z axis to visualize the ability of selected structural parameters to separate different foam sample classes. ........................ 122. xiii.
(16) PONTIFICIA UNIVERSIDAD CATOLICA DE CHILE ESCUELA DE INGENIERIA. CARACTERIZACIÓN DE LA ESTRUCTURA DE LAS ESPUMAS LÍQUIDAS ESTABILIZADAS POR PROTEÍNAS Tesis enviada a la Dirección de Investigación y Postgrado en cumplimiento parcial de los requisitos para el grado de Doctor en Ciencias de la Ingeniería. JUAN CARLOS GERMAIN GUZMÁN RESUMEN El trabajo desarrollado en esta tesis se ha enfocado en un elemento reconocido hoy como un ingrediente esencial en innumerables alimentos: burbujas. Las burbujas son elementos estructurales fundamentales en varios productos, y durante los últimos años hemos sido testigos de un creciente interés académico e industrial para estudiar burbujas y su influencia en alimentos. Las espumas son sistemas muy complejos que entremezclan una amplia gama de escalas, que van desde el molecular hasta el nivel macroscópico, pasando por las películas líquidas y las burbujas mismas. Es por tanto necesario desarrollar conocimientos y herramientas que puedan ayudar a entenderlas para controlas y utilizarlas para nuestro beneficio. El objetivo general de esta tesis fue estudiar los atributos de espumas estabilizada por proteínas a diferentes escalas y proporcionar una visión más amplia de estos sumamente complejos sistemas. Los distintos capítulos de este documento describen los esfuerzos realizados en este sentido. Un primer estudio sobre los cambios en las propiedades interfaciales y espumantes inducidos de caseinato de sodio al ser modificado químicamente mediante conjugación con polisacáridos, demostró que este proceso mejoró la funcionalidad de la proteína. La mejora en las propiedades espumantes fue explicada parcialmente por los mayores módulos dilatacionales superficiales mostrados por las burbujas estabilizadas por la molécula conjugada en comparación con aquellas formadas a partir de la proteína nativa. Un segundo análisis de la estructura de espumas basado en la llamada característica de Euler mostró la importancia de incorporar información sobre disposiciones espaciales de xiv.
(17) burbujas para describir las “arquitecturas” de espumas. Se demostró que información esencial (complementaria a los tamaños de burbuja) se obtiene a través de mediciones espaciales. Un análisis final de estructura de espumas basado en múltiples técnicas de análisis de imagen indicó que grupos de tres parámetros estructurales (entre los 57 calculados) podían identificar correctamente estructuras de espumas con características diferentes, pero lamentablemente ningún único conjunto de características pudo utilizarse ubicuamente. Los métodos y análisis realizados en esta tesis pueden ayudar en la camino de dilucidar la compleja naturaleza de las espumas. Un mayor y más profundo conocimiento es necesario para poder diseñar mejores productos, a medida que las burbujas ganan importancia como una forma directa de influir en la textura de los alimentos. Miembros de la Comisión de Tesis Doctoral José Miguel Aguilera R. Franco Predeschi P. Domingo Mery Q. Pedro Bouchon A. Hugo Gloria-Hernández Cristián Vial E. Santiago, Enero, 2013. xv.
(18) PONTIFICIA UNIVERSIDAD CATOLICA DE CHILE ESCUELA DE INGENIERIA. STRUCTURAL CHARACTERIZATION OF LIQUID FOOD FOAMS STABILIZED BY PROTEINS Thesis submitted to the Office of Research and Graduate Studies in partial fulfillment of the requirements for the Degree of Doctor in Engineering Sciences by JUAN C. GERMAIN ABSTRACT The work developed in this thesis is committed to an element acknowledged nowadays as an essential ingredient in countless foods: bubbles. Bubbles are fundamental structural elements in several products, and during the last years it have been witnessed an increasing academic and industrial interest to study bubbles and their influence food foams and aerated foods. Foams are highly complex systems that intermingle a wide range of scales, going from the molecular to the macroscopic level, passing through the liquid film and bubble cell levels. It is therefore necessary to develop knowledge and tools that can help understand them to control and use them for our benefit. The general objective of this thesis was to study the attributes of proteinstabilized foams at different scales and to provide a more comprehensive view of these immensely complex systems. The different chapters of this document describe the efforts done in this sense. A first study of the changes induced on the interfacial and foaming properties sodium caseinate when chemically modified by conjugation with polysaccharides, demonstrated that this process improved protein functionality. The better foaming properties were partially explained by the larger surface dilational modules showed by the bubbles stabilized by the conjugated molecule compared to those formed by the native protein. A second analysis of foam structures based on socalled Euler characteristic showed the importance of incorporating information on spatial arrangements of bubbles to describe foam “architectures”. It was demonstrated that essential information (complementary to bubble sizes) is obtained through spatial xvi.
(19) measurements. A final analysis of foam structures based on multiple image analysis techniques indicated that groups of three structural parameters (among the 57 calculated) could successfully identify foam structures with different characteristics, but no single set of features could be used ubiquitously. The methods and analyses done in thesis can help on the route of elucidating the complex nature of foams. More and deeper knowledge is required to be able to design better products as bubbles gain importance as a way to influence food product textures. Members of the Doctoral Thesis Committee: José Miguel Aguilera R. Franco Predeschi P. Domingo Mery Q. Pedro Bouchon A. Hugo Gloria-Hernández Cristián Vial E. Santiago, January, 2013. xvii.
(20) 1.. GENERAL INTRODUCTION - MULTIPLE FOAM SCALES. 1.1.. Introduction and objectives of the thesis Labels in supermarket products include lists with innumerable ingredients. used in their manufacture. This encompasses simple compounds as sugar, flour and oils to more elaborated (many times synthetic) emulsifiers and preservatives. In those lists however it is not possible to find an element acknowledged nowadays as an essential ingredient in countless food products: bubbles. Plenty food products containing different but significant levels of a gas fraction can be found and few examples are soufflés, whipped cream, mousses, beer, ice cream, popcorn, bread, cakes, biscuits, waffles, pancakes, aerated chocolate bars, meringues, marshmallow, carbonated soft drinks, cornflakes, milkshakes, etc. Key point is that most of them will not exist if it was not for the bubbles present in their structures. Increasing academic and industrial interest to study food foams and aerated food product comes from the attributes provided by bubbles. Campbell and Mougeot (1999) had listed that some properties bubbles impart are density reductions, rheology and texture changes, appearance and mouthfeel modifications, surface area increments, digestibility and shelf-life alterations due to increased porosity, and flavour intensity modulations. But above all, renewed interest relies on that we use and eat bubbles in our foods ubiquitously and companies recognize that consumer’s preference is driven by the unique characteristics of foamed products. During the last decade it has become clearer to food scientists that structure is critical for understanding food behaviour (Aguilera, 2005). This applies in particular to food foams. Bubbles give novel textures and attractive structures to food products and although simple techniques are routinely used to analyze foams and aerated food products it is necessary to obtain specific and quantitative data on their structure. Efforts are focused to linking structural information to physical properties of foods, and there is a need for quantitative methods that can characterize cellular structures and help. 1.
(21) establishing relationships between structure and properties (Lim and Barigou, 2004). More fundament understanding of food foam systems is required to fill this gap. Liquid foams are colloidal systems in which large numbers of air bubbles (or more generally speaking gas bubbles) are surrounded by an aqueous continuous phase. They. are. essentially. lyophobic. colloidal. dispersions. (continuous. phase. is. thermodynamically driven not to wet the dispersed phase) characterized by the presence of an interfacial (or surface) tension (γ) produced between the 2 phases (Damodaran, 2005). Interfacial tension is the energy supplied to form a unit of interfacial area (A) (de Gennes et al., 2004). Dispersing gas bubbles into a liquid significantly increases A inducing changes in the surface free energy (Gsurf) of the system (Walstra and Smulders, 1997): Gsurf A A. (1.1). As all systems should attain their minimum free energy state at equilibrium, thermodynamics dictates that foams will separate into 2 phases after they are formed to minimize A and therefore Gsurf. Formation and persistence of stable liquid foams is consequence of surface active agents (surfactants), molecules with amphiphilic properties that locate at interfaces forming layers separating both phases (Weaire and Hutzler, 1999). Amphiphilic molecules can accommodate at interfaces because their molecular structure is composed by hydrophilic and hydrophobic regions. The term surfactant is applied to molecules of diverse nature. It can refer to simple small molecules formed by a polar head joined to an aliphatic chain (like a low molecular weight molecule such as a phospholipid) or to more complex and larger synthetic or biological macromolecules such as proteins. Many food foams owe their existence to presence of proteins (Russo, 2000; Damodaran, 2005). These macromolecules play a major role in food foam stabilization because their amphiphilic nature allows them to accommodate at bubble interfaces. Bubble interfaces are stabilized against rupture by rheological properties proteins confer 2.
(22) to the thin film layers (Lucassen-Reynders, 1993). Proteins form viscoelastic networks sometimes referred to as a two-dimensional gel that stabilize interfacial layers kinetically (Golding and Sein, 2004; Gunning et al., 2004; Carrera Sánchez et al., 2005). Scheme in Figure 1.1 shows that study of protein-stabilized foams can be done at different levels, each one characterized by length scales relevant to structural elements and phenomena involved. The lowest and probably most relevant is the molecular level. Molecular properties of proteins influence all higher scales and give the unique interfacial and foaming-inducing characteristics to these macromolecules. The following level corresponds to gas/liquid interfaces and liquid films separating bubbles. Protein adsorption processes and protein interfacial properties are of particular interest at this level. The third level corresponds to the actual foam structure and at this scale focus is mainly on bubble sizes, shapes and spatial organizations. Interest is on foam architectures which affect appearance and quality of foamed products. A higher level is finally to consider foams as a macroscopic material. At this level products physics, described mainly by mechanical and rheological properties, is the most relevant aspect. The purpose of this work has been to provide a more comprehensive view on the study of foams that can help better understand these immensely complex systems. The fundamental hypothesis of this thesis is that the use of different foaming agents (proteins in the specific case of this work) and foaming conditions will produce foams with different characteristics in terms of their physical properties and structure. Therefore, the overall objective was to study the attributes of protein-stabilized foams at the different levels described in Figure 1.1 and try to understand the possible relations between them. In order to achieve this target, specific objectives were established throughout the individual works developed in this thesis: . Evaluate and compare the changes induced on the interfacial and foaming properties sodium caseinate when chemically modified by conjugation with polysaccharides (Chapter 2).. 3.
(23) . Develop a method to quantify bubble spatial distributions on foams structures and show importance of this structural parameter that provides complementary information to bubble size distributions (Chapter 3).. . Identify quantitative parameters that can be used to further describe/differentiate the structural properties of foamed systems (Chapter 4). Figure 1.1: Graphical representation of 4 levels in foams analysis. Molecular, liquid film, gas cell, and continuous foam size levels are all characterized by specific lengths. Study of protein stabilized foams focuses at each particular level and addresses aspects relevant at the different length scales. Their relation to the different chapters in this thesis is also depicted.. What follows in this introduction chapter is a general description of the different scales depicted in Figure 1.1. Relevant literature dealing with foam investigations at each level is cited and linked with the results of this thesis.. 4.
(24) 1.2.. Molecular and liquid film levels. 1.2.1.. Proteins as surface active compounds The lowest length-scale in the scheme presented in Figure 1.1 is the protein. molecular size level. Proteins are a large collection of macromolecules widely present in nature affecting functions of virtually all living organisms (Creighton, 1993). Presence of proteins ranges from their active role in cells and plasma, forming part of cell membranes, antibodies, enzymes, hormones, etc., to their structural functions in hair, nails, tendons, muscles, etc. Nonetheless, they are a relatively homogenous group despite their diverse functionalities. All proteins are linear polymers built by combinations of 20 amino acids. Amino acids are grouped into 3 families, those with strictly hydrophobic side chains, those charged, and those with polar side chains (Branden and Tooze, 1991). Differences in the chemical nature of amino acids give proteins their singular amphiphilic nature and surface activity. But not all proteins types display surface activity. To act as surfactants, proteins should be able to diffuse and adsorb at interfaces, unfold and form cohesive films via molecular interactions (Damodaran, 2005). Proteins interface stabilization is far more complex than for small surfactant molecules and therefore not as well understood. In contrast to small surfactant molecules such as monoglycerides and phospholipids with identifiable hydrophilic heads and hydrophobic tails, proteins have randomly distributed hydrophobic and hydrophilic groups. Even more, in folded tertiary structures only a small fraction of hydrophobic residues are exposed to the gas phase leaving most of the protein molecule immersed (at least initially) into the aqueous phase (Damodaran, 2005). Large three-dimensional structures of proteins must therefore reconfigure when faced to interfaces to increasingly expose hidden hydrophobic regions. Ability to undergo rapid conformation changes when transferred from one environment to another (molecular flexibility) is consequently a critical property of surface active proteins (Razumovsky and Damodaran, 1999). Timescales and extent of protein conformational changes strongly depends on inter- and intramolecular forces (Prins et al., 1998). Cleavage of intermolecular disulfide 5.
(25) bonds (Yu and Damodaran, 1991) and partial heat denaturation (Zhu and Damodaran, 1994) generally improves protein surface activity because of enhanced molecular flexibility. Proteins foaming capacities are also positively correlated with average molecule hydrophobicity (Kato et al., 1983). Average hydrophobicity is the average free energy change as a consequence of transferring amino acid side chains from non-polar solvents to water. Surface hydrophobic patches facilitate initial protein interfacial anchoring driven by lowering the surface free energy of the system. Surface and foaming properties of proteins are modified by different methods that involve physical, chemical, enzymatic or genetic processes. Physical modifications involve partial denaturation or unfolding by controlled heat (Bals and Kulozik, 2003) or shearing (Onwulata et al., 2003). Chemical modifications alter secondary, tertiary, and quaternary structures and affect hydrophobic-hydrophilic balance. It has been speculated that protein chemical modification via conjugation with polysaccharides improves surface properties, especially at low pH as iso-electric point and solubility are altered and molecular integrity maintained (Morris et al., 2004). Enzymatic modification of proteins is mainly carried out by hydrolysis and polymerization reactions. For example, controlled protein polymerization using transglutaminase has shown to affect functional properties (Liu and Damodaran, 1999). Genetic modification is successfully employed nowadays to improve protein thermostability, alter temperature and pH optima, and change substrate specificity of enzymes. However, there are limited examples on specifically improving their functional properties (Utsumi et al., 2002; Adachi et al., 2004). This particular level of foam length scales is treated in Chapter 2. Surface active and foaming properties of a modified protein were evaluated in comparison to the native protein. Protein modification was done by a chemical reaction to produce a conjugate with maltodextrin. Alteration of protein molecular characteristics had a remarkable effect on functional properties.. 6.
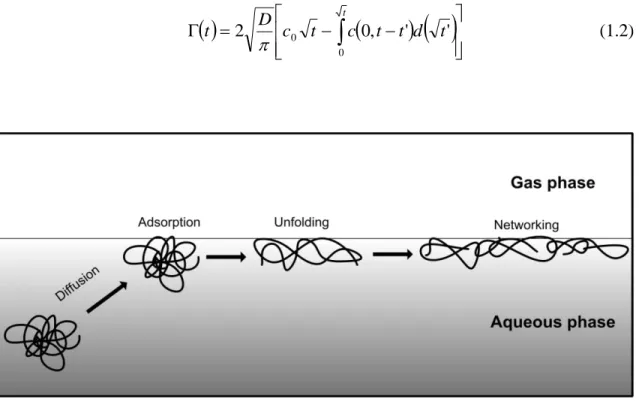
(26) 1.2.2.. Film forming ability of proteins at gas/liquid interfaces Bubble gas/liquid interfaces and thin lamellas separating them defines a. second scale level in the scheme proposed in Figure 1.1. Relevant information at this stage is protein absorption kinetics and equilibrium conditions, interfacial rheological properties, and bubble film permeability characteristics. Quantifying protein adsorption The process of protein adsorption at gas/liquid interfaces has been described as involving a number of steps (Maldonado-Valderrama et al., 2005; de Jongh, 2007). These steps are shown schematically in Figure 1.2. Proteins diffuse from the bulk of the continuous phase to the interface, phenomena controlled by molecular size and viscosity. Once close to interfaces proteins adsorb. Net protein adsorption (adsorption minus desorption) is controlled by kinetic energy barriers determining the ratio between sticking and bouncing molecules. Adsorbed proteins then undergo conformational changes to expose their hidden hydrophobic groups to the gas phase. Unfolding kinetics are controlled by activation energy required to disrupt protein intramolecular interactions. Finally, proteins aggregate within the interfacial layer forming a network, step controlled by chemical reactivity and physical-chemical activity of side chains. Quantification of equilibrium conditions during interfacial protein adsorption together with adsorption dynamics are both subjects of practical importance on foam stability. Several studies have been done to develop theoretical models to accurately describe this process. Protein adsorption shows a sharp increase in surface pressure (Π=γ0-γ, where γ0 is the surface tension of the pure solvent) with concentration until a certain protein adsorption threshold. Over this threshold Π remains almost constant while adsorption layer thickness still increases significantly (Miller et al., 2004a). Additionally, proteins unfold due to surface denaturation, thus individual protein molecules have variable surface coverage.. 7.
(27) Various thermodynamic models describing equilibrium conditions during polymer adsorption have been used to describe protein adsorption (Douillard et al., 2003). Fainerman et al. (2003) proposed a theoretical model taking into consideration the particular protein characteristics. This model has proved successful in describing measured protein adsorption and surface pressure isotherms. It corresponds to an extension of previous works (Joos and Serrien, 1991) assuming that protein molecules can adopt multiple states with different molar areas. Fainerman’s thermodynamic equilibrium model set the basis for determining protein adsorption kinetics. Miller et al. (2004) developed a dynamic interfacial protein adsorption description based on the Ward and Tordai (1946) equation providing a relationship between dynamic adsorption and subsurface protein concentration c(0,t) for fresh and non-deformed surfaces: t D t 2 c0 t c0, t t 'd t ' 0. . (1.2). Figure 1.2: Schematic description of the protein adsorption process at gas/liquid interfaces. Native folded proteins diffuse towards the interface where they are adsorbed and undergo denaturation and networking with other proteins through molecular interactions.. 8.
(28) Experimentally, measuring protein absorption kinetics is a difficult technical problem commonly accomplished using radiotracer techniques (Xu and Damodaran, 1993) and ellipsometry (Grigoriev et al., 2002). However, dynamic surface tension experiments are technically much simpler to perform and models described above can be employed to represent experimental measurements and unveil adsorption mechanisms (Miller et al., 2004; Maldonado-Valderrama et al., 2005). Various tensiometry techniques are available to determine dynamic surface tensions (Miller et al., 2000). Among them, pendant drop tensiometry has proved a standard and reliable method for elucidating adsorption kinetics (Möbius and Miller, 1998). Pendant drop tensiometry is a non-invasive technique for measuring γ as a function of time based on force mechanical equilibrium on drops or bubbles. At mechanical equilibrium curvature is adjusted to balance pressure difference between the two phases by capillary pressures. Force equilibrium leads to the fundamental Laplace equation (not to be confused with Laplace’s Law; Eq. 1.8) describing mathematically the drop (or bubble) interface profile (Eq. 1.3). Physics literature described years ago the theoretical basis of surface tension evaluation using this equation (Andreas et al., 1938; Stauffer, 1965).. 1 d x sin 2 cz x dx b. (1.3). Major drawback of this approach was the cumbersome and lengthy processing time, but nowadays increasing computational capacities and emergence of digital video cameras allows fast real time measurements (Cagna et al., 1992; Labourdenne et al., 1996). Coupled with appropriate software tools this method helps interpreting experimental data in relation to thermodynamics and kinetics models (Aksenenko, 2001). In Chapter 2 pendant drop tensiometry was used to measure adsorption kinetics of sodium caseinate and its conjugate. Using a simplified semi-quantitave approach, apparent adsorption rates were derived from dynamic surface tension data.. 9.
(29) Quantifying film rheology Foam stability cannot be explained solely by interfacial tension reduction provoked by protein adsorption but also by rheological properties these molecules confer to interfaces. Protein-covered interfaces behave as two-dimensional entities with elasticity and viscosity. Protein presence leads to interfacial tension gradients enabling interfaces to resist tangential stresses providing them with mechanisms for dynamic stabilization (Lucassen-Reyders, 1993). Interfacial rheology analysis is achieved by compression deformation or shearing motion of surfaces. Surface shear viscosities contribute to long term foams stability. For short term stability interfacial rheology in compression and expansion is more relevant. Interfaces undergo compression and expansion rather than shearing during foaming. High shear viscosities found for interfaces cannot build up in the time scales (<1s) associated with formation of new interfaces (Benjamins and LucassenReynders, 1998). Interface rheological characteristics during compression and expansion are described by the surface dilatational modulus (ε) estimated from the expression originally proposed by Gibbs (Logley and Van Name, 1928):. . d d ln A. (1.4). Interfacial viscoelastic properties during compression and expansion are extensively investigated by dynamic drop tensiometry (Benjamins et al., 1996) based on the instrument originally developed by Cagna et al. (1992). The modified equipment version allows varying drop/bubble area sinusoidally and changes in γ and A are recorded simultaneously through image analysis to determine ε. When films are purely elastic plotting dγ against dlnA produces a straight line. However, deviations occur when relaxation processes in or near the interface affect γ within measuring times. Modulus ε becomes a surface viscoelasticity with elastic (εˈ) and viscous (εˈˈ) components accounting for energy stored and loss per cycle, respectively. Plotting dγ against dlnA in these cases gives an ellipse (Lucassen and van den Tempel, 1972). Experimentally, 10.
(30) imaginary contribution is represented by a phase angle ( ) between stress and strain responses.. ' cos . (1.5). ' ' sin . (1.6). Interfacial rheological properties of surfactants and proteins have been extensively reviewed by Bos and van Vliet (2001). Under the framework of the thermodynamic equilibrium protein adsorption model mentioned before (Fainerman et al., 2003), dependence of limiting Gibbs’ elasticity (ε0) for protein monolayers (defined as ε measured at frequencies where no relaxation processes affect γ in area oscillations time scales) on Г has been proposed (Lucassen-Reynders et al. 2004). Experimental values of ε0 have been described satisfactorily by Eq. 1.7 and the thermodynamic model.. 0 . RT. 0. 1 2a 1 1 . . (1.7). It has been shown that for low viscosity systems such as liquid foams, interfacial rheological properties of protein films have important effects on Ostwald ripening. As protein films build during adoption, increments on ε reduce disproportionation rates (Damodaran, 2005). Theoretical work done by Kloek et al. (2001) has evidenced that presence of viscoelastic interfaces with relevant viscosities larger than a critical value or either completely elastic interfaces can retard or even stop bubble shrinkage. Adapting Kloek’s theory, Dickinson et al. (2002) tested bubble stabilization mechanisms of proteins and concluded that surface rheology cannot completely stabilize bubble, but introducing modest dilatational elastic contributions into the model gave good agreement between experimental measurements and predictions.. 11.
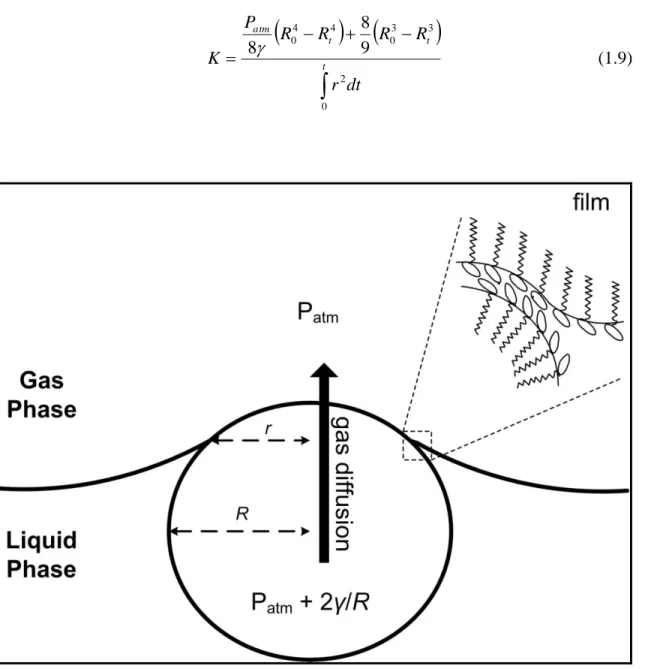
(31) Due to the importance of surface viscoelastic properties on foam stability, Chapter 2 shows measurement and comparison of viscoelastic modules obtained from bubble surfaces stabilized by sodium caseinate and its conjugate. It was shown that conjugation increased surface viscoelasticity, particularly the elastic component, partially explaining the enhanced foaming behaviour of conjugates. Quantifying film permeability Ostwald ripening (referred also as disproportionation) occurs because bubble walls are permeable to gas diffusion. Process origin is explained by Laplace’s law (Eq. 1.8) which expresses the pressure difference balance (ΔP) across gas/liquid interfaces. For spherical bubbles of radius (R) it becomes:. P . 2 R. (1.8). This expression indicates that small bubbles have internal pressures higher than larger ones. Pressure differences between neighbouring bubbles results in concentration gradients that drives diffusion. Gas diffusion processes through entire foams is a problem of great practical importance but difficult to describe and analyze in real systems due to the complexity of the structure. However, Ostwald ripening of single bubbles can be studied employing the Diminishing Bubble (DB) method proposed by Platikanov et al. (1980). DB method consists in forming one small gas bubble at the surface of the surfactant solution. Approach partially imitates the situation of bubbles in foams. The film formed between the bubble and the solution surface is analogous to that formed between two bubbles (Figure 1.3). Outside medium acts as an infinitively big bubble contacted directly with the small bubble. Pressure gradient drives gas out of the bubble and as a result it shrinks. Two variables are measured against time via microscopic observation: R and film radius (r). DB method was initially created for experimental determination of contact angles and tensions along contact lines of Newton black films formed by small surfactant molecules. It is used in particular to estimate film permeability coefficients (K), ability of bubble surfaces to block gas flow related to the 12.
(32) molecular organization at interfaces. Values of K are estimated using the expression proposed by Krustev et al. (1996):. . K. . . Patm 4 8 R0 Rt4 R03 Rt3 8 9. . t. r. 2. (1.9). dt. 0. Figure 1.3: Schematic representation of gas diffusion process from a small bubble into the outer medium due to Laplace pressure in the diminishing bubble approach. Film formed at the top of the bubble is a bilayer as those formed in foams.. 13.
(33) There is limited literature data of protein film permeabilities. Microscopic films made from β-lactoglobulin solutions with different concentrations and pH values were studied by Petkova et al. (2003) using DB method. Authors reported values between 0.017-0.022 cm/s, close to permeability values reported for simple surfactants (Nedyalkov et al. 1988; Nedyalkov et al. 1992) or phospholipid mixtures (Trachant et al. 2002). Due to the relatively slow protein adsorption kinetics, K values are observed to vary with time. Film structure changes because of protein rearrangements and thinning due to drainage. The phenomenon has been discussed by Schmitt et al. (2005) who reported a permeability increase of 20 times for freshly formed films compared to those aged for 24 hrs (0.021 and 0.449 cm/s, respectively). In Chapter 2, I present and discuss a variation of the DB method implemented in this work to calculate protein film permeabilities. The objective was to simplify the original DB approach avoiding measuring r and base calculations solely on R values measured automatically by image analysis. Considering that bubble shrinkage results from gas flow through the film into the atmosphere, total mass balance yields the following expression relating the film permeability coefficient with shrinkage kinetics:. K 4. . . Patm 4 2 R0 Rt4 R03 Rt3 8 9. . t. (1.10). A dt f. 0. Eq. 1.10 is analogous to Eq. 1.9 proposed by Krustev et al. (1996) but r is replaced by the film area (Af). The change rate of Af with time is calculated with Eq. 1.11 obtained from the first derivative of the total mass balance. 2 Patm Patm 8 dR 4 d 2 R 3 R R R t 3 dt 3 dt 2 A f t A0 exp dt 0 P 4 dR R atm R 3 dt . (1.11). 14.
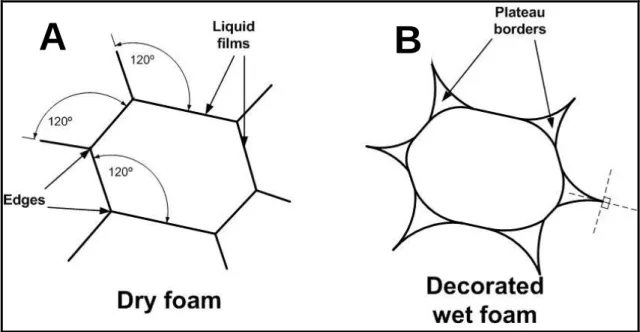
(34) Initial film area (A0) is estimated by a balance between buoyancy forces and surface tension forces. When using Eqs. 1.10 and 1.11 (and also Eq. 1.9) it is assumed that bubble shrinkage is only caused by gas flow into the atmosphere. Gas diffusion into solutions bulk is neglected. Above equations consider also that bubbles remain spherical and that film area can be approximated to a flat disc. Values of K obtained in this work presented in Chapter 2 were higher compared to those reported in previous studies for protein films. Divergences are attributed to the complexities of protein systems where even low levels of contamination can affect bubble resistances to shrinkage (Dickinson et al., 2002). 1.3.. Foam architectures The third level in the proposed length scale scheme (Figure 1.1) is the bubble. size level. Most important at this stage is the ability to produce stable foams and the particular characteristics of bubble structures within foams system. 1.3.1.. Equilibrium rules for films and bubbles First rule that defines equilibrium between liquid films and bubbles is the law. of Laplace (Eq. 1.8). Excess pressure that arises to counter balance surface tension explains why bubbles do not shrink until disappearing but equilibrate to form spherical shaped bubbles in three-dimensions or circular discs in two-dimension cross sections. However, within foams only for certain small bubble clusters films remain truly spherical (Weaire and Hutzler, 1999). Work performed by Plateau (1873) may be considered the first scientific study on films, bubbles and foams. Plateau added to the law of Laplace the rules required to define equilibrium for liquid films and bubbles. The laws of Plateau relate to foams in the dry limit but can also apply in more general cases. In dry foams, liquid fractions are very small (<1%) and bubbles adopt polyhedral forms with thin films as their faces, often idealized as single surfaces. Two-dimensional dry foams consist of polygonal cells (Figure 1.4). Plateau stated that for dry foams, films (lines which define cell boundaries in two-dimensions) can intersect only 3 at a time and at angles of 120º (Figure 1.4). Films between gas cells meet in lines forming the edges of. 15.
(35) the polyhedral cells in space, and lines meet at vertices. The second law of Plateau states that at vertices no more than 4 intersection lines (or 6 surfaces) may meet, and that this tetrahedral vertex is perfectly symmetric forming an angle equal to cos-1(-1/3) (~109.5º). Although these rules are concerned mostly with isolated films, bubbles, and their junctions rather than on extended foam structures, they establish the essential laws to define equilibrium configurations. Employed in conjunction with assumptions about gas compressibility, these laws are the basis for foam structure simulations (Weaire and Hutzler, 1999).. A. B. Figure 1.4: Foam structure description. (A) In dry foams bubbles adopt polyhedral forms where Plateau borders can intersect only 3 at a time and at angles of 120º. (B) In wet foams liquid is contained in Plateau borders where they join an adjacent film. Surface normal is the same on both sides of the intersections.. When foam liquid fractions rise over 1%, previous geometrical description does not strictly applies and Plateau laws need to be reconsidered. Liquid is mainly contained in the Plateau borders, finite width channels that replace lines in dry foams (Figure 1.4). Plateau equilibrium rule states that where a Plateau border joins an adjacent 16.
(36) film, the line normal to the surface is the same on both sides of the intersection. However, no general stability rules can be applied to intersection multiplicity at Plateau borders or their own intersection or junctions. It can only be expected to find features exhibited by dry foams in fairly dry foams dressed with Plateau borders. In twodimensions this idea is given by the decoration theorem (Weaire and Hutzler, 1999): equilibrated wet foams are obtained by the superposition of Plateau borders at each vertex of dry foams in two-dimensions (Figure 1.4B). As liquid fraction further increases, sharp edges of polyhedral (or polygonal) cells are rounded off leading to extreme wet foam limit. At this point cells recover spherical (or circular) shapes and any further liquid increase allows them to come apart. Foam losses all rigidity and becomes a bubbly liquid instead. 1.3.2.. Evaluation of foams Characterization of bubble containing structures is not a simple task because. of the very complicated mechanisms associated with formation and stability of such systems. Most direct measurements on fluid foams are related to bulk properties such as foamability (ease with which a foams is formed) and foam stability (Campbell and Mougeot, 1999). Common procedure to determine foamability is to measure time required to form a certain foam volume by sparging gas into a liquid. Foam stability is usually characterized by foam half-life, drainage rates, and conductivity change rates. Air content of aerated foods is expressed as the void fraction of air or gas hold up (Ø) (volume fraction of gas based on the dispersion volume). Various experimental approaches are used to determine gas hold-up depending on product characteristics (Niranjan and Silva, 2008). A standard procedure for liquids and pastes with medium to high viscosities is filling and weighing a cup, first with the continuous phase (mc) and then with the foamed dispersion (mf). Gas hold up is estimated by density difference (Eq. 1.12). Solid foams like aerated chocolates require different approaches like the flotation method (Haedelt et al., 2005). Instrumental methods based on optical probes (Bispernik et al,. 1992) and ultrasound (Fox et al., 2004) have also been developed to measure Ø directly. 17.
(37) . 100 1 . mf mc . (1.12). Another parameter used to describe aerated foods is overrun (Eq. 1.13), particularly for systems with very high gas content. It represents the gas fraction based on the volume of the continuous phase, and is related to Ø by:. overrun 100 100 . (1.13). Instruments specifically designed to evaluate foaming properties of surface active compounds are available. Foamscan (ITConcept, Longessaigne, France), developed from the work of Guillerme et al. (1993), allows direct observation and measurement of volume increase of foams formed by sparging with a controlled gas flow. Foam stability is followed by measuring variation of foam height and drainage rates as functions of time. System consists basically of a glass cylinder were foam is formed under user defined conditions. Foam volume during foam creation and collapse are measured in real time by image processing, whereas liquid fractions and drainage rates are quantified also in real time by resistivity measurements from electrodes located at different heights of the glass tube. Simple parameters that characterize foam properties like foam density, foam expansion coefficient, foaming capability are determined from these experiments. Foamscan, and similar systems based on the idea of Guillerme et al. (1993), had been used to study the foaming behaviour of casein (Guillerme et al., 1993; Fains et al., 1997; Rodriguez Patino et al., 1997), β-casein (Sarker et al., 1998), sodium caseinate (Carrera Sanchez and Rodriguez Patino, 2005), βlactoglobulin (Sitohy et al., 1995; Schmitt et al., 2005), ovotransferrin (Sarker et al., 1998), acetyled and succinylated pea isolates (Fains et al., 1997), soybean isolate (Guillerme et al., 1993), deamidated gluten (Guillerme et al., 1993; Fains et al., 1997), potato raw proteins (Ralet and Guéguen, 2001), egg-white (Baniel et al., 1997; Hagolle et al., 2000), sodium oleate (Beneventi et al., 2003), bovine serum albumin (Rodriguez. 18.
(38) Patino et al., 1997; Sarker et al., 1998), soy globulins (Pizones Ruiz-Henestrosa et al., 2007) and whey protein isolate (Schmitt et al., 2007), among other systems. Foamscan was used in this thesis to measure foaming properties of sodium caseinate and its conjugate. Results described in Chapter 2 show the remarkable improvement on foaming properties as consequence of protein conjugation. 1.3.3.. Image analysis of foams Digital image analysis has become an important tool in many fields including. food science because of the valuable quantitative information and numerical data that can be extracted from images (Aguilera and Stanley, 1999; Russ, 2005). Advances in imaging and computing technologies have make now possible the objective quantification of foams and sponge cell structures (Cauvain, 2003). The general image analysis methodology is usually divided into different consecutive steps which involve image acquisition, pre-processing operations, image segmentation, and feature extraction (Aguilera and Germain, 2007). Figure 1.5A shows grey scale images of fresh protein foam acquired using a CCD camera during work in this thesis. It shows also results of segmenting individual bubbles by thresholding their grey level counterparts. Resulting images can then be further analyzed to measure different attributes. Undoubtedly, the main feature characterizing foam structures is bubble size, but other relevant characteristics/properties can be obtained from images as well. Bubble sizes Methods commonly used to determine foam bubble sizes are optical probes, ultrasound sampling probes, and photographic techniques (Niranjan and Silva, 2008). Optical probes consist of fibreglass sensors moved through samples allowing localized determination of bubble size distributions (Bispernik et al., 1992). Ultrasound sampling probes are based on measuring velocities and attenuation spectra of ultrasound waves through samples, information related to bubble sizes (Kulmyrzaev et al. 2000). However, these techniques usually require dilute systems and are intrusive. Photographic techniques coupled with image analysis software have been most widely 19.
(39) used in analysis of bubble-containing foods and determination of bubble size distributions (Germain and Aguilera, 2006).. Figure 1.5: (A) Processed grey-level and thresholded images of fresh protein foams. (B) Cumulative bubble sized distributions for the foams in A determined by image analysis. (C) Classification of foams images through texture and discriminant analysis.. 20.
(40) Food foams are complex three-dimensional structures generally difficult to observe (Pugh, 2005). The common approach for studying foam structures is therefore using images of two-dimensional foams (e.g., thin foams produced between 2 transparent plates), or two-dimensional images from three-dimensional foam structures. There is a wide range of imaging techniques available and used to characterize foam structures, among them light microscopy (LM), confocal laser scanning (CLSM), scanning electron microscopy (SEM), cryo-SEM, direct use of CCD cameras, and magnetic resonance imaging (MRI). Several literature examples applying these imaging techniques to analyze bubble sizes in foams and aerated products can be found. Bubble size distributions have been determined from LM images by Kulmyrzaev et al. (2000) and Bals and Kulozik (2003) for whey protein isolate foams, by Schoonman et al. (2001) for maltodextrin/sodium caseinate solid foams, by Chang and Hartel (2002) and Eisner et al. (2005) for whipped and ice cream, by Sahi and Alava (2003) and Hicsasmaz et al. (2003) for cake batters, and by Jang et al. (2005) for gelatine solutions and food emulsions, among others. In a similar way, bubble size distributions have been measured from cake batters and whipped emulsions from fresh milk and whole egg by Richarson et al. (2002) and Martinet et al. (2005), respectively, using CSLM. SEM has been used by Alavi et al. (1999) to determine bubble size distributions in proteinstabilized starch-based supercritical fluid extrudates, and also cryo-SEM has been used by Chang and Hartel (2002) and Eisner et al. (2005) in whipped and ice cream for this purpose. Foams from cream, egg white and beer have been analyzed by MRI and signal intensities contributed by aqueous protons recorded over foam lifetime to measure densities, drainage and structure collapse (German and McCarthy, 1989). Duce et al. (1995) analyzed a selection of foamed dairy products non-invasively by three different MRI methods. Most recently, X-ray tomography has risen as a suitable imaging technology to non-invasively generate views of cellular material structures (Trater et al. 2005). Xrays are used to obtain series of images at different sample depths. X-rays have proved very useful in analyzing cellular structures because they penetrate materials giving sample image with minimal preparation and non-invasively. Technique has been used by 21.
(41) Lim and Barigou (2004) for investigating cellular structures of aerated chocolate bars, strawberry mousses, honeycomb chocolate bars, chocolate muffins, and marshmallows. It has also been employed by Babin et al. (2005, 2006) to analyze bread crumb structures and by Haedelt et al. (2005) for macro aerated chocolate. However, application is currently limited for bubble sizes over 50 μm and completely stable food systems. The disadvantage of 2D images analysis is that actual food foams are 3D objects. Richardson et al. (2002) indicated that, although bubble size distributions measured for cake batter are good enough for comparison and performance evaluation purposes, these were not real distributions. Real bubble size distributions can be extracted from 2D data by stereology if required. Stereology is a group of mathematical methods that allow estimating parameters of three-dimensional structures by measuring two-dimensional sections. Schoonman et al. (2001) used stereological techniques to unfold true bubble size distributions in foamed maltodextrin/sodium caseinate powders from light microscopy images. Lim and Barigou (2004) measured real size distribution of different food samples from 2D images obtained by X-rays. Figure 1.5B shows cumulative bubble size distributions calculated from corresponding binary images in Figure 1.5A. Bubble sizes correspond to equivalent diameter determined from projected bubble areas. These distributions do not correspond to real sample bubble size distributions; however, they serve for comparison because in the three cases images were acquired at identical conditions. Image texture analysis Image texture analysis (ITA) is another technique progressively gaining popularity in digital image analysis (Aguilera and Germain, 2007). Image texture (not be confused with sensorial texture defined for foods by mechanical instrumental measurements) is used as a way to describe visual perception of irregularities and variations. It relates pixel brightness values with spatial distributions. There are several possibilities for calculating food image textural properties classified in three main 22.
(42) groups: statistical, model-based, and transform-based techniques (Zheng et al., 2006). ITA usefulness is that it can be applied for objective characterization of complex food foams “architectures”. Possibly first published work using ITA to describe images of foam-like structures was the one by Bertrand et al. (1992). Textural features were extracted from bread crumb images by a procedure based on the two-dimensional Haar transform and a total of 66 textural features were obtained. A stepwise discriminant analysis allowed identification of 6 texture characteristics which permitted about 81% correct classification of samples into seven specific classes according to the treatments used in bread preparation. Using same mathematical method, Guillerme et al. (1993) evaluated image texture of liquid foams formed using three different protein solutions (casein, soybean isolate, deamidated gluten). Foams were formed by sparging and images recorded with a video camera coupled to the foaming apparatus. 81 textural characteristics were extracted from each image and subsequently analyzed using principal components to determine similarities between foam textures. Authors concluded that procedure was well-adapted for comparison and classification of foams, however, it did not adequately describe physical mechanisms of foam formation and destabilization. Following studies by Fains et al. (1997), Hagolle et al. (2000), and Rahali and Guegen (2000) used the same experimental approach to investigate other protein-based liquid foams. Fains et al. (1997) analyzed foaming properties of four protein solutions (casein, acetyled and succinylated pea isolates, and deamidated gluten) indicating that textural features derived from two-dimensional Haar transforms made possible to distinguish different protein foams and to differentiate between stable and unstable systems. Hagolle et al. (2000) investigated effects of heating on foaming properties of two egg white proteins (ovalbumin and lysozyme). They concluded that image analysis allowed describing texture evolution with foam aging and also discriminating differences induced by small increments in temperature. Rahali and Guegen (2000) evaluated foamed solutions of bovine β-lactoglobulin and enzymatic hydrolysates. ITA allowed identification of three distinctive regions within the principal components map correlated with foam stability measurements. A different approach was 23.
Figure
+7


Documento similar
Resonance fluorescence is, indeed, ideally suited to pioneer a comprehensive analysis of frequency photon correlations since it is obtained in the strong- driving regime of an
In summary, the ability to perform a complete characterization of all TE properties of a bulk material as a function of temperature, from a single electrical impedance
In the Gal-3[N VII-IX] structure modelled with both X-ray crystallography and SAXS data, this Ser6 residue is readily availa- ble in the surface of a pocket where kinases may bind
Interestingly, when FtsZ filaments were reconstituted onto lipid bilayers anchoring the polymers to the membrane through ZipA, a natural anchoring protein in the bacterial cell
The length of these alkyl groups was precisely tailored at each base in order to completely fill the secondary unspecific pores generated between 4 cyclic tetramers and, at the
The developmental sample was used to analyze the factorial structure of the WHOQOL-AGE by means of ex- ploratory factor analysis, whereas the validation sample was used to assess
the intention to give Your Paternity some sort of information about the way of life of non-Chistians in this part of the world and especiauy about tho brahmams,
The results obtained using the new technique are validated by comparing them with those obtained using a finite-element technique, and with a standard IE implementation using
