BAT AGN Spectroscopic Survey VIII Type 1 AGN with Massive Absorbing Columns
11
0
0
Texto completo
(2) The Astrophysical Journal, 856:154 (11pp), 2018 April 1. Shimizu et al.. focus on the opposite case, Type 1 AGNs that appear to be X-ray absorbed. Previous studies have found Type 1 AGNs with large X-ray absorbing columns; however, both the fraction and interpretation have varied. Perola et al. (2004) found that 10% of broad line AGNs are X-ray absorbed within the HELLAS2XMM 1 degree field survey, while Tozzi et al. (2006) estimated that at least 20% of AGNs in the Chandra Deep Field South have inconsistent optical and X-ray classifications. Both Tajer et al. (2007) and, more recently, Merloni et al. (2014) instead find that around 30% of optically unobscured AGNs are X-ray absorbed. Merloni et al. (2014), interestingly, also showed an increasing fraction of X-ray absorbed, but optically unobscured AGNs at higher X-ray luminosities. There are also several explanations for observing X-ray absorbed broad line AGNs that only require small, or no, modifications to the unified model. An easy explanation is that our line of sight is grazing the edge of the torus, where perhaps the cloud distribution is less dense but the covering fraction of the X-ray corona is much larger than the BLR due to the corona’s smaller physical size. Another related possibility is that a cloud, perhaps from the torus or the BLR itself, has entered our line of sight causing a relatively brief increase in the X-ray absorbing column but leaving the BLR emission unaffected. Both explanations would also explain the relative rarity of X-ray absorbed Type 1 AGNs. Davies et al. (2015) suggested a luminosity dependence on the gas properties of the torus. At low luminosities, dust in the torus extends all the way down to the inner edge while at higher luminosities, dust-free gas dominates at small radii and changes to the standard dusty torus at larger radii. Thus, the X-ray absorbed fraction, does not change with luminosity but the optically obscured fraction should decrease with increasing luminosity as more lines of sight open up toward the BLR. This explains the luminosity dependencies seen in Merloni et al. (2014) but keeps the popular unified model intact with only a slight modification. What has been lacking in previous studies of the relationship between optical obscuration and X-ray absorption is relatively bias-free selection of AGNs and consistent classifications and measures of the AGN properties. Many of the studies previously mentioned have relied on AGN selection in the 2–10 keV band, which can be heavily affected by even moderate X-ray absorption (NH ∼1023 Koss et al. 2016) and thereby bias the sample against X-ray absorbed objects. Furthermore, definitions of optically obscured and unobscured, as well as X-ray absorbed and unabsorbed, have either changed or relied on less reliable methods such as SED fitting to define optical obscuration or hardness ratios to define the level of X-ray absorption. In this work, we draw on a sample of low-redshift AGNs selected at ultra-hard X-rays (14–195keV) that largely avoid biases due to both X-ray absorption and host galaxy contamination. Furthermore, this large sample of AGNs has been systematically analyzed in both the optical and X-ray regime (Koss et al. 2017; Ricci et al. 2017a) leading to welldefined classifications and measurements of their properties, including the X-ray absorbing column and broad line emission. We use these measurements to investigate the prevalence of strong X-ray absorption in Type 1 AGNs and discuss the implications of our results in the context of the unified model and the structure of AGNs.. 2. Sample and Data Our parent sample consists of all AGNs in the BAT AGN Spectroscopic Survey10 (BASS; Koss et al. 2017; Ricci et al. 2017a). The BASS team has analyzed both new and archival optical spectra for a large fraction (77%; 641/836) of the AGNs detected as part of the 70-month Swift Burst Alert Telescope (BAT; Gehrels et al. 2004; Barthelmy et al. 2005) catalog (Baumgartner et al. 2013). Swift/BAT has been continuously surveying the entire sky at high energies (14–195keV); producing a nearly complete sample of AGNs up to the Compton thick limit (Ricci et al. 2015) and reducing selection effects associated with host galaxy contamination and obscuration. Koss et al. (2017) found that the average reddening, measured using the Balmer decrement, for the BASS AGN is significantly higher than optically selected AGNs from SDSS and that a significant fraction of BASS AGNs lacked any Balmer lines. This all points to hard X-ray selected AGN samples, including more obscured or optically contaminated AGNs that optical spectroscopic surveys would not select. For this work, we need reliable measurements of the broad Hα flux, intrinsic hard X-ray flux, and X-ray absorbing column density. Therefore, we chose all AGNs with detected broad Hα from the original BASS analysis, as well as AGNs that were part of the BASS X-ray spectral analysis presented in the BASS X-ray catalog (Ricci et al. 2017a). The key measurements obtained from the X-ray spectral analysis are NH estimates and k- and absorption corrected 14–150keV flux (hereafter referred to as the intrinsic X-ray flux). Details of the X-ray spectral analysis can be found in Ricci et al. (2017a). We limited our sample based on the following requirements with fractions of the parent sample included in parentheses: 1. Seyfert classification according to Winkler (1992): 594/ 641 (93%, see below and the Appendix for our modifications). 2. Nonblazar based on exclusion from the Roma Blazar Catalog (Massaro et al. 2009; 581/641, 91%). 3. X-ray flux and NH measurement (638/641, 99%). 4. Measured distance (634/641, 99%). 5. Quality flag of 1 or 2 for the spectral fitting of the Hα region (226/641, 35%). The last requirement above, regarding quality flags ensured that we removed all sources whose spectra either did not cover the Hα spectral region or the spectral fitting were unreliable. For a detailed description of the optical spectral fitting and explanation of each flag, see the BASS Data Release 1 publication (Koss et al. 2017). Briefly, a quality flag of 1 indicates a good fit with small residuals, while a quality flag of 2 indicates an acceptable fit with larger residuals, which is representative of the emission line profiles overall. As expected, the quality flag requirement is the most restrictive given that it filters out nearly all Type 2 AGNs as well as some Type 1 AGNs with either poor spectra or high redshifts that move Hα out of the spectral range. Broad Hα and intrinsic X-ray fluxes were converted to luminosities using either the redshift independent distances compiled from the NASA/IPAC Extragalactic Database11 when available or luminosity distances calculated based on 10 11. 2. https://www.bass-survey.com http://ned.ipac.caltech.edu/.
(3) The Astrophysical Journal, 856:154 (11pp), 2018 April 1. Shimizu et al.. the measured redshifts from the spectral analysis and our chosen cosmology (H0=70 kms−1 Mpc−1, Ωm=0.3). Finally, we wanted to ensure that the measured broad Hα component was truly originating from the BLR. Trippe et al. (2010) showed that intermediate-type AGNs, especially Sy 1.8s and 1.9s, can often be misclassified. While Sy 1–1.5s have a corresponding broad Hβ to match their broad Hα component, Sy 1.9s by their very definition do not. Therefore, it is possible that what may seem like a broad Hα component could in fact be due to another process entirely unrelated to the BLR, such as an outflow, especially for sources with low measured FWHM (σv<2000 kms−1) for broad Hα. High-velocity wings present in both Hα and [N II] could be disguised as a faint broad Hα component in moderate resolution spectra due to the heavy blending between Hα and the [N II] doublet. In the Appendix, we reanalyzed the Hα+[N II] complex for the 57 Sy 1.9s that originally fit the above criteria and determined that for 18/57 (∼30%) Sy 1.9s, an outflowing component could reasonably explain the originally measured broad Hα component. While not definitive proof that these AGNs have been misclassified, they could potentially bias our results, especially since many are X-ray absorbed. Thus, we have chosen to remove these 18 Sy 1.9s from our sample. Our final sample consists of 190 Type 1 AGNs with 20, 66, 65, and 38 Sy 1s, 1.2s, 1.5s, and 1.9s respectively.12 3. Results We first start by showing the NH distribution for our Type 1 AGN sample in Figure 1 regardless of whether the source has a broad Hα measurement and include as well all of the Sy 2s from BASS for reference. While there is an increase in the number of X-ray absorbed AGNs moving from Sy 1s to 2s, the biggest increase certainly occurs for the Sy 1.9 subsample. If we arbitrarily create a cutoff at NH =1022 cm−2 for X-ray unabsorbed and absorbed AGNs, the fraction of X-ray +0.08 +0.16 +0.16 absorbed AGNs is <0.12, 0.080.05 , 0.05-0.03 , 0.45-0.15 , and +0.03 0.96-0.02 for Sy 1s, 1.2s, 1.5s, 1.9s, and 2s, respectively, where the uncertainties have been calculated assuming binomial statistics (Gehrels 1986). Therefore, the level of X-ray absorption in Sy 1.9s seems to be intermediate between Sy 1–1.5s and Sy 2s based on the fraction of sources with high X-ray absorption. This is certainly not new and has been observed before in smaller samples (e.g., Risaliti et al. 1999) and is the reason Sy 1.9s are routinely grouped along with Sy 2s to form a general “absorbed” AGN sample. Naïvely, one would expect the same structure (i.e., dusty torus) to cause both optical obscuration of the BLR and absorption of the X-ray emission. We would then expect to observe a level of optical obscuration in Sy 1.9s consistent with the X-ray NH measurements. Measuring the optical obscuration toward the BLR, however, is difficult and usually involves a number of assumptions about the geometry and ionization state of BLR clouds. The standard method is to assume Case B recombination and use the ratio of broad Hα to Hβ emission as an estimate of the BLR extinction. By the very definition of a Sy 1.9 AGN (i.e., absence of broad Hβ), however, this method is not viable for all sources of our sample because it can provide only lower limits to the optical obscuration. Furthermore, the assumption of Case B recombination in the BLR has been shown to be a questionable assumption (e.g., Schnorr-Müller et al. 2016). 12. Figure 1. NH distribution for the Sy 1s, 1.2s, 1.5s, and 1.9s in our Type 1 AGN sample and Sy 2s in the full BASS sample. Red dashed lines indicate the median NH for each subsample excluding NH >1024 cm−2 to avoid incompleteness. NH = 1020 cm−2 is the lowest column density that is able to be measured in the X-ray due to Galactic absorption.. Instead, we rely on the existence of a linear relationship between the bolometric AGN luminosity and the broad Hα luminosity. Stern & Laor (2012) studied more than 3000 broad. The BASS sample interestingly does not contain any Sy 1.8s.. 3.
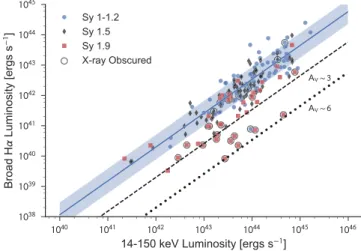
(4) The Astrophysical Journal, 856:154 (11pp), 2018 April 1. Shimizu et al.. line AGNs from the Sloan Digital Sky Survey (SDSS), finding that the relation between far-UV (near the peak of the AGN SED) and broad Hα is linear, especially for the highest luminosity bins. At lower broad Hα luminosity, the relation does slightly flatten such that they observe more FUV emission than expected; however, the deviation is small and they show that it is likely due to host galaxy contamination based on the changing broad Hα relationships with other wavelengths. Thus, they conclude that the covering fraction of the BLR is likely independent of AGN luminosity and the broad Hα luminosity can reliably be used as a tracer of the bolometric luminosity. Especially useful for this work is the fact that in their analysis the tightest correlation with broad Hα occurred with the 2keV monochromatic luminosity, which is the most likely regime to be unaffected by any host galaxy contribution. Elitzur et al. (2014) dispute this and show that by subclassing the SDSS broad line AGNs, intermediate-type AGNs exhibit reduced levels of broad Hα compared to their X-ray emission. They interpret this as a reduction in the covering factor (∝LbHα/LBol) for the BLR as the Eddington ratio (∝LBol/MBH) decreases, which they also find is similarly reduced for intermediate-type AGNs. Our need, however, is only an upper limit on the optical obscuration toward the BLR. If the intrinsic relationship is linear, then we should see a reduction in LbHα/LBol and can use the deficit as a measure of the extinction. If, on the other hand, the intrinsic relationship is not linear and LbHα/LBol decreases with luminosity, then the deviation from a linear relationship is not indicative of any optical obscuration and the extinction toward the BLR is negligible. Therefore, by assuming a linear relationship, we are actually being conservative in our measurement of the BLR extinction. To begin, we assume that the intrinsic X-ray luminosity is an accurate tracer of the bolometric AGN luminosity as has been shown in previous studies (e.g., Vasudevan & Fabian 2007; Winter et al. 2012). In Figure 2, we show the correlation between the broad Hα and intrinsic X-ray luminosities for Sy 1–1.2s as blue dots. The correlation is highly significant with a Pearson correlation coefficient of 0.85 and p-value of <0.001. We fit a simple line using linear least squares between the broad Hα luminosity and intrinsic X-ray luminosity finding the following relation:13 log L bHa = 1.06 log L14 - 150 keV - 4.32.. Figure 2. Relationship between intrinsic X-ray (14–150 keV) luminosity and observed broad Hα luminosity for BASS selected Sy 1–1.9s. Blue dots correspond to Sy 1–1.2s, which were used to measure the best-fit line (solid blue line) and scatter (blue shaded region) between the X-ray emission and broad Hα emission. Black diamonds show the Sy 1.5s, while red squares plot the Sy 1.9s. X-ray absorbed sources (NH >1022 cm−2) are encircled. The black dashed line shows our chosen threshold for optically obscured sources, which are 1 dex (corresponding to about 2.5σ and AV∼3 mag) below the measured best-fit line, while the black dotted line shows approximately the maximum reduction we observe in broad Hα of 2 dex and AV∼6 mag.. calculate the visual extinction, AV, given an extinction law. For this work, we use the empirically determined extinction law from Wild et al. (2011) that was also used in our previous study investigating BLR obscuration (Schnorr-Müller et al. 2016): Al = 0.6 (l 5500)-1.3 + 0.4 (l 5500)-0.7 , AV. (2 ). where λ is the rest wavelength for Hα (6563 Å) and AbHa = -2.5 log (L bHa,X L bHa.obs). In the last relation, LbHα,X is the expected broad Hα luminosity based on Equation (1) and LbHα,obs is the observed broad Hα luminosity. Using these equations, the maximum reduction in the broad Hα luminosity we observe (black dotted line) corresponds to only an AV∼6mag with an uncertainty in AV, σAV=1.2mag based on the 0.4 dex scatter seen in Figure 2. If we also assume a Galactic NH /AV ratio of 1.87×1021 cm−2 (Draine 2011), we expect a maximum NH ∼1022cm−2, the cutoff we used for our definition of X-ray absorbed. Therefore, based on the optical obscuration toward the BLR, we would expect virtually all of our Sy 1.9s to be X-ray unabsorbed. Instead, Figures 1 and 2 show that over half of the Sy 1.9s have NH values above 1022 cm−2 meaning along our lines of sight toward a significant fraction of Sy 1.9s, there is either more or different gas and dust hiding the central X-ray source than there is in front of the BLR. This is also shown by comparing X-ray derived NH values with the broad Hα derived AV values illustrated in Figure 3. For most of the Sy 1–1.5s, both NH and AV are low, whereas the Sy 1.9s form the majority of the high NH and high AV Type 1 AGNs. Below AV=3 mag, most of the AGNs either scatter around the gray shaded line, which represents the spread of typical gas-to-dust ratios (GDR) found in our Galaxy (NH /AV=1.79 − 2.69× 1021 cm−2), or lie along NH = 1020 cm−2 or AV=0 mag. Above AV=3 mag, all but one AGN is a Sy 1.9 and all either lie on the Galactic GDR line or above it, sometimes with several orders of magnitude more column density than expected for a Galactic GDR.. (1). We plot Equation (1) in Figure 2 as a blue line along with shading to indicate our measured±0.4 dex scatter. As red squares, we show our Sy 1.9 sample. A large fraction of Sy 1.9s lie systematically below the relationship defined by the Sy 1–1.2s and well outside the estimated scatter. The black dotted line indicates a reduction of 2 dex in the broad Hα luminosity and highlights roughly the maximum decrease we observe for Sy 1.9s. We also plot Sy 1.5s as black diamonds to show that, while they were not included in our calculation of the best fit, Sy 1.5s also lie along the line and within the scatter. Finally, sources outlined by black circles are X-ray absorbed, defined above as having NH >1022cm−2. Assuming that the reduction in broad Hα luminosity compared to the X-ray luminosity is completely due to obscuration as was first done in Ward et al. (1988), we 13. Using a photon index of 1.8, the equivalent relationship for the 2–10 keV energy range has an intercept of 4.71.. 4.
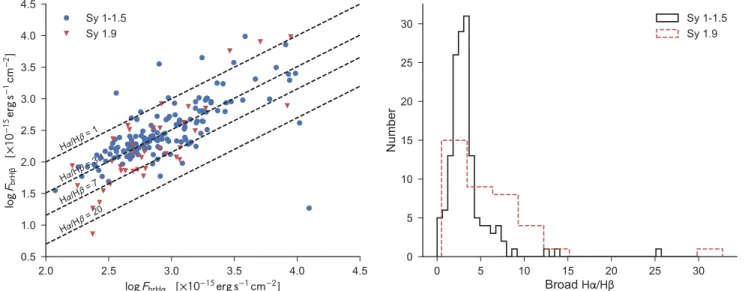
(5) The Astrophysical Journal, 856:154 (11pp), 2018 April 1. Shimizu et al.. Figure 3. Comparison between the X-ray absorbing column density (NH ) and the optical extinction measured using the broad Hα-to-X-ray relationship. The symbols are the same as those in Figure 2 and the gray shaded region is the expected relationship for the range of Galactic dust-to-gas ratios found in the literature (NH /AV=1.79–2.69×1021 cm−2). The black dashed line indicates the usual cutoff discriminating X-ray unabsorbed and absorbed AGNs. The uncertainty in our AV measurement, σAV=1.2 mag, is shown in the lower left corner.. Figure 4. Comparison of AV from this work (blue dots), Burtscher et al. (2016; orange squares), and Schnorr-Müller et al. (2016, green diamonds). Error bars are 1.2 mag for this work, 3 mag for Burtscher et al. (2016), and between 0.1 and 1.3 mag for Schnorr-Müller et al. (2016, see Table 4).. 4. Discussion. Figure 3 confirms the findings of Schnorr-Müller et al. (2016) and Burtscher et al. (2016). Both of these studies, through independent methods, found that intermediate Seyferts typically display moderate optical obscuration (AV=4–8 mag). Multiple sources also overlap between this work, Schnorr-Müller et al. (2016), and Burtscher et al. (2016), allowing for a comparison of AV determined through each method. Figure 4 displays this comparison for the 10 AGNs that are uniquely common. Six sources overlap between this work and Schnorr-Müller et al. (2016) with a median AV difference of −0.14 mag and a standard deviation of 0.67 mag. Eight sources overlap between this work and Burtscher et al. (2016) with a median AV difference of 0 mag and a standard deviation of 1.4 mag. The AVs from all three studies correspond well with each other within our uncertainty (1.2 mag) and validates our relatively simple method for measuring the optical obscuration toward the BLR, especially given the more robust photoionization modeling used in SchnorrMüller et al. (2016). With our much larger sample, though, we find a much larger range in NH values for Sy 1.9s. Whereas Burtscher et al. (2016) determined that using log NH =22.3 cm−2 as a threshold for X-ray absorbed AGNs consistently classified Sy 1.9s as unobscured objects, we find that Sy 1.9s instead span log NH values all the way up to 25. Indeed, 12/39 (32%) of Sy 1.9 have NH measurements above this threshold. Sy 1.9s represent 60% of the Type 1 AGNs that can be considered X-ray absorbed using a threshold of log NH >22.3 cm−2, which leads to a total X-ray absorbed, Type 1 AGN frequency of 10%. Lowering the threshold for X-ray absorbed AGNs to log NH =21.5 cm−2 increases the frequency to 20%, so we can confidently say the X-ray absorbed fraction within Type 1 AGNs is between 10% and 20%. These fractions are more in agreement with the results of Perola et al. (2004) and nearly a factor of 3 smaller than the rates found by Tajer et al. (2007) and Merloni et al. (2014). What is further clear from this study is that the hydrogen column densities measured from the X-ray spectra are generally much larger than those measured from the BLR extinction, assuming a Galactic GDR.. 4.1. Comparison with Hα/Hβ Ratios An important question in our analysis is whether our estimates of the optical extinction are reliable. While the values of AV seem to match those found in previous studies using independent methods, we can still test whether our measurements of AV make sense based on the Balmer decrement. For the Sy 1–1.5s, we can simply use the measured broad Hβ from BASS DR1. For the Sy 1.9s, where broad Hβ is absent, we derived upper limits using a Monte Carlo Markov Chain analysis on the Hβ spectral region with the Python package EMCEE (Foreman-Mackey et al. 2013). We fixed the FWHM and velocity of the narrow Hβ component to the values from BASS DR1 and fixed the FWHM for the broad Hβ component to that of broad Hα. Therefore, the only free parameters in the modeling is the amplitude of the broad and narrow component and the velocity of the broad component. For these parameters, we simply used a uniform prior between 0 and infinity for the amplitudes, and allowed the line center to vary between −1000 and 1000 km s−1. Upper limits on the broad Hβ flux were then calculated using the 99th percentile of the marginalized probability distribution for the broad Hβ amplitude, which equates to about a 3σ upper limit. To test for compatibility between Hα/Hβ ratios and our AV, we first assume that our measured optical extinction from the broad Hα-to-X-ray relationship is correct, and then use it to infer the intrinsic line ratio (or lower limit for Sy 1.9s) for each object by correcting both the Hα and Hβ fluxes for extinction based on the extinction law given by Equation (2). Figure 5 shows the results with the left panel displaying the relationship between the broad Hα and Hβ flux (upper limits for Sy 1.9s) for individual objects. Dashed lines indicate lines of a constant line ratio. The right panel shows the distribution of inferred intrinsic Hα/Hβ ratio for Sy 1–1.5s (black line) and lower limits for Sy 1.9s (red dashed line). We find that, for our Type 1 AGNs, our derived optical extinctions result mostly in intrinsic ratios of 1–7 with most objects scattered around the Case B value of 3.1. Dong et al. (2008) 5.
(6) The Astrophysical Journal, 856:154 (11pp), 2018 April 1. Shimizu et al.. Figure 5. Left:correlation between broad Hα and broad Hβ for Sy 1–1.5s (blue points) and Sy 1.9s (red triangles) after correcting for extinction under the assumption that the values of AV from the broad Hα-to-X-ray relationship are correct. The broad Hβ measurements for Sy 1.9s are 3σ upper limits. The black dotted lines show lines of constant Hα/Hβ ratio for various ratios between 1 and 20. Right:distribution of intrinsic broad Hα/Hβ ratios for Sy 1–1.5s (black solid line) and lower limits for Sy 1.9s (red dashed line).. studied 446 low-redshift Type 1 AGNs, finding Hα/Hβ line ratios between 2.3 and 4.2 and average of 3.06. La Mura et al. (2007) found a slightly higher median of 3.45 and a larger range between 1.56 and 4.87 from a study of 90 Type 1 AGNs. Both of these studies have a range of ratios that span a smaller range than ours and could indicate a flaw in our measurements. However, Baron et al. (2016) recently found, through an analysis of 5000 AGNs, a much broader range of intrinsic Hα/Hβ ratios (mean of 3.02 and scatter of 1.19), confirming the findings of Schnorr-Müller et al. (2016) and in line with the distribution we observe. Furthermore, photoionization modeling of BLR clouds has shown that the intrinsic Hα/Hβ ratio can be as large as 17 for reasonable BLR conditions (Korista & Goad 2004), which is above where the lower limits for the Sy 1.9s extend to. We conclude from this that our estimates of AV result in intrinsic line ratios consistent with those observed in previous studies. We emphasize that regardless of whether our measured AV exactly matches those from other methods, they do not rise to the high values expected based on the observed X-ray absorption.. Figure 6. Fraction of X-ray absorbed Type 1 AGNs as a function of intrinsic X-ray luminosity for the BASS sample. Error bars and upper limits indicate the 95% binomial confidence interval. The red points and line show the same fraction found in the higher redshift sample from Merloni et al. (2014). While the fraction of X-ray absorbed Type 1 AGNs increases strongly with luminosity in the high redshift sample, our low-redshift sample fraction either remains constant or perhaps decreases.. 4.2. Outlier Sources With confidence in our AV measurements, we take this opportunity to briefly discuss some AGNs that seem to contain extremely discrepant X-ray and optical absorbing columns. There are two classes we can focus on. One includes sources with high X-ray estimated NH values but low AV, and the other includes low X-ray NH values but large AV. The former case is actually not unexpected given our preceding notion about the cause obscuration in AGNs. These sources, largely located in Figure 3 with log NH >22 and AV<1.0 mag can be explained as objects with a dominant column of dust-free gas along the line of sight. These fit into the general picture of the BLR being the source of X-ray obscuration as outlined in Davies et al. (2015). For these particular sources, there is simply a clear line of sight toward the BLR, but not toward the X-ray corona. The flip side, however, presents a challenge to this picture. We identify six sources with log NH <21 and AV>2.0 (so we are about 2σ away from AV=0.0), which implies a. line-of-sight medium with the ability to obscure the BLR but not the X-ray corona. These sources are B3 0749+460A, WKK 6092, 1RXS J174538.1+290823, MR 2251–178, Mrk 1393, and MCG -06-30-015. Spatially, this seems hard to explain, given the long-held model of a compact X-ray corona and much larger scale BLR. Anything that has the ability to obscure the BLR should also be obscuring the corona. We rechecked both the broad Hα and X-ray spectral fits to ensure that the analysis was performed correctly and nothing out of the ordinary was occurring with these objects. For all of the sources, the broad Hα and X-ray spectral fits were sound. We speculate instead that the optical extinction in these sources is caused by dusty, ionized (or warm) absorbers (e.g., Blustin et al. 2005; Laha et al. 2014) along their line of sight 6.
(7) The Astrophysical Journal, 856:154 (11pp), 2018 April 1. Shimizu et al.. instead of a column of neutral gas, which is what our NH values are measuring. Indeed, MR 2251–178 is a well-known quasar with strong signatures of ionized absorption (Halpern 1984). MCG -0630-015 was studied extensively in Reynolds et al. (1997) and concluded that dusty warm absorbers can plausibly explain the discrepancy between the reddening of optical emission lines/ continuum and the lack of cold, neutral X-ray absorption. Mrk 1393 shows signs of ionized absorption in the X-ray spectral fitting of Ricci et al. (2017a). With column densities spanning the range of log NH =21–22 (e.g., Winter et al. 2012), and an origin of the material from the dusty torus (e.g., Blustin et al. 2005), warm absorbers could likely be causing the observed 1–3 mag extinction. It is unclear whether the other 3 sources fit this model and will require a more extensive combined investigation of both the X-ray and optical data. Our team has an ongoing X-SHOOTER program to obtain higher quality optical-NIR spectra, including some of these sources.. This is also evident in Figure 6 which also shows a comparison between the results obtained from the BASS sample and that from Merloni et al. (2014). The “type 12” AGNs from their sample are the same X-ray absorbed Type 1 AGNs studied here, except at higher redshifts (0.3<z<3). There is a clear rise in the type 12 fraction as a function of X-ray luminosity that is not reflected in our low-redshift sample. Several factors could account for the discrepancy. The parent BAT AGN sample from which our study is based only covers a relatively small volume compared to the Merloni et al. (2014) sample. Therefore, our study does not include many high luminosity AGNs since the number density drops rapidly, though our last bin contains 73 AGNs. Since high-quality X-ray spectra were not available for all sources, Merloni et al. (2014) relied on hardness ratios to determine the X-ray absorbing column density. As they show, this method has a large scatter when compared to spectral measurements with differences up to 2 dex possible. As such, it is currently unclear whether the X-ray absorbed, Type 1 fraction increases, decreases, or is constant at higher luminosities. If we suppose our measurements, completely determined from both optical and X-ray spectra, are correct, then we can put them into the context of the recent work of Ricci et al. (2017b). They studied the general X-ray obscured fraction in the entire BASS sample, finding a significant decrease of the total X-ray absorbed fraction at a high Eddington ratio (λEdd). The explanation in Ricci et al. (2017b) is that radiative feedback from the AGN shapes the obscuring structure. At a low Eddington ratio, gas and dust are able to build up around the SMBH, increasing the covering factor of the “torus,” while at high Eddington, the AGN has cleared away large amounts of gas and dust. This results in a dramatic increase in unobscured AGNs at high Eddington as more lines of sight toward the BLR open up. For Type 1 AGNs, we do not observe a similar radical decrease in the X-ray absorbed fraction that Ricci et al. (2017b) find for primarily Type 2 AGNs. Using SMBH masses from the BASS DR1 and a cutoff of log λEdd=−1.5, we find an X-ray +7 +16 absorbed fraction of 2813 % and 18-5 % for low and high Eddington Type 1 AGNs. This indicates that, while the opening angle of the torus increases at high Eddington ratios, the fraction of sight lines through the BLR only mildly decreases and suggests that the covering factor of the BLR remains relatively constant. This could be further proof that dust is the key component to couple the AGN’s power to its surrounding environment as the dust covering factor seems to respond more dramatically than the neutral, dust-free BLR.. 4.3. Implications on the Structure and Geometry of AGNs One possible implication from our simple analysis is that the dust and gas obscuring the central X-ray corona in Type 1 AGNs is internal to the BLR. In fact, as suggested in several studies (Merloni et al. 2014; Davies et al. 2015; Burtscher et al. 2016), the X-ray obscuring structure is the neutral, dustfree gas within the BLR itself, a so-called “neutral torus” that is the inner extension of the dusty and molecular torus that creates the optical obscuration. These X-ray absorbed Type 1 AGNs, then are seen along lines of sight through the neutral torus, but not the dusty molecular torus, which would lead to a standard Type 2 AGN. A key prediction for this scheme is an increase in the number of X-ray absorbed, Type 1 AGNs as a function of AGN luminosity. This would occur due to the increase of the dust sublimation radius. At low luminosity, the dust sublimation radius is closer in, reducing the fraction of lines of sight that only intersect the neutral torus but not the molecular torus. We can check this prediction with our Type 1 sample. We determined the fraction of X-ray absorbed Type 1 AGNs within four log LX bins and show the results in Figure 6. The error bars on the fraction represent the 95% binomial confidence interval, while the error bars on the X-ray luminosity represent the range within the bin. In the lowest luminosity bin between log LX=41–42 erg s−1 there are no X-ray absorbed Type 1 AGNs, but there are also only five total Type 1 AGNs, as we are hampered by the flux limit of the BAT survey. Therefore, we show the 95% confidence upper limit. In the second bin, 4/16 Type 1 AGNs are X-ray absorbed and the large error bars reflect the relatively small sample size. Focusing on the two largest luminosity bins, which are centered on log LX=43.5 and 44.4 and contain 96 and 73 AGNs, respectively, we do not find a clear increase in the X-ray absorbed fraction as expected if the extent of the neutral torus is increasing with higher luminosity. Instead, it appears that the fraction is constant or possibly decreases. Using Fisher’s exact test, we find a p-value of 0.36, indicating that we cannot reject the null hypothesis that the X-ray absorbed fraction is the same in both bins. In fact, the p-value increases to 0.87 under the null hypothesis that the X-ray absorbed fraction is less than the lower luminosity bin. The results do not change if we combine all three of the lowest luminosity bins into one single bin and compare it to the highest luminosity bin.. 5. Summary and Conclusions In this paper, we have examined the X-ray absorbed fraction of Type 1 AGNs within a large, hard X-ray selected sample of low-redshift AGNs. Using the relationship between the broad Hα and X-ray luminosity as an estimate of the optical extinction, we show that the column densities of gas toward the X-ray corona and BLR are largely discrepant, indicating that the X-ray absorbing material is either internal or coincident with the BLR. The following summarizes our results: 1. Over the whole BASS sample, the fraction of Type 1 AGNs (i.e., those that show at least broad Hα), that are 7.
(8) The Astrophysical Journal, 856:154 (11pp), 2018 April 1. Shimizu et al.. X-ray absorbed is between 10% and 20% depending on the chosen NH cutoff. 2. Up to 30% of Sy 1.9s could be misclassified due to high-velocity outflows masquerading as a BLR component. 3. The X-ray absorbed Type 1 fraction is relatively constant, indicating a constant BLR covering fraction. 4. This further leads to a slight decrease with Eddington ratio, similar but not as dramatic as what is seen for the total fraction of obscured AGNs in the entire BASS sample. This could be an indication that dust is a necessary ingredient for coupling AGN radiation to the surrounding ISM.. Appendix Reevaluating the Broad Hα Component for Sy 1.9 We investigate the possibility that some Sy 1.9s, especially those with small FWHMs for their broad Hα component, could instead be Sy 2s with a strong outflowing component. The high-velocity wings associated with the outflow would be present in both the Hα and [N II] line profiles and could be misinterpreted as an underlying broad Hα component associated with the BLR. This could partly explain the high NH values seen for a large fraction of Sy 1.9s. NGC 5728 is a prime example of this misclassification. Within BASS, NGC 5728 was found to be a Sy 1.9 with an FWHM in broad Hα of 1766 km s−1. X-ray spectral analysis finds log NH=24.13, a seemingly perfect case of an AGN whose optical obscuration is much lower that the X-ray absorption. NGC 5728 has also been observed with VLT/ X-Shooter and VLT/SINFONI as part of our ongoing Local Luminous AGN with Matched Analogues (LLAMA Davies et al. 2015) program providing UV-NIR spectra with high spectral resolution (R∼8000) and NIR H+K band integral field unit imaging with high spatial resolution (∼0 15). From this data set, it is revealed that NGC 5728 contains a strong, spatially and spectrally resolved, wind. [Si VI] and Brγ line emission maps from SINFONI (Figure 7) show the wind structure stretching from the SE to NW of the nucleus, which matches the location and position angle of ionization cone seen in previous Hubble Space Telescope narrowband Hα+[N II] and [O III] imaging (Wilson et al. 1993). The SE half is. We thank the anonymous referee for helpful and constructive comments that significantly improved the quality of the paper. C.R. acknowledges financial support from the CONICYTChile grants FONDECYT 1141218 and Basal-CATA PFB-06/2007, and from the China-CONICYT fund. K.O. and K.S. acknowledge support from the Swiss National Science Foundation (SNSF) through Project grants 200021 157021. M.K. acknowledges support from the SNSF through the Ambizione fellowship grant PZ00P2 154799/1 and SNSF grant PP00P2 138979/1. K.S. acknowledges support from Swiss National Science Foundation Grants PP00P2_138979 and PP00P2_166159. Software: astropy (Astropy Collaboration et al. 2013), pandas (McKinney 2010),matplotlib (Hunter 2007),numpy (Van Der Walt et al. 2011),scipy (Jones et al. 2001).. Figure 7. Top:[Si VI] 1.96 μm line flux, velocity, and velocity dispersion (left, middle, right panels) maps from VLT/SINFONI for NGC 5728. The biconical structure and high velocity strongly indicate and AGN-driven wind. Bottom:same as above but for the Brγ hydrogen recombination line at 2.16 μm. Brγ shows the same geometry and velocity field as the higher ionization [Si VI] line emission. North is up and east is to the left in all panels.. 8.
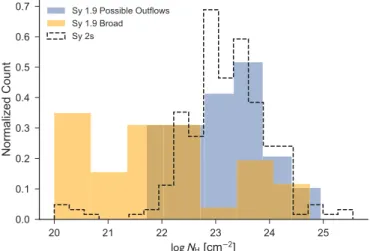
(9) The Astrophysical Journal, 856:154 (11pp), 2018 April 1. Shimizu et al.. Figure 8. Left panel:X-Shooter [O III]λ5007 emission profile for NGC 5728 (top; black) together with the best-fit model (purple) containing four Gaussian components. Two components each were used for the blueshifted emission (blue dashed) and redshifted emission (red dashed). The green line displays the residuals after subtracting the best fit. Right panel:X-Shooter Hα+[N II] emission profile for NGC 5728 (top; black) together with the best-fit model (purple). For each emission line, we included the same four Gaussian components that were needed for [O III] λ5007 (dashed lines) and an extra systemic component (solid lines). The green line again displays the residuals. The x-axis indicates the velocity for the Hα emission.. both the [O III] λ4959 and [O III] λ5007, fixing the line ratio to the theoretical value of 2.98. The final fit and residuals were inspected to determine whether there was evidence or not for an additional BLR component. In Figure 9, we show examples for a source with no evidence for a BLR component (top row) and strong evidence for a BLR component. Out of 57 Sy 1.9s in our sample, we find that 32 show strong evidence for a broad Hα component, 6 show weak evidence, and 18 show no evidence. For one source (BASS ID 929), we were not able to perform this analysis because [O III]λ5007 is not detected. This indicates that up to 30% of Sy 1.9s could in reality be Sy 2s with a strong outflow. Figure 10 plots the NH distribution for the Sy 1.9s with no evidence of a BLR component (blue shading) along with the remaining NH distribution for those with strong and weak evidence (orange shading). We also show the Sy 2 NH distribution from Figure 1 (dashed line) that matches well the distribution for Sy 1.9s with no BLR component. A K–S test on the two distributions indicates a 92% probability for the null hypothesis that they are drawn from the same parent NH population. In no way do we suggest that this analysis is conclusive and all 18 of the Sy 1.9s with no evidence of an underlying broad component have an outflow. Rather, with only moderate spectral resolution, it is possible to explain the Hα+[N II] profile for them using only components present in the [O III] λ5007 profile and an additional systemic component. Without at least higher spectral resolution data, we cannot make a conclusive statement for these objects. However, because the possibility remains that the broad Hα component does not originate in the BLR, we choose to remove these 18 AGNs from the rest of the analysis. The BASS collaboration is currently in the process of observing 75 BASS AGNs with. redshifted, while the NW half is blueshifted with each reaching up to a projected velocity of 400 km s−1. The similarity in the flux and velocity maps of [Si VI] and Brγ indicate that the same process is driving the line emission for both species, likely AGN photoionization given the high ionization potential to produce [Si VI] (167 eV). Both the redshifted and blueshifted components of the outflow are seen in the X-Shooter spectrum as well. Figure 8 shows the [O III] λ5007, and Hα+[N II] spectral regions. We first fit the [O III] λ5007 profile with four Gaussian components that reproduce the blueshifted broad bump and narrow peak and the redshifted narrow peak and wing. The velocities and velocity dispersion of these components are (v, sv ) = (-250 km s-1, 145km s-1) and (-207 km s-1, 24 km s-1) for the broad and narrow blueshifted components, respectively, and (196 km s-1, 89 km s-1) and (393 km s-1, 215 km s-1) for the redshifted narrow and wing components respectively. Using only these four components with fixed velocity and dispersion plus a 0kms−1 velocity component with fixed velocity to account for a galactic disk component and fixing the line ratio of the [N II] to its theoretical value of 2.98, we can reliably reproduce the very complex Hα +[N II] profile without the addition of any broad Hα component. This indicates that NGC 5728 is in fact a Sy 2 with a strong ionized gas outflow, consistent with the high X-ray absorption. Our analysis of NGC 5728 led us to reevaluate the remaining BASS Sy 1.9s for the possibility that their broad Hα components are actually part of an outflow. We repeated the methodology we used for NGC 5728, fitting the [O III] profile with up to three Gaussian components, then fixing the velocity and velocity dispersions of these components to fit the Hα +[N II] complex, while also adding a systemic component. Because of the lower spectral resolution, we simultaneously fit. 9.
(10) The Astrophysical Journal, 856:154 (11pp), 2018 April 1. Shimizu et al.. Figure 9. Example reanalysis for the [O III] and Hα+[N II] profiles of the Sy 1.9s. Top row shows the reanalysis of BASS 670 for which we were able to fit the Hα +[N II] complex using the [O III] Gaussian components plus an additional systemic component, thus indicating no compelling evidence for a BLR contribution to Hα. The fit of the [O III] doublet is shown in the left panel with the data in black, separate components in blue and red, and the total model in purple. The right panel shows the fit to the Hα+[N II] complex with the combined [O III] model shown by dashed blue, orange, and red lines and the additional systemic component as solid lines of the same color. The black and purple lines show the data and total fit, respectively. The bottom row is the same as above except for BASS 1161 for which there is strong evidence for the presence of a broad Hα component.. 10.
(11) The Astrophysical Journal, 856:154 (11pp), 2018 April 1. Shimizu et al. Burtscher, L., Davies, R. I., Graciá-Carpio, J., et al. 2016, A&A, 586, A28 Davies, R. I., Burtscher, L., Rosario, D., et al. 2015, ApJ, 806, 127 Dong, X., Wang, T., Wang, J., et al. 2008, MNRAS, 383, 581 Draine, B. T. 2011, Physics of the Interstellar and Intergalactic Medium (Princeton, NJ: Princeton Univ. Press) Elitzur, M., Ho, L. C., & Trump, J. R. 2014, MNRAS, 438, 3340 Foreman-Mackey, D., Hogg, D. W., Lang, D., & Goodman, J. 2013, PASP, 125, 306 Garcet, O., Gandhi, P., Gosset, E., et al. 2007, A&A, 474, 473 Gehrels, N. 1986, ApJ, 303, 336 Gehrels, N., Chincarini, G., Giommi, P., et al. 2004, ApJ, 611, 1005 Haardt, F., Maraschi, L., & Ghisellini, G. 1994, ApJL, 432, L95 Halpern, J. P. 1984, ApJ, 281, 90 Hönig, S. F., & Kishimoto, M. 2010, A&A, 523, A27 Hunter, J. D. 2007, CSE, 9, 90 Jones, E., Oliphant, T., Peterson, P., et al. 2001, SciPy: Open Source Scientific Tools for Python Korista, K. T., & Goad, M. R. 2004, ApJ, 606, 749 Koss, M., Trakhtenbrot, B., Ricci, C., et al. 2017, arXiv:1707.08123 Koss, M. J., Assef, R., Baloković, M., et al. 2016, ApJ, 825, 85 La Mura, G., Popović, L. Č., Ciroi, S., Rafanelli, P., & Ilić, D. 2007, ApJ, 671, 104 Laha, S., Guainazzi, M., Dewangan, G. C., Chakravorty, S., & Kembhavi, A. K. 2014, MNRAS, 441, 2613 Mainieri, V., Hasinger, G., Cappelluti, N., et al. 2007, ApJS, 172, 368 Malizia, A., Bassani, L., Bazzano, A., et al. 2012, MNRAS, 426, 1750 Markowitz, A. G., Krumpe, M., & Nikutta, R. 2014, MNRAS, 439, 1403 Massaro, E., Giommi, P., Leto, C., et al. 2009, A&A, 495, 691 McKinney, W. 2010, in Proc. 9th Python in Science Conf., ed. S. van der Walt & J. Millman, 51 Merloni, A., Bongiorno, A., Brusa, M., et al. 2014, MNRAS, 437, 3550 Mor, R., & Netzer, H. 2012, MNRAS, 420, 526 Nenkova, M., Sirocky, M. M., Nikutta, R., Ivezić, Ž, & Elitzur, M. 2008, ApJ, 685, 160 Netzer, H. 2015, ARA&A, 53, 365 Nikutta, R., Elitzur, M., & Lacy, M. 2009, ApJ, 707, 1550 Page, M. J., Loaring, N. S., Dwelly, T., et al. 2006, MNRAS, 369, 156 Panessa, F., & Bassani, L. 2002, A&A, 394, 435 Perola, G. C., Puccetti, S., Fiore, F., et al. 2004, A&A, 421, 491 Reynolds, C. S., Ward, M. J., Fabian, A. C., & Celotti, A. 1997, MNRAS, 291, 403 Ricci, C., Ueda, Y., Koss, M. J., et al. 2015, ApJL, 815, L13 Ricci, C., Trakhtenbrot, B., Koss, M. J., et al. 2017a, arXiv:1709.03989 Ricci, C., Trakhtenbrot, B., Koss, M. J., et al. 2017b, Natur, 549, 488 Risaliti, G., Maiolino, R., & Salvati, M. 1999, ApJ, 522, 157 Schnorr-Müller, A., Davies, R. I., Korista, K. T., et al. 2016, MNRAS, 462, 3570 Smith, D. A., & Done, C. 1996, MNRAS, 280, 355 Stern, J., & Laor, A. 2012, MNRAS, 423, 600 Tajer, M., Polletta, M., Chiappetti, L., et al. 2007, A&A, 467, 73 Tozzi, P., Gilli, R., Mainieri, V., et al. 2006, A&A, 451, 457 Trippe, M. L., Crenshaw, D. M., Deo, R. P., et al. 2010, ApJ, 725, 1749 Turner, T. J., George, I. M., Nandra, K., & Mushotzky, R. F. 1997, ApJS, 113, 23 Urry, C. M., & Padovani, P. 1995, PASP, 107, 803 Van Der Walt, S., Colbert, S. C., & Varoquaux, G. 2011, CSE, 13, 22 Vasudevan, R. V., & Fabian, A. C. 2007, MNRAS, 381, 1235 Ward, M. J., Done, C., Fabian, A. C., Tennant, A. F., & Shafer, R. A. 1988, ApJ, 324, 767 Wild, V., Charlot, S., Brinchmann, J., et al. 2011, MNRAS, 417, 1760 Wilson, A. S., Braatz, J. A., Heckman, T. M., Krolik, J. H., & Miley, G. K. 1993, ApJL, 419, L61 Winkler, H. 1992, MNRAS, 257, 677 Winter, L. M., Veilleux, S., McKernan, B., & Kallman, T. R. 2012, ApJ, 745, 107. Figure 10. NH distribution for Sy 1.9s that are possibly hosting outflows instead of a broad Hα component (blue shaded histogram) compared to the NH distribution for the remaining Sy 1.9s with evidence for a broad component (orange shaded histogram). The black dashed line indicates the NH distribution for Sy 2s as shown in Figure 1. VLT/X-Shooter and the incidence of outflows will be discussed in future surveys. ORCID iDs T. Taro Shimizu https://orcid.org/0000-0002-2125-4670 Michael Koss https://orcid.org/0000-0002-7998-9581 Claudio Ricci https://orcid.org/0000-0001-5231-2645 Isabella Lamperti https://orcid.org/0000-0003-3336-5498 Kyuseok Oh https://orcid.org/0000-0002-5037-951X Kevin Schawinski https://orcid.org/0000-0001-5464-0888 Benny Trakhtenbrot https://orcid.org/0000-00023683-7297 Reinhard Genzel https://orcid.org/0000-0002-2767-9653 Dieter Lutz https://orcid.org/0000-0003-0291-9582 David Rosario https://orcid.org/0000-0002-0001-3587 Eckhard Sturm https://orcid.org/0000-0002-0018-3666 Linda Tacconi https://orcid.org/0000-0002-1485-9401 References Alonso-Herrero, A., Quillen, A. C., Rieke, G. H., Ivanov, V. D., & Efstathiou, A. 2003, AJ, 126, 81 Antonucci, R. 1993, ARA&A, 31, 473 Antonucci, R. 2012, A&AT, 27, 557 Astropy Collaboration, Robitaille, T. P., Tollerud, E. J., et al. 2013, A&A, 558, A33 Baron, D., Stern, J., Poznanski, D., & Netzer, H. 2016, ApJ, 832, 8 Barthelmy, S. D., Barbier, L. M., Cummings, J. R., et al. 2005, SSRv, 120, 143 Baumgartner, W. H., Tueller, J., Markwardt, C. B., et al. 2013, ApJS, 207, 19 Blustin, A. J., Page, M. J., Fuerst, S. V., Branduardi-Raymont, G., & Ashton, C. E. 2005, A&A, 431, 111. 11.
(12)
Figure


+5
![Figure 7. Top: [Si VI ] 1.96 μm line flux, velocity, and velocity dispersion (left, middle, right panels) maps from VLT/SINFONI for NGC 5728](https://thumb-us.123doks.com/thumbv2/123dok_es/7319841.451789/8.918.69.852.576.1046/figure-flux-velocity-velocity-dispersion-middle-panels-sinfoni.webp)
![Figure 8 shows the [O III ] λ5007, and Hα+[N II ] spectral regions. We first fit the [O III ] λ5007 profile with four Gaussian components that reproduce the blueshifted broad bump and narrow peak and the redshifted narrow peak and wing](https://thumb-us.123doks.com/thumbv2/123dok_es/7319841.451789/9.918.88.827.82.444/figure-spectral-profile-gaussian-components-reproduce-blueshifted-redshifted.webp)
![Figure 9. Example reanalysis for the [O III ] and Hα+[N II ] profiles of the Sy 1.9s. Top row shows the reanalysis of BASS 670 for which we were able to fit the Hα +[N II ] complex using the [O III ] Gaussian components plus an additional systemic component,](https://thumb-us.123doks.com/thumbv2/123dok_es/7319841.451789/10.918.94.832.75.808/example-reanalysis-profiles-reanalysis-gaussian-components-additional-component.webp)
Documento similar
To test our expectation that the purity of single-photon generation under photon blockade can be improved by detuning the QD and cavity resonances, we measured g ð2Þ ð0Þ from the
We present photometry in U, B, V, R and I continuum bands and in Hα and Hβ emission lines for a sample of 336 circumnuclear star forming regions (CNSFR) located in early type
Our aim was to evaluate the relationship between pharmacokinetics and safety profile of aripiprazole, and also, to study its influence on the electrocardiogram and the
The main goal of our work is to provide easy-to-use mechanisms for customizing dynamic web pages. To achieve this, a methodical approach for generating and
Since our main purpose here is to test the unintegrated gluon density from the HERA fit [14, 15] and to compare it to theoretical predictions from collinear factorization at small x,
We have then examined the performance of an approach for gene selection using random forest, and compared it to alternative approaches. Our results, using both simulated and
(Notice that A is of Kleinian type if and only if every simple quotient of A is of Kleinian type.) Then we use this characterization and results from [8] to characterize the
The relationship between the coverage obtained using IS-seq (reads per RFLP band) and the difference be- tween observed and expected sites showed that our method was prone to
