Evaluation of sedum species as potential drivers for plant microbial fuel cells in green roof of a semi arid environment
58
0
0
Texto completo
(2) PONTIFICIA UNIVERSIDAD CATOLICA DE CHILE ESCUELA DE INGENIERIA. EVALUATION OF SEDUM SPECIES AS POTENTIAL DRIVERS FOR PLANT MICROBIAL FUEL CELLS IN GREEN ROOF OF A SEMI-ARID ENVIRONMENT. NATALIA F. TAPIA FLORES. Members of the Committee: IGNACIO VARGAS CARLOS BONILLA CLAUDIA ROJAS CESAR SAEZ. Thesis submitted to the Office of Research and Graduate Studies in partial fulfillment of the requirements for the Degree of Master of Science in Engineering Santiago de Chile, (January, 2016). ii.
(3) To my parents and brother, for giving me strength to chase my goals. iii.
(4) ACKNOWLEDGEMENT Firstly, I would like to thank to my family: my parents for their love and continuous support, both spiritually and materially, without you, this would not have been possible. To my brother by help and encourage me during this time. And all who, directly or indirectly have help me in this long road.. I would express my sincere gratitude to my advisor Prof. Ignacio Vargas, for his support and patience, for motivating me to accomplish this MSc. thesis that result in a rewarding experience. His guidance helped me in my research and the writing process of this thesis document. To Vargas’s research group for providing a friendly atmosphere and also useful feedback on my work.. Also, I would like to thank the rest of my thesis committee: Prof. Carlos Bonilla, Prof. César Sáez and Doctor Claudia Rojas, for their comments and their interest on my work.. Besides, I take this opportunity to express gratitude to laboratory members: Fernanda Carrasco and Mauricio Medel for their help. Also, give them thank to Prof. Pablo Pastén, Prof. Eduardo Agosín, Camilo Conrado and Angela Contreras for their help in the exudate analysis.. Thanks, to the Centro de Desarrollo Urbano Sustentable (CEDEUS), in which I want to give special thanks to the team of Prof. Sergio Vera, to provide the Laboratorio de Infraestructura Vegetal (LIVE) and encourage them in this work.. This research has received funding from the National Fund for Science and Technology (FONDECYT, No. 11110112) and the fund financing of research in priority areas (FONDAP, No. 15110020) of Chile.. iv.
(5) TABLE OF CONTENTS Pág. DEDICATION ............................................................................................................. ii Acknowledgement....................................................................................................... iv List of tables ............................................................................................................... vii List of illustrations .................................................................................................... viii RESUMEN................................................................................................................... x ABSTRACT ................................................................................................................ xi 1.. Background ......................................................................................................... 1 1.1 Bioelectrochemical systems ....................................................................... 1 1.2 Application in green roofs .......................................................................... 2 1.3 Hypotheses and objectives ......................................................................... 4 1.3.1 Hypotheses ....................................................................................... 4 1.3.2 General objective ............................................................................. 4 1.3.3 Specific objectives ........................................................................... 4. 2.. Evaluation of sedum spp. as potential drivers of plant microbial fuel cells in green roof of semiarid environments ............................................................................ 5 2.1 Introduction ................................................................................................ 5 2.2 Materials and methods ............................................................................... 8 2.2.1. Plant microbial fuel cells construction and startup operation .......... 8 2.2.2. PMFCs performance over evaluation period ................................. 10 2.2.3. Plant root exudate analysis ............................................................ 10 2.2.4. DNA extraction and pyrosequencing............................................. 11 2.2.5. Processing and analysis of pyrosequence data .............................. 13 2.2.6. Statistical analysis .......................................................................... 14 2.3 Results and discussion.............................................................................. 15 2.3.1. PMFCs performance ...................................................................... 15 2.3.2. Analysis of root exudates............................................................... 18.
(6) 2.3.3. Analysis of microbial community ................................................. 20 2.3.3.1. Bacterial community composition ......................................... 20 2.3.3.2. Diversity analysis .................................................................. 23 3.. Plant Microbial Fuel Cells as alternative for improve the sustainability of green roof in semi-arid climate ................................................................................... 26 3.1 Introduction .............................................................................................. 26 3.2 Materials and methods ............................................................................. 28 3.2.1. Plant microbial fuel cells construction .......................................... 28 3.2.2. Operation ....................................................................................... 29 3.2.3. Chemical analysis .......................................................................... 30 3.3 Results and discussion.............................................................................. 31 3.3.1. PMFCs performance ...................................................................... 31 3.3.2. Power density and polarization curve ............................................ 34 3.3.3. Water content and current density ................................................. 36. References .................................................................................................................. 42 A p p e n d i c e s ........................................................................................................ 46 Appendix A : Location of green roof of the campus san joaquin .............................. 47.
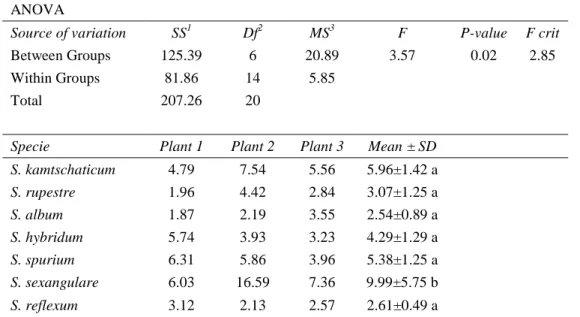
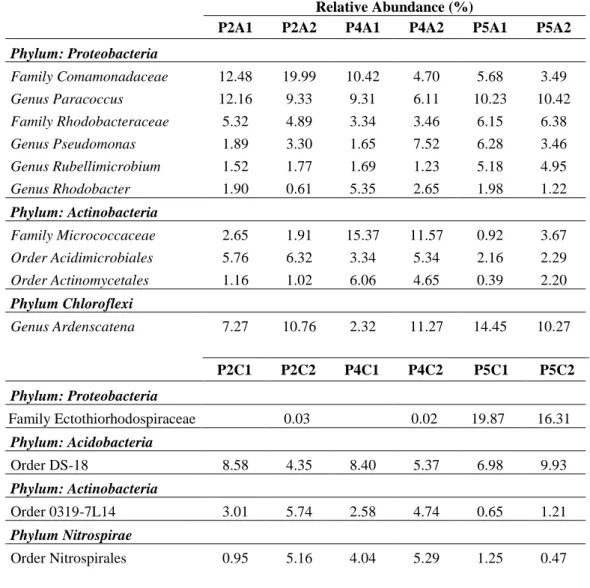
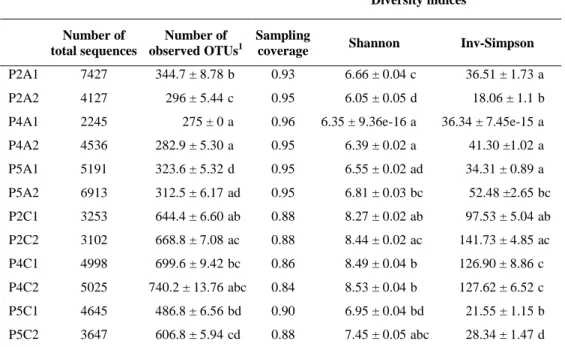
(7) LIST OF TABLES Pág. Table 2-1: Physical and chemical properties of the plant growth substrate ................. 8 Table 2-2: Total Organic Carbon in the root exudate of 21 plants from the seven Sedum species. At the bottom, the results of the analysis of variance are shown. ........ 19 Table 2-3: Relative abundances of the main bacterial taxonomic groups at genus or higher taxa levels in the samples of the upper (A1, A2) and lower (C1,C2) electrodes of the three Sedum species: S. rupestre (P2), S. hybridum (P4) and S. spurium (P5). ..................................................................................................... 23 Table 2-4: The alpha diversity in the upper (A1, A2) and lower (C1, C2) electrodes corresponding to S. rupestre (P2), S. hybridum (P4) and S. spurium (P5). The observed OTUs, the sample coverage and the Shannon and inverse Simpson diversity indices were calculated from the normalized datasets (2245 sequences per each sample). The bacterial OTUs were generated at 97% sequence similarity.24 Table 3-1: Electric conductivity, pH and anions concentration in leachate of three samples of the substrate of the Laboratorio de Infraestructura Vegetal (LIVE) finished the time operation of the PMFC reactors. ............................................ 32. vii.
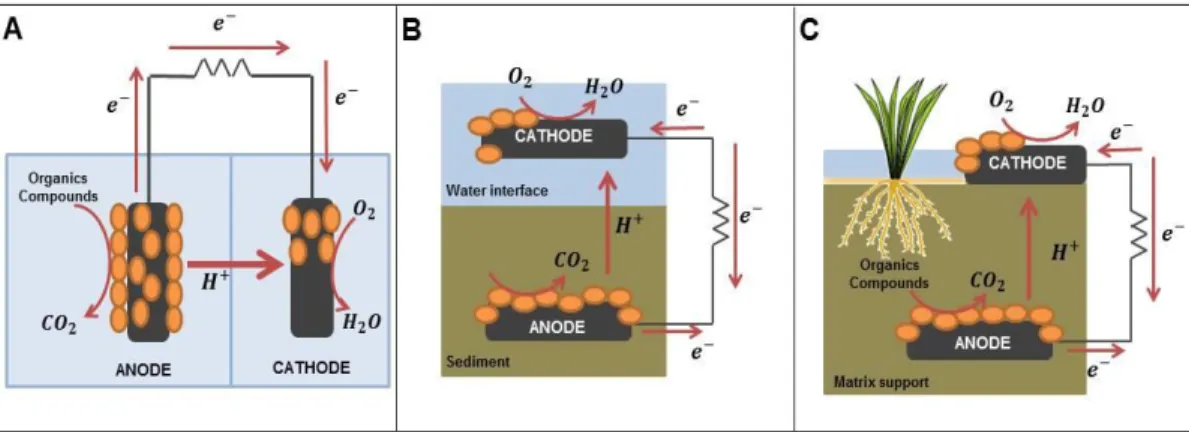
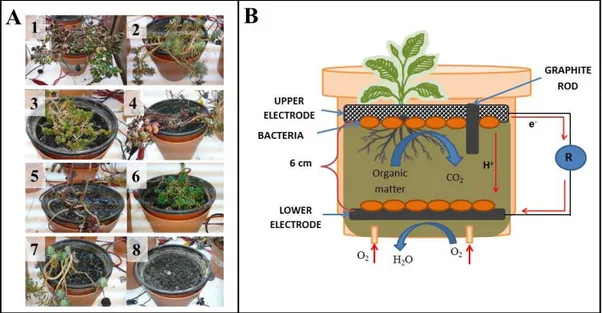
(8) LIST OF ILLUSTRATIONS Pág. Figure 1-1: Diagram of each type of bioelectrochemical system. A: Microbial Fuel Cell. B: Sediment Microbial Fuel Cell. C: Plant Microbial Fuel Cell. ....................... 2 Figure 2-1: A: The PMFC Reactors with each of the seven Sedum species used in the experiment: (1) S. kamtschaticum, (2) S. rupestre, (3) S. album, (4) S. hybridum, (5) S. spurium, (6) S. sexangulare, (7) S. reflexum, and (8) control (no plant) B. Diagram of the PMFC reactor configuration during operation. .......................... 9 Figure 2-2: Polarization curves (A) and power curves (B) showed that the highest power output corresponded to S. hybridum. ................................................................. 16 Figure 2-3: P-MFCs performance over time. Upper panels: Evaluation with distinct irrigation regimes: drip irrigation (left) (days 99 to 110) and weekly irrigation (right) (days 235 to 246). Bottom panels: Observed effect of temperature on the daily average of current density produced at 20±2°C (left) and 32±2°C (right) of three selected Sedum species and the control are shown. .................................. 18 Figure 2-4: Relative abundances of bacterial taxonomic groups in the samples of the upper (A1, A2) and lower (C1, C2) electrodes of three Sedum species: S. rupestre (P2), S. hybridum (P4) and S. spurium (P5). The taxonomic classification of the bacterial reads at phylum level is shown. The bacterial groups not accounting for at least 1% in at least one sample are assigned as “others”. .................................. 22 Figure 2-5: Beta diversity of the microbial community between samples based on the PCoA implemented in QIIME. Squares represent the upper electrode samples (A1, A2) and the circle represents the lower electrode samples (C1, C2) of the three Sedum species: S. rupestre (P2, green), S. hybridum (P4, red) and S. spurium (P5, blue). 25 Figure 3-1: Experimental setup at the Laboratorio de Infraestructura Vegetal (LIVE) in Campus San Joaquin, Pontificia Universidad Católica of Chile (A). Diagram and photography of the PMFC reactor configuration installed in the LIVE (B). .... 29 Figure 3-2: Performance reactors located in LIVE between day 310 to 313 (A) together with the radiation (B) and water content in the substrate (C) in the same time period. 33 viii.
(9) Figure 3-3: Power curve (A) together with temperature (B) and water content (C) of the substrate at the moment of to realize the curves, are shown. ............................ 35 Figure 3-4: Relationship between current production and water content. (A) Current density of the three Sedum species and under controlled temperature conditions, in which cycles related with irrigation can be seen. On the right: Water content and current density during 14 days of two Sedum species: S. hybridum (B) and S. rupestre (C). A decrease in voltage and water content was observed. .............. 37 Figure 3-5: Current density in the PMFC reactors between days 105 to 190, when irrigation was supplied by sprinklers (A). Current density of the reactors and water content in the substrate between days 245 to 280 are shown (B). An increase in both variables due to rainfall is observed. ......................................................... 37 Figure 3-6: Current density (A) and Water content in the substrate (B) of three reactors located in LIVE during eight days. An increase in both variables due to rainfall is shown. 38 Figure 3-7: Analysis of correlation between current density and water content for the dates showed in the Figure 3-6 of the three reactors: PMFC 1 (A), PMFC 2 (B) and PMFC 3 (C). ...................................................................................................... 39. ix.
(10) RESUMEN. Plant microbial fuel cells (PMFCs) son sistemas bioelectroquímicos que utilizan los exudados de las raíces para transformar la energía química en energía eléctrica. PMFCs pueden ser desarrollados en sitios como humedales y cubiertas vegetales. Sin embargo, a diferencia de los humedales, las cubiertas vegetales permiten implementar estos sistemas en una mayor variedad de lugares. Los beneficios que poseen las cubiertas vegetales, tales como la reducción de los caudales de escorrentía, el mejoramiento de la calidad del aire, el incremento de la biodiversidad, entre otros, ha expandido esta tecnología a regiones distintas para las que fueron concebidas inicialmente. Por ende, en climas semiáridos donde la temperatura y las condiciones de agua son diferentes, especies distintas de plantas son requeridas. Entre las primeras plantas probadas en cubiertas vegetales de regiones semiáridas, se encuentra Sedum spp., plantas suculentas caracterizadas por su bajo requerimiento hídrico y resistencia a la sequía. Por lo tanto, Sedum emerge como un interesante candidato para ser usado en PMFC, permitiendo su implementación en cubiertas vegetales construidas en climas semiáridos. Este estudio muestra que Sedum es un tipo de vegetación factible de utilizar en PMFCs. Entre las especies evaluadas, S. hybridum mostró la más alta densidad de potencia (92 μW m-2) -2. seguida por S. rupestre (15.5 μW m ), mientras que S. spurium presentó el peor funcionamiento. La pirosecuenciación utilizada para caracterizar la comunidad microbiana desarrollada en los electrodos de tres reactores seleccionados, reveló que miembros de la familia Micrococcaceae predominan en el ánodo de S. hybridum. En contraste, miembros de la familia Comamonadaceae, seguida por el género Paracoccus y Ardenscatena, fueron los principales grupos observados en los ánodos de S. rupestre y S. spurium. El análisis microbiano sugiere que la implementación de PMFCs podría no alterar la microbiota del suelo. Finalmente, la relación observada entre contenido de agua en el suelo y el voltaje generado, tanto en los experimentos en el laboratorio como en el laboratorio de cubiertas vegetales, podría ser útil para expandir esta tecnología y desarrollar bio-sensores de bajo costo para monitorear la irrigación en ambientes semiáridos.. Palabras Claves: Cubiertas vegetales, Plant Microbial Fuel Cells, Pirosecuencia, Plantas suculentas. x.
(11) ABSTRACT. Plant microbial fuel cells (PMFC) are bioelectrochemical systems (BESs) that use plant root exudates to transform chemical into electrical energy. The PMFCs can be developed at sites such as wetlands and green roofs. However, unlike the wetlands, green roofs offer the opportunity to implement these systems in a wider variety of places. Green roof benefits such as runoff reduction, improvement of air quality, increase in biodiversity, among others, have expanded this technology to regions other than they were initially conceived. In semiarid climate where temperature regimes and water conditions are different, distinct plant species are required. Among pioneer plants tested in green roof constructed in semiarid regions are Sedum spp. These species are succulent plants characterized by their low water requirements and drought tolerance. Hence, Sedum emerges as an interesting candidate to be used in the PMFC, expanding the range of application of PMFC technology and allowing for the implementation of PMFCs in a green roof constructed in a semi-arid climate. This study showed that Sedum is feasible to use in a PMFC. Among seven Sedum species tested, S. hybridum showed the highest power density (92 μW m-2) followed by S. rupestre (15.5 μW m-2), while S. spurium presents the worst performance. Pyrosequencing used to characterize the microbial community developed on electrodes of selected Sedum PMFC reactors revealed that members of the family Micrococcaceae dominated the microbial community on the S. hybridum anode. In contrast, member of the Comamonadaceae family, followed by the Paracoccus and Ardenscatena genera, were the main taxa observed on the S. rupestre and S. spurium anodes. Microbial analysis suggests that the implementation of the PMFCs would not alter the soil microbiota. Finally, the observed relationship between the water content in the soil and the cell voltage, in experiments both in the laboratory and pilot scale green roof laboratory, could be useful for expanding this technology and developing low-cost biosensors to monitor irrigation in semiarid environments.. Keywords: Green roofs, Plant Microbial Fuel Cells, Pyrosequencing, Succulent plant. xi.
(12) 1. 1. BACKGROUND As the world population increases, the demand for resources such as water and. energy rises proportionately. Both resources are directly or indirectly connected, energy generation requires water, as well as energy is needed to treat and transport water to the population. For this reason, it is important to develop sustainable technologies that address this link between water and energy. In this context, bioelectrochemical systems (BESs) that use microorganisms to convert chemical energy into electricity arises as a potential solution to develop energy-efficient water treatment technologies and biosensors to monitor urban or natural environments. 1.1. Bioelectrochemical systems Bioelectrochemical systems, such as Microbial Fuel Cells (MFCs), use. electrochemically active bacteria (EAB) to catalyze reactions that occur in one or both electrodes generating electricity. In the anode, the oxidation of organic compounds generates protons and electrons that are transported to a second electrode (cathode) through the medium and an external circuit, respectively. In the cathode, reduction of the electron acceptor (usually oxygen) occurs. Although initially MFCs arose with the purpose of treating wastewater using low energy inputs, improvements in this technology have expanded these systems to other applications in the form of Sediment Microbial Fuel Cells (SMFCs) and Plant Microbial Fuel Cells (PMFCs) (Figure 1-1). SMFCs are devices that capture energy of organic compounds present in the sediment through the anode, while oxygen is reduced in the cathode located in.
(13) 2. superficial water column. The main limitation of these systems is the supply of organic matter that is only provided by the sediments, representing a nonrenewable source in time. In order to constantly provide organic matter to the system, PMFCs use a plant to supply organic compounds, called exudates, which are then released through their roots and consumed by EAB. Besides sustainability offered by this latter type of BES, due to constant input of substrate, the use of plants, without the need to harvest them (unlike other bioenergy from biomass) allows to consider its application in green urban areas such as green roofs.. Figure 1-1: Diagram of each type of bioelectrochemical system. A: Microbial Fuel Cell. B: Sediment Microbial Fuel Cell. C: Plant Microbial Fuel Cell.. 1.2. Application in green roofs In recent years, the construction of green roofs in buildings has increased. notably in the northern hemisphere, due to their benefits, such as: reduction of the.
(14) 3. island effect, decrease the air pollution, insulation of noise and heat, and reduction of storm water (Fioretti et al., 2010). A green roof able to generate bioenergy, besides the previously mentioned benefits, is an interesting idea. Due to this, a pilot experiment that combine electricity production from PMFCs with a green roof was developed at The Dutch Institute for Ecology in Wageningen (The Netherlands), using marsh species which grow under waterlogging conditions (Helder et al., 2013a). The increasing incorporation of green roofs in projects of commercial buildings, hospitals and houses, open an opportunity for implementing PMFCs in urban settlements. However, in countries with semiarid climates, as Chile, plants commonly used in the construction of green roof are drought tolerant species different to species used in published PMFC experiments. Consequently, the application of BES in green roofs developed in semiarid environments should consider the use of plant species typically used in its construction, such as Sedum. Plants in the Sedum genus are succulent species widely used on both northern and southern hemisphere due to their shallow rooting, cold and drought tolerance, making it ideal for survive in green roof installations..
(15) 4. 1.3. Hypotheses and objectives. 1.3.1. Hypotheses Sedum, a type of plants commonly used in the construction of green roofs,. could be used in bioelectrochemical systems supplying organic matter through its roots, to allow its application in green roof of semiarid environments. 1.3.2. General objective The objective of this thesis was to evaluate viability of Sedum in. bioelectrochemical systems, identifying potential applications of these systems in green roof of semiarid environments. 1.3.3 . Specific objectives To study viability of seven Sedum spp. in PMFC devices by the evaluation of their capacity to generate electricity.. . To analyze the total organic carbon in root exudates of seven Sedum species.. . To characterize the microbial community developed in electrodes of three representative reactors selected by performance.. . To study performance of these systems in a laboratory scale green roof (i.e. Laboratorio de Infraestructura Vegetal, LIVE at PUC)..
(16) 5. 2. EVALUATION OF SEDUM SPECIES AS POTENTIAL DRIVERS FOR PLANT MICROBIAL FUEL CELLS IN GREEN ROOF OF A SEMI-ARID ENVIRONMENT 2.1. Introduction Microbial fuel cells (MFCs) are bioelectrochemical systems that use. electrochemically active bacteria (EAB) to catalyze reactions at one or both electrodes (the anode and cathode). Initially, MFCs were conceived to transform chemical energy stored in wastewater into electricity. However, the progress achieved for this technology in recent years has expanded its potential applications (Cao et al., 2009; Logan, 2010). One example of it is the sediment- or soil-based microbial fuel cell (SMFC), which uses organic matter stored in sediments as a source of energy for EAB. This technology has been considered an innovative opportunity to provide power to electronic devices in remote locations, where it is difficult and expensive to replace batteries (Donovan et al., 2008). Nevertheless, the availability of organic matter represents a limitation for this technology during long-term operation. A sustainable alternative to supply organic matter to SMFC devices is the use of plants that can provide the fuel for these systems throughout photosynthesis. This type of technology has been named plant microbial fuel cells (PMFCs). In a PMFC, the plant generate organic compounds released through it roots (exudates), which are later used by EAB for power production (Helder et al., 2013a)..
(17) 6. The implementation of PMFCs has been mostly tested in water-saturated environments where the anode electrode is maintained under anoxic conditions and a better ion transport to the cathode electrode is provided (Chiranjeevi et al., 2012). Since 2008, when this technology emerged, mainly three plant species have been tested as part of PMFCs. These are Glyceria maxima (Strik et al., 2008; Timmers et al., 2012a; Timmers et al., 2013); Spartina anglica (Helder et al., 2010; Helder et al., 2013b) and Oryza sativa (Chen et al., 2012; De Schamphelaire et al., 2010; Kaku et al., 2008). These plants are capable to grow in flooded conditions due to their adapted tissue called aerenchyma, which enables them to carry oxygen to their roots under such environments (Ap Rees & Wilson, 1984; Justin & Armstrong, 1991; Maricle & Lee, 2002). Unlike other sources of energy generated from biomass, the PMFCs can be implemented at places such as wetlands and green roofs, even simultaneously with biomass production without reducing the availability of agricultural land (Strik et al., 2008). However, unlike wetlands, green roofs offer the opportunity to implement these systems in a wider variety of places.. Although green roofs have been used mainly in the northern hemisphere, benefits, such as reducing runoff, improving air quality and increasing biodiversity, among others, have expanded this technology to regions with different climates (Williams et al., 2010). The different temperatures and water conditions in semiarid climates limit the plant types that are used in green roofs and their construction. Because of this, succulent plants, capable of retaining water.
(18) 7. under such conditions are among the vegetation most frequently used in these environments. Among these, members in the Sedum genus have been previously used due to their low water requirements and drought tolerance. They are able to resist these conditions due to their adaptation to a special photosynthetic pathway, known as crassulacean acid metabolism (CAM), which allow them to retain their stomata closed during the day (to avoid water evaporation) and open them at night to fix carbon dioxide (VanWoert et al., 2005).. In this study we aimed to assess the feasibility of using Sedum plants in PMFCs constructed in the absence of water saturation, and thus the possibility to expand the range of application of MFC technologies to green roofs constructed in a semi-arid climate. We hypothesized that these plants would provide organic matter through their roots to be used by EABs in electrodes of constructed PMFCs. For this purpose, seven different species of Sedum were tested in their capability to generate electricity and organic exudates. Three representative PMFCs were further evaluated for the microbial community developed on anode and cathode electrodes. Our results provided initial insights into the use of Sedum plants..
(19) 8. 2.2. Materials and methods. 2.2.1 Plant microbial fuel cells construction and startup operation The plant microbial fuel cells (PMFCs) used in this study consisted of 450 mL plastic pots (with holes at the bottom to allow free drainage) filled with 400 mL of plant growth substrate. This growing media was collected in May 2013 from a green roof under construction (i.e., before the plants were established) on the Campus San Joaquín at the Pontificia Universidad Católica de Chile (PUC) in Santiago, Chile (Figure A.1). It was composited of a mineral matrix of sand, silt, and clay amended with organic matter (Table 2-1). Electrodes made of a circular graphite fiber felt of 92 mm in diameter and 6 mm thick (MudWatt, California, USA) were initially installed; one was buried at a depth of 7 cm and the other one was placed on the substrate surface. The buried electrodes were inoculated with mud from a pond used as a water supply for irrigation located at the same campus. Each PMFC reactor contained one of the seven Sedum species used in this study (S. album, S. hybridum, S. kamtschaticum, S. reflexum, S. rupestre, S. sexangulare and S. spurium) and one pot was left without a plant as a control (Fig. 2-1).. Table 2-1: Physical and chemical properties of the plant growth substrate. pH 7.38. Electric conductivity. Nitrogen. Phosphorous Olsen. Potassium. Clay. Silt. Sand. (mS cm-1). Organic Matter (%). (mg kg-1). (mg kg-1). (mg kg-1). (%). (%). (%). 2.52. 2.85. 16. 97. 1298. 13. 20. 67.
(20) 9. Figure 2-1: A: The PMFC Reactors with each of the seven Sedum species used in the experiment: (1) S. kamtschaticum, (2) S. rupestre, (3) S. album, (4) S. hybridum, (5) S. spurium, (6) S. sexangulare, (7) S. reflexum, and (8) control (no plant) B. Diagram of the PMFC reactor configuration during operation.. The reactors were operated during an initial startup period of 120 days for system adjustment. During this time, plant irrigation was performed weekly by adding variable volumes of tap water in the upper part of the reactor. From day 60 to day 110 a drip irrigation system was installed for continuous irrigation mode. The change in setup was done to evaluate the effect of continuous vs batch irrigation on current production. After 120 days, the upper graphite fiber felt electrodes were replaced with activated carbon granules (3 mm in diameter; 35 cm3 volume) and a graphite rod (as connection), for a better adhesion of electrode to the substrate. Titanium wires were used to connect the two electrodes to an external resistor of 1 kΩ (Figure 2-1)..
(21) 10. 2.2.2 PMFCs performance over evaluation period The PMFCs were maintained under controlled temperature conditions and continuously monitored over a period of 360 days (from December 2013 to December 2014). The average room temperature during this period was 20±2°C (except between days 260 and 350 when reactor was exposed to 32 ± 2°C). Light periods extended for 14 h per day, with an average radiation of 23 ± 2 W m-2, and they were measured every 10 min by a solar radiation sensor (Decagon®, Pullman, USA). Irrigation was performed weekly by adding a volume of tap water until saturation was reached.. Cell voltage was measured every 10 min with a data acquisition system (2700; Keithley, USA). Power and current densities were normalized by the area of the lower electrode (0.0067 m2), where the cathodic reaction occurred. The polarization curve and the power density curves were made by varying the external resistance from 10Ω to 100 kΩ every 30 min or until the system reached a stable voltage. Substrate water content, temperature and electrical conductivity were measured by a temperature, humidity and ground conductivity sensor GS3 (Decagon®, Pullman, USA).. 2.2.3 Plant root exudate analysis In August 2015, new plant seedlings (n=3) of each of the seven species tested in this study were obtained for root exudate measurements. The plants were.
(22) 11. weighed after the substrate particles were gently removed by manually shaking their roots. To further remove the substrate particles from the roots, they were rinsed with tap water and dipped into 30 mg L-1 of chloramphenicol for 2 h to minimize microbial growth (Subbarao et al., 1997). Roots were then washed again with tap water and sterile deionized water to remove the residual antibiotic. To collect exudates, plant roots were submerged in falcon tubes containing 50 mL of deionized water and then aseptically stored at 20°C for 48 h. Each tube was covered with aluminum foil to avoid light exposure. After this time, plants were removed and each of the exudate solutions was divided into two parts. One portion was acidified using 6 M HCl (pH~2.4) and maintained at 4°C previous to total organic carbon (TOC) measurements using a Shimadzu TOC-L CPH equipment (Shimadzu, Japan). The TOC contents of each solution normalized per plant biomass. The second half of the exudate solutions were stored for future analysis at -20°C in thymol granules to prevent bacterial degradation (Subbarao et al., 1997).. 2.2.4 DNA extraction and pyrosequencing The electrode samples for microbial community analysis were taken from the PMFCs with the highest, the second highest, and the lowest power density generation after 360 days of system operation. DNA extraction was performed using the Power Soil® DNA isolation kit (MoBio Laboratories, Inc., Carlsbad, CA) following the manufacturer’s instructions. Each of the selected PMFCs was dismantled under sterile conditions to obtain the electrode samples. The upper.
(23) 12. electrodes (anodes) were placed on sterile petri dishes from where pieces of graphite rod and granules were randomly selected to obtain duplicate samples of approximately 0.27 g for each of the three PMFCs examined. The cathode samples were aseptically sectioned to obtain eight small pieces (~0.1 g) of graphite fiber felt per reactor. These subsamples were slightly moistened using sterile deionized water, previous to DNA extraction to avoid excessive absorption of extraction solutions. DNA samples extracted from each of the small graphite felt fiber subsamples were randomly selected and poled together to obtain two composite DNA samples per cathode electrode. The DNA quality and concentration were determined using a NanoDrop 2000c Spectrophotometer (Thermo Fisher Scientific Inc.). All of the samples were stored at -80°C prior to the pyrosequencing analysis.. The pyrosequencing analysis was performed using a 454 Genome Sequencer FLX Titanium System (Roche Diagnostics, Indianapolis, IN, USA) at the Research and Testing Laboratory (Lubbock, Texas. USA). The amplicon library was prepared for each sample using a bacteria-specific primer set, 28F (5’GAGTTTGATCNTGGCTCAG -3’) and 519R (5’- GTNTTACNGCGGCKGCTG -3’) complementary to the regions V1-V3 of the 16S rRNA gene (Frank et al., 2013). The PCR reactions were performed in 25 μL reaction volumes with the Qiagen HotStar Taq master mix (Qiagen Inc., Valencia, California), 1 μL (5 μM) of each forward and reverse primer and 1 μL of the DNA extract. The reaction conditions consisted of an initial denaturation step at 95°C for 5 min followed by 35 cycles, each consisting of denaturation at 94°C for 30 s, primer annealing at.
(24) 13. 54°C for 40 s, and an extension at 72°C for 1 min with a final extension at 72°C for 10 min and a 4°C hold. After the PCR amplification, the products were visualized with eGels (Like Technologies, Grand Island, New York). The amplicons were then pooled equimolar, and each pool was cleaned and selected for sizes using Agencourt AMPure XP (BeckmanCoulter, Indianapolis, Indiana) as directed by the Roche 454 protocols (454 Life Sciences, Branford, Connecticut). The selected pools were then quantified and diluted for use in the emPCR reactions. These reactions were performed and subsequently enriched following the established manufacturer’s protocols (454 Life Sciences).. 2.2.5 Processing and analysis of pyrosequence data The sequences obtained in this study have been deposited into the NCBI Sequence Read Archive (SRA) with the accession No. SRP062553. The raw sequences were processed and analyzed using the Quantitative Insights Into Microbial Ecology (QIIME) program (Caporaso et al., 2010b) through the MacQIIME version 1.8.0. The sequences were denoised by removing the reads that did not match to barcodes or primers, had homopolymers longer than 6 bp. and quality scores lower than 25 (Quince et al., 2011). Only those filtered sequences between 200 bp and 1000 bp in length were included for further analysis. The sequences were then assigned to operational taxonomic units (OTUs) at 97% similarity using the de novo OTU picking protocol with usearch to additionally identify and remove singletons and chimeras (Edgar, 2010; Edgar et al., 2011). A.
(25) 14. representative sequence for each OTU was selected for downstream analysis. Taxonomic assignment was done using the uclust method and the Greengenes taxonomy database (DeSantis et al., 2006; McDonald et al., 2012) released on August 2013 (13.8 v) at a 90% confidence threshold. The unassigned sequences, referring to those sequences that could not be classified at the domain level, and sequences classified as chloroplast and mitochondria, were removed from the dataset. Alignment was performed using PyNAST (Caporaso et al., 2010a) against the Greengenes core set (http://greengenes.lbl.gov/). The alignments were filtered to remove gap positions. Alpha diversity of the normalized dataset was analyzed by Good’s sample coverage, Shannon and inverse Simpson diversity indices. Beta diversity, based on phylogenetic information, was assessed by a Principal Coordinate analysis (PCoA) on unweighted UniFrac distances.. 2.2.6 Statistical analysis Differences between the Sedum species were tested with a one-way Analysis of Variance (ANOVA) and Tukey’s test using Microsoft Excel data analysis. Pvalues less than 0.05 were considered significant..
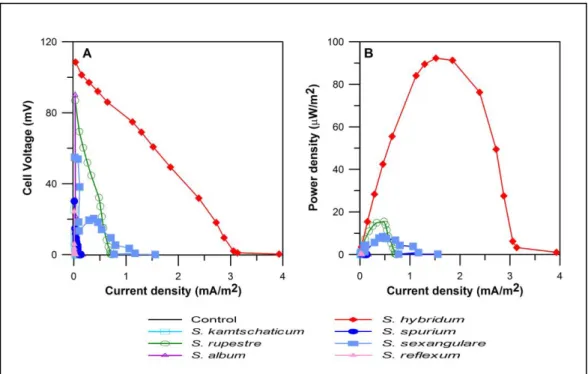
(26) 15. 2.3. Results and discussion. 2.3.1 PMFCs performance Over the period of 150 days of system operation the seven PMFCs reactors tested showed power generation, as opposed to the control reactor that ceased to produce recordable values (data not shown). This could have been due to the consumption by microorganisms of initial organic matter available in the substrate (2.85%). Hence, for the subsequent operation, the power obtained from the PMFC reactors was assumed to be mainly due to the chemical energy provided by the plant as exudates. Our results showed no dependency of current production on light periods, thus the circadian oscillation reported in previous studies (Helder et al., 2013b; Kaku et al., 2008) using S. anglica y O. sativa was not observed for the Sedum PMFCs tested under controlled laboratory conditions.. Power density curve (Figure 2-2B) indicates that S. hybridum displayed the best performance, reaching a maximum value of 92 μW m-2 followed by S. rupestre and S. sexangulare which presented 15.5 μW m-2 and. 8.4 μW m-2. respectively. The plants with the lowest performance were S. kamtschaticum, S. spurium and S. reflexum, with values lower than 1 μW m-2. S. album showed a power density of 2.4 μW m-2. These values are lower than those reported for other PMFCs, where the power densities reported vary from 6 to 222 mW m-2(Timmers et al., 2012c). However, those systems had completely different conditions compared to the reactors tested in this study, differing mainly by the water.
(27) 16. saturation conditions. When the environment is water-saturated, the water allows greater mobility for cation transport through the substrate, reducing internal reactor resistance and allowing a higher conductivity (Chiranjeevi et al., 2012). Thus, when the amount of water is reduced, the resistance is higher and negatively affects the power generated. Similarly, the amount of electrolytes present in the medium affects the conductivity, and therefore, when comparing saline and nonsaline systems, the first have higher power densities (Helder et al., 2010; Wetser et al., 2015).. Figure 2-2: Polarization curves (A) and power curves (B) showed that the highest power output corresponded to S. hybridum..
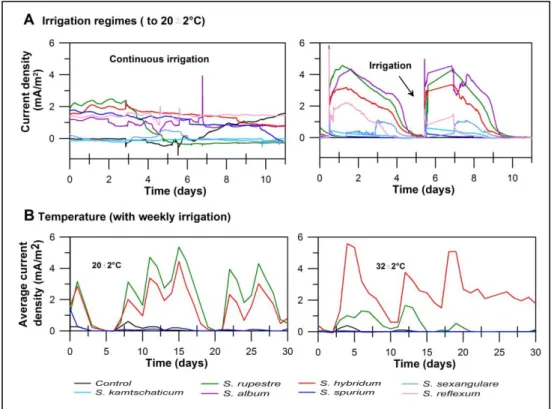
(28) 17. The internal resistance of the system can be estimated from the peak of the power curve (Figure 2-2B), and in the case of S. hybridum, the system has an internal resistance of 6 kΩ, while for S. rupestre and S. sexangulare the resistance is 10 kΩ. These values are higher than those reported previously (Timmers et al., 2012c), and thus, cation transport is more limited in this system.. The application of different irrigation regimes, drip irrigation and weekly irrigation, resulted in differences in current generation (Figure 2-3A). In the first case, relatively constant current values were observed, which in the second sudden increases of current were observed after irrigation. This suggests a tide relationship between power generation and soil moisture content, with higher power obtained at higher soil moisture.. When the plants with the highest (S. hybridum), medium (S. rupestre), and lowest performance (S. spurium) were compared at different temperatures, they showed dissimilar results. S. hybridum had higher current densities when the ambient temperature was 32±2°C, while the remaining species decreased power generation (Figure 2-3B).. Results on light and temperature could have important implications for onsite applications where water content in the soil decreases following increases in radiation and temperature. The results obtained with different irrigation regimes.
(29) 18. suggested that under unsaturated conditions, PMFCs could be used as water content indicators expanding the potential applications of these systems.. Figure 2-3: P-MFCs performance over time. Upper panels: Evaluation with distinct irrigation regimes: drip irrigation (left) (days 99 to 110) and weekly irrigation (right) (days 235 to 246). Bottom panels: Observed effect of temperature on the daily average of current density produced at 20±2°C (left) and 32±2°C (right) of three selected Sedum species and the control are shown.. 2.3.2 Analysis of root exudates The total organic carbon analysis of the root exudates obtained from the seven Sedum species tested in this study showed relatively low concentrations, ranging from 1.87 to 16.59 ppm g-1. Nevertheless, these values are similar to those.
(30) 19. reported in previous studies (Kaku et al., 2008) using O. sativa. Exudation process can be influenced by many factors, such as collection time, damage inflicted on the root, collection medium and temperature, among others (Pinton et al., 2007). In addition, due to the long time of collection of exudates, some easily degradable organic compounds could have been decomposed, causing the low values detected in our study.. Table 2-2: Total Organic Carbon in the root exudate of 21 plants from the seven Sedum species. At the bottom, the results of the analysis of variance are shown. Total Carbon Organic (ppm g-1) ANOVA SS1. Df2. MS3. F. P-value. F crit. 125.39. 6. 20.89. 3.57. 0.02. 2.85. Within Groups. 81.86. 14. 5.85. Total. 207.26. 20. Specie. Plant 1. Plant 2. Plant 3. Mean ± SD. S. kamtschaticum. 4.79. 7.54. 5.56. 5.96±1.42 a. S. rupestre. 1.96. 4.42. 2.84. 3.07±1.25 a. S. album. 1.87. 2.19. 3.55. 2.54±0.89 a. S. hybridum. 5.74. 3.93. 3.23. 4.29±1.29 a. S. spurium. 6.31. 5.86. 3.96. 5.38±1.25 a. S. sexangulare. 6.03. 16.59. 7.36. 9.99±5.75 b. S. reflexum. 3.12. 2.13. 2.57. 2.61±0.49 a. Source of variation Between Groups. 1. 2. 3. Sum of the squares, Degrees of freedom, Means square. Different letters indicate statistically significant differences (p<0.05) according to Tukey’s test.. Similar values were observed for almost all species tested; only S. sexangulare had a significantly higher concentration (9.99±5.75 ppm g-1) according to Tukey’s test (p<0.05) (Table 2-2). The TOC concentrations recorded.
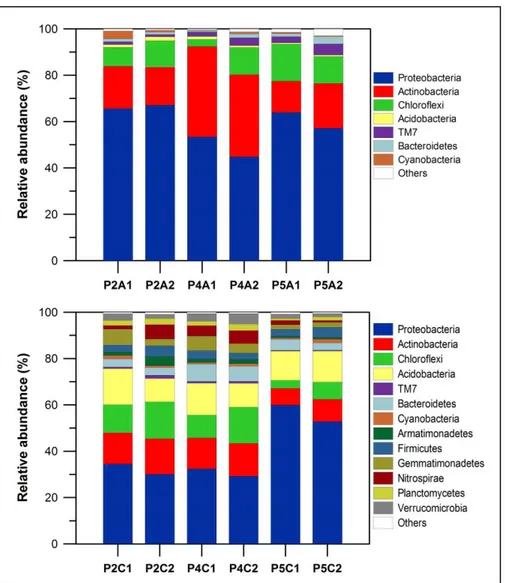
(31) 20. did not seem to have a direct positive effect on PMFCs performance, as the reactor resulting in the greatest current production (S. hybridum) did not necessarily achieved the highest TOC content (4.29±1.29 ppm g-1). It is likely that more than the total amount of carbon released by plant roots, the composition of these exudates could be more important for power generation as it has been reported that different organic compounds can be used by EAB with different efficiency (Chae et al., 2009).. 2.3.3 Analysis of microbial community 2.3.3.1 Bacterial community composition There were seven phyla detected in anode samples and thirteen phyla observed in cathode samples. The phylum Proteobacteria was the most abundant and ranged from 44.8% to 67.09% in the anode electrodes and 29.19% to 59.87% in the cathode electrodes. This group was followed by the phyla Actinobacteria (with 13.5% to 38.98% in the anodes and 7.26% to 15.38% in the cathodes) and Chloroflexi (with 3.07% to 16.03% in the anodes and 3.47% to 15.58% in the cathodes) (Figure 2-4). These phyla have already been reported in the PMFCs as the most abundant groups (Lu et al., 2015). One of the most commonly reported exoelectrogenic bacteria group, Geobacter spp., (De Schamphelaire et al., 2010; Timmers et al., 2012a) was not detected in our study (Table 2-3). Other members in the Micrococcaceae family were especially abundant in the anode of the S. hybridum. Among this group, the species Kocuria rhizophila has been reported as.
(32) 21. a bacterium capable of generating electricity from glucose oxidation (Luo et al., 2015). Their presence could explain the better performance of the reactor with S. hyridum; however, it is not possible to exclude the presence of unreported exoelectrogenic species. In the S. rupestre and S. spurium anodes, the family Comamonadaceae was among the most abundant group followed by the Paracoccus and Ardenscatena genera. It have been previously reported that these groups have a negative impact on power generation, in the presence of oxygen or nitrate, since they decrease the availability of compounds that could be used by EABs (Kawaichi et al., 2013; Timmers et al., 2012a; Zhang et al., 2014). This could explain the poor performance of reactors with S. rupestre and S. spurium.. The family Ectothiorhodospiraceae was the most abundant in the S. spurium cathode (P5C1-C2). This family, Natronocella acetinitrilica, a heterotrophic bacterium that may not be exoelectrogenic, was reported in the anode in previous studies with rice plants (Deng et al., 2012). However, for the other two cathodes (P2C1-C2 and P4C1-C2), the detected groups have not been previously observed in PMFC reactors. In addition to the previously mentioned groups, it was possible to observe important soil bacteria such as members in the phylum Nitrospirae, with reported nitrite-oxidation capabilities and members in the family Rhizobiaceae, that includes microorganisms able to fix (Maier & Pepper, 2009). Therefore, the presence of the electrode did not seem to affect mayor groups of soil microorganism participating in the N cycle..
(33) 22. Figure 2-4: Relative abundances of bacterial taxonomic groups in the samples of the upper (A1, A2) and lower (C1, C2) electrodes of three Sedum species: S. rupestre (P2), S. hybridum (P4) and S. spurium (P5). The taxonomic classification of the bacterial reads at phylum level is shown. The bacterial groups not accounting for at least 1% in at least one sample are assigned as “others”..
(34) 23. Table 2-3: Relative abundances of the main bacterial taxonomic groups at genus or higher taxa levels in the samples of the upper (A1, A2) and lower (C1,C2) electrodes of the three Sedum species: S. rupestre (P2), S. hybridum (P4) and S. spurium (P5).. P2A1. Relative Abundance (%) P2A2 P4A1 P4A2 P5A1. Family Comamonadaceae. 12.48. 19.99. 10.42. 4.70. 5.68. 3.49. Genus Paracoccus. 12.16. 9.33. 9.31. 6.11. 10.23. 10.42. Family Rhodobacteraceae. 5.32. 4.89. 3.34. 3.46. 6.15. 6.38. Genus Pseudomonas. 1.89. 3.30. 1.65. 7.52. 6.28. 3.46. Genus Rubellimicrobium. 1.52. 1.77. 1.69. 1.23. 5.18. 4.95. Genus Rhodobacter. 1.90. 0.61. 5.35. 2.65. 1.98. 1.22. Family Micrococcaceae. 2.65. 1.91. 15.37. 11.57. 0.92. 3.67. Order Acidimicrobiales. 5.76. 6.32. 3.34. 5.34. 2.16. 2.29. Order Actinomycetales. 1.16. 1.02. 6.06. 4.65. 0.39. 2.20. 7.27. 10.76. 2.32. 11.27. 14.45. 10.27. P2C1. P2C2. P4C1. P4C2. P5C1. P5C2. 0.02. 19.87. 16.31. P5A2. Phylum: Proteobacteria. Phylum: Actinobacteria. Phylum Chloroflexi Genus Ardenscatena. Phylum: Proteobacteria Family Ectothiorhodospiraceae. 0.03. Phylum: Acidobacteria Order DS-18. 8.58. 4.35. 8.40. 5.37. 6.98. 9.93. 3.01. 5.74. 2.58. 4.74. 0.65. 1.21. 0.95. 5.16. 4.04. 5.29. 1.25. 0.47. Phylum: Actinobacteria Order 0319-7L14 Phylum Nitrospirae Order Nitrospirales. 2.3.3.2 Diversity analysis The alpha diversity showed higher Shannon and Inv-Simpson indices in the lower electrode (Table 2-4). In the upper electrodes, similar Shannon and InvSimpson indices shows similar biodiversity between the samples. Thus, the better performance observed in S. hybridum is not due to a higher diversity in the.
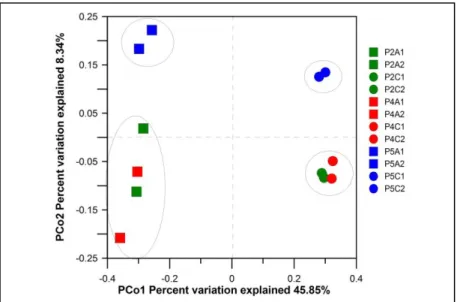
(35) 24. electrode. In the lower electrode Inv-Simpson index corresponding to S. spurium was much lower than the others, suggesting that low diversity in this could be related with its poor performance.. Table 2-4: The alpha diversity in the upper (A1, A2) and lower (C1, C2) electrodes corresponding to S. rupestre (P2), S. hybridum (P4) and S. spurium (P5). The observed OTUs, the sample coverage and the Shannon and inverse Simpson diversity indices were calculated from the normalized datasets (2245 sequences per each sample). The bacterial OTUs were generated at 97% sequence similarity. Diversity indices Number of Number of Sampling total sequences observed OTUs1 coverage. Shannon 6.66 ± 0.04 c. Inv-Simpson. P2A1. 7427. 344.7 ± 8.78 b. 0.93. 36.51 ± 1.73 a. P2A2. 4127. 296 ± 5.44 c. 0.95. 6.05 ± 0.05 d. 18.06 ± 1.1 b. P4A1. 2245. 275 ± 0 a. 0.96. 6.35 ± 9.36e-16 a. 36.34 ± 7.45e-15 a. P4A2. 4536. 282.9 ± 5.30 a. 0.95. 6.39 ± 0.02 a. 41.30 ±1.02 a. P5A1. 5191. 323.6 ± 5.32 d. 0.95. 6.55 ± 0.02 ad. 34.31 ± 0.89 a. P5A2. 6913. 312.5 ± 6.17 ad. 0.95. 6.81 ± 0.03 bc. 52.48 ±2.65 bc. P2C1. 3253. 644.4 ± 6.60 ab. 0.88. 8.27 ± 0.02 ab. 97.53 ± 5.04 ab. P2C2. 3102. 668.8 ± 7.08 ac. 0.88. 8.44 ± 0.02 ac. 141.73 ± 4.85 ac. P4C1. 4998. 699.6 ± 9.42 bc. 0.86. 8.49 ± 0.04 b. 126.90 ± 8.86 c. P4C2. 5025. 740.2 ± 13.76 abc. 0.84. 8.53 ± 0.04 b. 127.62 ± 6.52 c. P5C1. 4645. 486.8 ± 6.56 bd. 0.90. 6.95 ± 0.04 bd. 21.55 ± 1.15 b. P5C2. 3647. 606.8 ± 5.94 cd. 0.88. 7.45 ± 0.05 abc. 28.34 ± 1.47 d. 1. Total number of OTUs identified per sample. Mean ± Deviation standard values with different letters in the same column indicate statistically significant differences (p<0.05) according to Tukey’s test.. The Principal Coordinate Analysis (PCoA) plot showed differences between the microbial communities among the samples despite the fact that the reactors were identically inoculated (Figure 2-5). The use of different Sedum species can cause variations in the composition of the exudates (Pinton et al., 2007), and thus,.
(36) 25. it would be expected that the communities developed in the electrodes of each Sedum type differ in some degree. Similarly, in accordance with the PCoA plot, the upper and lower electrode samples were separately spotted in the two groups, indicating the development of different microbial communities. It is expected that diverse microbial communities will be found as they perform different functions catalyzing distinct chemical reactions. Electrode samples corresponding to S. spurium can be seen lightly distant from the others, suggesting the development of a community, as much in the anode as in the cathode, that could have influenced the poor performance of the reactor.. Figure 2-5: Beta diversity of the microbial community between samples based on the PCoA implemented in QIIME. Squares represent the upper electrode samples (A1, A2) and the circle represents the lower electrode samples (C1, C2) of the three Sedum species: S. rupestre (P2, green), S. hybridum (P4, red) and S. spurium (P5, blue)..
(37) 26. 3. PLANT MICROBIAL FUEL CELLS AS ALTERNATIVE FOR IMPROVING THE SUSTAINABILITY OF GREEN ROOF IN SEMI-ARID CLIMATES 3.1. Introduction In recent years the increase in urban areas has motivated the development of. technologies such as green roofs, which has permitted not only increasing the amount of green areas in urban settlements, but also the generation of positive outcomes. Some of the reported benefits of green roofs are: runoff reduction, mitigation of heat island effect, properties of insulation, creation of new habitat increasing biodiversity and improvement of air quality. These benefits explain the substantial expansion of green roofs in Western Europe, North America, and even in countries in the southern hemisphere as Australia and Chile (Williams et al., 2010).. In countries where climatic conditions are different to those of the northern hemisphere, mainly in rainfall and temperature, the construction and maintenance of these green areas should consider the water needed for irrigation. Although the use of drought-resistant plants, such as Sedum species, can reduce the amount of water used for irrigation. Preliminary studied conducted in a semiarid climate during dry season demonstrated that an extensive green roof planted with Sedum could use up to 60 L/m2 of water per day (Reyes et al., 2014), resulting in an excessive use of water for irrigation. For this reason, in semi-arid climates an.
(38) 27. efficient use of water is essential. To achieve this goal, on-line monitoring of water content by installing moisture sensors in the green roof emerges as an alternative for a smart use of this critical resource. However, according to our knowledge each of this sensors could be as high as US$400 each1, making this application less attractive for commercial and residential applications.. The use of low-cost bioelectrochemical systems (BESs), such as sediment microbial fuel cells (SMFCs) has emerged as an alternative to monitor and provide power to sensors in remote locations where battery replacement involves a high cost (Donovan et al., 2008). This type of BES allows bacteria to generate energy from organic matter from sediments, however its limited quantity prevents longterm use. This limitation can be solved by the use of plants (soil/plant- microbial fuel cells, PMFCs), which through its roots exudates can provide organic compounds to electrochemically active microorganisms able to convert this chemical energy to electricity (Helder et al., 2013a).. In PMFCs, power generation depends on the medium conductivity that, in turn depends on water content. Water saturation allows maintaining anoxic condition in the anode together with providing ionic mobility between electrodes. Thus by decreasing the water content in soil, open circuit voltage decreases (Chiranjeevi et al., 2012). Consequently, a PMFC could be implemented to. 1. Personal communication “Quote soil moisture sensor” to Morph2o Latinoamérica, November 25, 2015.
(39) 28. monitor the water content in constructed natural areas, such as green roofs, expanding the range of applications BESs. This study aims to evaluate the performance of PMFC systems installed in a laboratory scale green roof during 315 days under non-controlled environmental conditions. Performance was evaluated in terms of energy generation and its relation with the water content of the soil and solar radiation.. 3.2. Materials and methods. 3.2.1 Plant microbial fuel cells construction Three plant microbial fuel cells (PMFCs) were installed in the Laboratorio de Infraestructura Vegetal (LIVE), located in the Campus San Joaquín at the Pontificia Universidad Católica de Chile (PUC) in Santiago of Chile (33°29’S, 70°36’W). The laboratory includes 17 modules of extensive green roof, testing different thickness of typical green roof substrate and covered by mainly Sedum species (Reyes et al., 2015). Three PMFC reactors were placed in three identical modules with a substrate height of 10 cm planted with seven Sedum species (S. kamschaticum¸ S.rupestre, S. album, S. hybridum, S. spurium, S. sexangulare and S. reflexum). To address the relationship with the water content of the soil and the cell voltage, each reactor was settled to 20-30 cm of distance to the sprinkler used for irrigation. PMFCs consisted of two carbon base electrodes, one circular graphite fiber felt of 92 mm in diameter and 6 mm thick (Classic Kit; MudWatt) buried at a depth of 7 cm, and a second electrode placed on the surface of.
(40) 29. substrate, that consisted of activated carbon granules (3 mm in diameter; 57 cm3 volume) surrounded with a plastic ring and using a graphite rod as connection. PMFC were inoculated with mud from a pond used as water supply for irrigation located at the same campus. Titanium wires were used to connect the two electrodes to an external resistance of 1 kΩ (Figure 3-1).. Figure 3-1: Experimental setup at the Laboratorio de Infraestructura Vegetal (LIVE) in Campus San Joaquin, Pontificia Universidad Católica of Chile (A). Diagram and photography of the PMFC reactor configuration installed in the LIVE (B).. 3.2.2 Operation Reactors in LIVE were operated for 315 days (from December 2014 to October 2015). During first 200 days, irrigation was performed automatically by.
(41) 30. sprinklers, supplying 18 mm day-1 between days 0-26, 60 mm day-1 of days 27-136 and 15 mm day-1 of days 137-200. Then irrigation was suspended and plants were supplied with rainwater during rainfall. Cell voltage was measured once per week during the first 280 days of operation using a multimeter (UT55, UNI-T). After that time and for detailed measurement of the green roof PMFC reactors, data was collected every 10 minutes using data logger EM50 (Decagon®, Pullman, USA). Power and current densities were normalized using the projected area of buried carbon felt circular electrode (0.0067 m2). Polarization and power density curves were made varying external resistance from 50 Ω to 80 kΩ every 45 minutes.. Environmental parameters such as solar radiation, temperature, relative humidity and precipitations were measured every 5 minutes by a PAR sensor, ECT Air temperature sensor and ECRN-100 high-resolution rain gauge (Decagon®, Pullman, USA), respectively. Substrate water content, temperature and electrical conductivity were measured every 5 minutes by a sensor GS3 (Decagon®, Pullman, USA).. 3.2.3 Chemical analysis Three samples of the substrate were recollected finished the experiments (day 315) and stored to 4°C. Anions analysis (nitrate, nitrite and sulfate) were made by taking samples of leachate of each sample of substrate. For which substrate was.
(42) 31. left in contact with deionized water for five hours. At the end of this time, samples were collected and using nylon filters of 0.22 μm. Water samples were analyzed by ion chromatography using an IC882 Compact Plus chromatographer (Metrohm, Switzerland). In addition, pH and electric conductivity were measured adding deionized water to substrate until making a saturated paste (Kalra, 1995).. 3.3. Results and discussion. 3.3.1 PMFCs performance PMFC-2 and PMFC-3 show energy production after one week, unlike PMFC-1 that started up after one month of operation. This start-up period is shorter than those reported under laboratory conditions, where start-up time has been reported in more than 100 days (Timmers et al., 2010). This difference is probably due to the PMFCs tested in this study were installed in a green roof built about a year before the experiment, that could lead to a greater amount of roots and therefore a higher organic matter content available for microorganisms, allowing an fast establishment in anode. In addition, solar radiation observed during the testing period (2,200 μmol m-2s-1) was greater than the previously used in the laboratory for PMFC experiments, which does not exceed 596±161 μmol m-2s1. (Helder et al., 2010; Timmers et al., 2012b). Higher solar radiation could have a. direct impact on the exudation of organic compounds..
(43) 32. The current generated during the operation suggests that the oxidation of organic matter occurs on the surface near the roots, which can be observed between graphite granules in upper electrode. While reduction of the acceptor occurs in the electrode buried in the substrate, suggesting the reduction of others electron acceptors available in the soil, as sulfate. IC results show concentrations of sulfate around 1407.48±468.61 mg L-1 (Table 3-1). Sulfate reduction has been reported in biocathodes together with the organic matter oxidation in the anode (Coma et al., 2013).. Table 3-1: Electric conductivity, pH and anions concentration in leachate of three samples of the substrate of the Laboratorio de Infraestructura Vegetal (LIVE) finished the time operation of the PMFC reactors. Sample. Electric conductivity (mS cm-1). pH. Nitrate (mg L-1). Nitrite (mg L-1). Sulfate (mg L-1). 1. 317. 7.34. 0.062. 0.918. 873.38. 2. 421. 7.33. **. **. 1599.39. 3. 465. 0.974. **. 1749.67. Mean±SD. 401±76. 7.19 7.29± 0.08. 0.35±0.55. 0.31±.53. 1407±48. **Concentrations under detection limit.. In contrast to previous PMFC studies, conducted with wetland plants (Helder et al., 2013b; Kaku et al., 2008) and Sedum in laboratory experiments (previously described in chapter two), a relationship between radiation and current (Figure 32A and 3-2B) was not observed. However, it seems to be a slight increase in current during the night, which could be due to the Crassulacean acid metabolism of Sedum that could lead to exudation of organic compounds in dark periods when.
(44) 33. carbon is fixed, or to the variations in the moisture content of the substrate (Figure 3-2C).. Figure 3-2: Performance reactors located in LIVE between day 310 to 313 (A) together with the radiation (B) and water content in the substrate (C) in the same time period..
(45) 34. 3.3.2 Power density Power density curve (Figure 3-3A) showed maximum power densities of 114.6 μW m-2, 32.5 μW m-2 and 82.3 μW m-2 for PMFC 1, PMFC 2 and PMFC 3, respectively. Although these values are lower to those reported for PMFCs using wetland plants, they are greater than those obtained under laboratory conditions using each of the seven species of Sedum (presented in the previous chapter). Moreover, differences between reactors, which have same configuration and are subject to the same environmental conditions (air temperature, humidity, and solar radiation), could be due to the conditions in the substrate, such as temperature and humidity that could differ between the distinct modules.. Similar substrate temperatures (Figure 3-3B) were observed in all reactors, suggesting that this parameter is not responsible for the observed differences in the power density curve. On the other hand, the water content (Figure 3-3C) is distinct. A lower value is observed for the reactor with the lowest power density (PMFC 2), while PMFCs with higher power densities have a higher moisture value. This result indicates a relationship between two variables: power and water content.. The internal resistance of the system, obtained from the peak of the power density curve, showed a value of 2000 ohm for PMFC 3 while in PMFC 1 and 2 this was 600 ohm. These values are lower than those obtained for PMFCs with Sedum under non-water saturation and controlled temperature conditions. This.
(46) 35. difference could be due to the green roof substrate has a higher conductivity than the substrate used for laboratory tests, facilitating proton transport and reducing internal resistance.. Figure 3-3: Power curve (A) together with temperature (B) and water content (C) of the substrate at the moment of to realize the curves, are shown..
(47) 36. 3.3.3 Water content and current density The current generated by PMFCs in the laboratory showed a tide relationship between power generation and soil moisture content, reflected in an increase in the power as result of irrigation (Figure 3-4A). This behavior is expected, since the water maintain anoxic conditions of the system and allows a better cation transport between electrodes (Chiranjeevi et al., 2012). Water content and current were continuously monitored for two of the Sedum reactors: S. hybridum and S. rupestre. Current peaks of 6.85 mA m-2 and 1.95 mA m-2 were observed after batch irrigation, reaching a water content of 16% v/v and 17% v/v, respectively, and a seven day batch cycle was observed ending in current drops, reaching zero when the water content was less than 5% v/v (Figures 3-4B and 3-4C).. In the green roof, the current batch cycles observed for laboratory experiments (Figure 3-4), were not observed. This operation difference was primary due to reactors were automatically irrigated by sprinkles settled in the roof, keeping a relatively constant moisture in the substrate (Figure 3-5A). However, an increase in current density and water content as result of rainfall was observed (Figure 3-5B) when irrigation was suspended..
(48) 37. Figure 3-4: Relationship between current production and water content. (A) Current density of the three Sedum species and under controlled temperature conditions, in which cycles related with irrigation can be seen. On the right: Water content and current density during 14 days of two Sedum species: S. hybridum (B) and S. rupestre (C). A decrease in voltage and water content was observed.. Figure 3-5: Current density in the PMFC reactors between days 105 to 190, when irrigation was supplied by sprinklers (A). Current density of the reactors and water content in the substrate between days 245 to 280 are shown (B). An increase in both variables due to rainfall is observed..
(49) 38. During a period of 8 days, current and water content were continuously recorded in PMFC reactors located in the LIVE. This experiment allowed us to observe similar behavior in both variables (Figure 3-6). By increasing the water content in the substrate, due to precipitation, an increase in the current density in all reactors was observed. The lower current was observed in reactor with the lowest water content. However, PMFC 3 with the higher current density does not have a significantly greater amount of water in the substrate, suggesting that there are additional factors that could influences power generation, such as the organic matter content, electron acceptor concentration, microbial community, among others (Dunaj et al., 2012).. Figure 3-6: Current density (A) and Water content in the substrate (B) of three reactors located in LIVE during eight days. An increase in both variables due to rainfall is shown..
(50) 39. Considering the current and water content values after peak showed in Figure 3-6 and by performing an analysis of correlation (Figure 3-7), a relation between both variables was found. This can be seen in the correlation coefficients, whose values are 0.95, 0.96 and 0.95 for PMFC 1, PMFC 2 and PMFC 3, respectively. Additionally, R2 coefficient was calculated, obtaining values of 0.90, 0.92 and 0.89 for each reactor, indicating a linear relationship between considered variables.. Figure 3-7: Analysis of correlation between current density and water content for the dates showed in the Figure 3-6 of the three reactors: PMFC 1 (A), PMFC 2 (B) and PMFC 3 (C)..
(51) 40. 4. CONCLUSION The Sedum species are feasible to use in the PMFCs. Energy generation was. observed in the seven species evaluated, while that in the control reactor stopped after 150 days. S. hybridum showed the highest power density (92 μW m-2) followed by S. rupestre (15.5 μW m-2), while S. spurium presented the worst performance. On the other hand, a relation between power generation and irrigation events was observed in all the reactors.. The total organic carbon in root exudates of Sedum species not showed differences between the species tested, suggesting that the composition of the exudates could be more important for power generation.. Pyrosequencing results for the electrodes of S. hybridum, S. rupestre and S. spurium showed that members of the bacterial family Micrococcaceae were the most abundant on the S. hybridum anode. In contrast, family Comamonadaceae and Paracoccus and the Ardenscatena genera were mainly found on the S. rupestre and S. spurium anodes. The presence of bacteria commonly found in soil on the electrodes suggests that implementation of PMFCs would not alter the soil microbiota.. Similarly to results observed under controlled conditions of temperature in laboratory, studies in laboratory scale green roof revealed a relation between power generation and water content in the substrate under non-saturation water conditions..
(52) 41. Correlation analysis between current density and water content showed correlation coefficient values of 0.95, 0.96 and 0.95 for the three reactors evaluated.. In conclusion, results showed that Sedum, a typical green roof plant, could be used in PMFCs. In addition, the observed relationship between the water content in the soil and power generation could be useful for expanding this technology to develop low-cost water-content biosensors. This could allow us to have an affordable irrigation indicator and thus a more efficiently use of water in green roofs or other urban green areas in semiarid climates..
(53) 42. REFERENCES Ap Rees, T., Wilson, P.M. 1984. Effects of Reduced Supply of Oxygen on the Metabolism of Roots of Glyceria maxima and Pisum sativum. Zeitschrift für Pflanzenphysiologie, 114(5), 493-503. Cao, X., Huang, X., Liang, P., Xiao, K., Zhou, Y., Zhang, X., Logan, B.E. 2009. A New Method for Water Desalination Using Microbial Desalination Cells. Environmental Science & Technology, 43(18), 7148-7152. Caporaso, J.G., Bittinger, K., Bushman, F.D., DeSantis, T.Z., Andersen, G.L., Knight, R. 2010a. PyNAST: a flexible tool for aligning sequences to a template alignment. Bioinformatics, 26(2), 266-267. Caporaso, J.G., Kuczynski, J., Stombaugh, J., Bittinger, K., Bushman, F.D., Costello, E.K., Fierer, N., Pena, A.G., Goodrich, J.K., Gordon, J.I., Huttley, G.A., Kelley, S.T., Knights, D., Koenig, J.E., Ley, R.E., Lozupone, C.A., McDonald, D., Muegge, B.D., Pirrung, M., Reeder, J., Sevinsky, J.R., Turnbaugh, P.J., Walters, W.A., Widmann, J., Yatsunenko, T., Zaneveld, J., Knight, R. 2010b. QIIME allows analysis of high-throughput community sequencing data. Nat Meth, 7(5), 335-336. Coma, M., Puig, S., Pous, N., Balaguer, M.D., Colprim, J. 2013. Biocatalysed sulphate removal in a BES cathode. Bioresource Technology, 130, 218-223. Chae, K.-J., Choi, M.-J., Lee, J.-W., Kim, K.-Y., Kim, I.S. 2009. Effect of different substrates on the performance, bacterial diversity, and bacterial viability in microbial fuel cells. Bioresource Technology, 100(14), 3518-3525. Chen, Z., Huang, Y.-c., Liang, J.-h., Zhao, F., Zhu, Y.-g. 2012. A novel sediment microbial fuel cell with a biocathode in the rice rhizosphere. Bioresource Technology, 108(0), 55-59. Chiranjeevi, P., Mohanakrishna, G., Mohan, S.V. 2012. Rhizosphere mediated electrogenesis with the function of anode placement for harnessing bioenergy through CO2 sequestration. Bioresource Technology, 124, 364-70. De Schamphelaire, L., Cabezas, A., Marzorati, M., Friedrich, M.W., Boon, N., Verstraete, W. 2010. Microbial Community Analysis of Anodes from Sediment Microbial Fuel Cells Powered by Rhizodeposits of Living Rice Plants. Applied and Environmental Microbiology, 76(6), 2002-2008. Deng, H., Chen, Z., Zhao, F. 2012. Energy from Plants and Microorganisms: Progress in Plant–Microbial Fuel Cells. ChemSusChem, 5(6), 1006-1011. DeSantis, T.Z., Hugenholtz, P., Keller, K., Brodie, E.L., Larsen, N., Piceno, Y.M., Phan, R., Andersen, G.L. 2006. NAST: a multiple sequence alignment server for comparative analysis of 16S rRNA genes. Nucleic Acids Research, 34(suppl 2), W394-W399..
(54) 43. Donovan, C., Dewan, A., Heo, D., Beyenal, H. 2008. Batteryless, Wireless Sensor Powered by a Sediment Microbial Fuel Cell. Environmental Science & Technology, 42(22), 8591-8596. Dunaj, S.J., Vallino, J.J., Hines, M.E., Gay, M., Kobyljanec, C., Rooney-Varga, J.N. 2012. Relationships between Soil Organic Matter, Nutrients, Bacterial Community Structure, And the Performance of Microbial Fuel Cells. Environmental Science & Technology, 46(3), 1914-1922. Edgar, R.C. 2010. Search and clustering orders of magnitude faster than BLAST. Bioinformatics, 26(19), 2460-2461. Edgar, R.C., Haas, B.J., Clemente, J.C., Quince, C., Knight, R. 2011. UCHIME improves sensitivity and speed of chimera detection. Bioinformatics, 27(16), 21942200. Fioretti, R., Palla, A., Lanza, L.G., Principi, P. 2010. Green roof energy and water related performance in the Mediterranean climate. Building and Environment, 45(8), 1890-1904. Frank, K.L., Rogers, D.R., Olins, H.C., Vidoudez, C., Girguis, P.R. 2013. Characterizing the distribution and rates of microbial sulfate reduction at Middle Valley hydrothermal vents. ISME J, 7(7), 1391-1401. Helder, M., Chen, W.-S., van der Harst, E.J.M., Strik, D.P.B.T.B., Hamelers, H.V.M., Buisman, C.J.N., Potting, J. 2013a. Electricity production with living plants on a green roof: environmental performance of the plant-microbial fuel cell. Biofuels, Bioproducts and Biorefining, 7(1), 52-64. Helder, M., Strik, D.P., Hamelers, H.V., Kuhn, A.J., Blok, C., Buisman, C.J. 2010. Concurrent bio-electricity and biomass production in three Plant-Microbial Fuel Cells using Spartina anglica, Arundinella anomala and Arundo donax. Bioresource Technology, 101(10), 3541-7. Helder, M., Strik, D.P., Timmers, R.A., Raes, S.M., Hamelers, H.V., Buisman, C.J. 2013b. Resilience of roof-top Plant-Microbial Fuel Cells during Dutch winter. Biomass and Bioenergy, 51(0), 1-7. Justin, S.H.F.W., Armstrong, W. 1991. Evidence for the involvement of ethene in aerenchyma formation in adventitious roots of rice (Oryza sativa L.). New Phytologist, 118(1), 49-62. Kaku, N., Yonezawa, N., Kodama, Y., Watanabe, K. 2008. Plant/microbe cooperation for electricity generation in a rice paddy field. Applied Microbiology and Biotechnology, 79(1), 43-49. Kawaichi, S., Ito, N., Kamikawa, R., Sugawara, T., Yoshida, T., Sako, Y. 2013. Ardenticatena maritima gen. nov., sp. nov., a ferric iron- and nitrate-reducing bacterium of the phylum ‘Chloroflexi’ isolated from an iron-rich coastal hydrothermal field, and description of Ardenticatenia classis nov. International Journal of Systematic and Evolutionary Microbiology, 63(8), 2992-3002..
(55) 44. Logan, B. 2010. Scaling up microbial fuel cells and other bioelectrochemical systems. Applied Microbiology and Biotechnology, 85(6), 1665-1671. Lu, L., Xing, D., Ren, Z.J. 2015. Microbial community structure accompanied with electricity production in a constructed wetland plant microbial fuel cell. Bioresource Technology. Luo, J., Li, M., Zhou, M., Hu, Y. 2015. Characterization of a novel strain phylogenetically related to Kocuria rhizophila and its chemical modification to improve performance of microbial fuel cells. Biosensors and Bioelectronics, 69, 113120. Maier, R.M., Pepper, I.L. 2009. Chapter 4 - Earth Environments. in: Environmental Microbiology (Second Edition), (Ed.) R.M.M.L.P.P. Gerba, Academic Press. San Diego, pp. 57-82. Maricle, B.R., Lee, R.W. 2002. Aerenchyma development and oxygen transport in the estuarine cordgrasses Spartina alterniflora and S. anglica. Aquatic Botany, 74(2), 109-120. McDonald, D., Price, M.N., Goodrich, J., Nawrocki, E.P., DeSantis, T.Z., Probst, A., Andersen, G.L., Knight, R., Hugenholtz, P. 2012. An improved Greengenes taxonomy with explicit ranks for ecological and evolutionary analyses of bacteria and archaea. ISME J, 6(3), 610-618. Pinton, R., Varanini, Z., Nannipieri, P. 2007. The Rhizosphere: Biochemistry and Organic Substances at the Soil-Plant Interface, Second Edition. CRC Press. Quince, C., Lanzen, A., Davenport, R., Turnbaugh, P. 2011. Removing Noise From Pyrosequenced Amplicons. BMC Bioinformatics, 12(1), 38. Reyes, F.R., Bustamante, W., Gironás, J., Pastén, P., Rojas, V., Suarez, F., Vera, S., Victorero, F., Bonilla, C. 2015. Effect of substrate depth and roof layers on green roof temperature and water requirements in a semi-arid climate. Ecological Engineering, "In review". Reyes, R., Vera, S., Gironás, J., Bustamante, W., Rojas, V., Vistorero, F., Pastén, P., Suárez, F., Bonilla, C. 2014. Manejo del riego en cubiertas vegetales: análisis de sustentabilidad en un clima semiárido. in: XXVI Congreso Latinoamericano de Hidráulica. Santiago, Chile. Strik, D.P.B.T.B., Hamelers, H.V.M., Snel, J.F.H., Buisman, C.J.N. 2008. Green electricity production with living plants and bacteria in a fuel cell. International Journal of Energy Research, 32(9), 870-876. Subbarao, G.V., Ae, N., Otani, T. 1997. Genotypic variation in iron-, and aluminumphosphate solubilizing activity of pigeonpea root exudates under P deficient conditions. Soil Science and Plant Nutrition, 43(2), 295-305..
Figure

+7
Documento similar
ovatus also presented a higher ratio in C+Bricks, but these ratios were not significantly different to those observed in the other substrates (Table 2). Silene secundiflora
In Section 3 we study normal sections of 3-manifolds, both for the regular and singular cases, and show that the curvature locus of a 3-manifold can be generated by the curvature
The expansionary monetary policy measures have had a negative impact on net interest margins both via the reduction in interest rates and –less powerfully- the flattening of the
One example of the importance of the resources offered by an environment is reflected in the study of abundance and species richness carried out in New York City
(2007) Accumulation of arsenic in tissues of rice plant (Oryza sativa L.) and its 974. distribution in fractions of
studying the autocorrelation and partial correlation function for soil water content measured at a shallower depth as well as the cross-correlation function between soil water
(a) Angular velocity as a function of the applied laser power and power density for a bare upconverting NaYF 4 :Er 3+ ,Yb 3+ microspinner (black line and hexagons) and for a
Figure 3: Relationship between the response variables (productivity, density and recent population trends of the Bonelli’s eagle) and the predictor environmental variables in the
