Multiband study of RX J0838
−
2827 and XMM J083850.4
−
282759: a new
asynchronous magnetic cataclysmic variable and a candidate transitional
millisecond pulsar
N. Rea,
1,2‹F. Coti Zelati,
1,2,3,4P. Esposito,
2P. D’Avanzo,
4D. de Martino,
5G. L. Israel,
6D. F. Torres,
1,7S. Campana,
4T. M. Belloni,
4A. Papitto,
6N. Masetti,
8,9L. Carrasco,
10A. Possenti,
11M. Wieringa,
12E. De O˜na Wilhelmi,
1J. Li,
1E. Bozzo,
13C. Ferrigno,
13M. Linares,
14,15,16T. M. Tauris,
17,18M. Hernanz,
1I. Ribas,
1M. Monelli,
14,15A. Borghese,
2M. C. Baglio
3,4and J. Casares
14,15,19 Affiliations are listed at the end of the paperAccepted 2017 June 20. Received 2017 June 19; in original form 2016 November 10
A B S T R A C T
In a search for the counterpart to theFermi-LAT source 3FGL J0838.8−2829, we performed a multiwavelength campaign: in the X-ray band withSwiftandXMM–Newton; in the infrared and optical with OAGH, ESO-NTT and IAC80; and in the radio with ATCA observations. We also used archival hard X-ray data obtained byINTEGRAL. We report on three X-ray sources consistent with the position of theFermi-LAT source. We confirm the identification of the brightest object, RX J0838−2827, as a magnetic cataclysmic variable that we recognize as an asynchronous system (not associated with theFermi-LAT source). RX J0838−2827 is extremely variable in the X-ray and optical bands, and timing analysis reveals the presence of several periodicities modulating its X-ray and optical emission. The most evident modulations are interpreted as being caused by the binary system orbital period of ∼1.64 h and the white dwarf spin period of∼1.47 h. A strong flux modulation at ∼15 h is observed at all energy bands, consistent with the beat frequency between spin and orbital periods. Optical spectra show prominent Hβ, He I and HeII emission lines that are Doppler-modulated at the orbital period and at the beat period. Therefore, RX J0838−2827 accretes through a disc-less configuration and could be either a strongly asynchronous polar or a rare example of a pre-polar system on its way to reaching synchronism. Regarding the other two X-ray sources, XMM J083850.4−282759 showed a variable X-ray emission, with a powerful flare lasting for∼600 s, similar to what is observed in transitional millisecond pulsars during the subluminous disc state: this observation possibly means that this source can be associated with theFermi-LAT source.
Key words: accretion, accretion discs – novae, cataclysmic variables – pulsars: gen-eral – white dwarfs – X-rays: individual: RX J0838−2827– X-rays: individual: XMM J083850.4−282759.
1 I N T R O D U C T I O N
1.1 Cataclysmic variables
Cataclysmic variables (hereafter CVs) are close binary systems hosting a white dwarf (WD) and a low-mass main sequence star that typically fills its Roche lobe and is transferring material
E-mail:[email protected]
wards the compact object (see Warner2003for a review). About 20–25 per cent of the known CVs harbour WDs with magnetic fields in the range 105–108G and are known as magnetic CVs (mCVs;
Ferrario, de Martino & G¨ansicke2015). These mCVs can be di-vided into two main groups: the intermediate polars (IPs) and the polars. The former are characterized by asynchronously rotating WDs (PspinPorb) with spin periods ranging from a few hundreds
polarization, the WD is believed to possess moderately low mag-netic fields (≤107 G). The polars, on the other hand, consist of
orbitally locked rotating WDs (Pspin=Porb ∼hours) and are
cir-cularly polarized in the optical/near-infrared (see Cropper1990). Their magnetic field as measured from cyclotron emission is in the range∼10–300 MG, preventing the formation of an accretion disc; thus, accretion proceeds directly from the donor star on to the WD magnetic poles through a stream.
A handful of polars have been found to be slightly desynchro-nized (≤2 per cent), namely V1500 Cyg, BY Cam, V1432 Aql and CD Ind (Campbell & Schwope 1999). Another candidate, SWIFT J2319.4+2619, was discovered recently (Shafter et al.
2008). Since V1500 Cyg exploded as a nova in 1975, these asyn-chronous polars are believed to have undergone a nova explosion in the past and they will return to synchronism in hundreds of years (Boyd et al.2014; Harrison & Campbell 2016). However, only V1500 Cyg is known to be a nova, and searches for nova shells did not result in any detections (Pagnotta & Zurek2016).
Recently, two systems were found to be desynchronized at a much higher level (i.e. 2 per cent), namely Paloma (Schwarz et al.2007) and IGR J19552+0044 (Bernardini et al.2013). These systems might be regarded either as IPs with a very low degree of asynchronism or as polars with a large degree of asynchronism. In the former case these systems are not expected to reach syn-chronism, while in the latter case they may represent the true polar progenitors (see Norton, Wynn & Somerscales2004). Despite their small number, asynchronous polars represent excellent laboratories for the study of the physics of mass transfer in the case of a vary-ing magnetic field geometry, especially because of the continuous changes of orientation between the WD magnetic field axis and the accretion flow.
1.2 Transitional millisecond pulsars
The short spin periods of binary millisecond pulsars are the outcome of the accretion onto the neutron star (NS) of the mass transferred by a low-mass late-type companion star through an accretion disc (Alpar et al.1982). After a Gyr-long mass accretion phase during which the binary system shines as a bright low-mass X-ray binary (NS-LMXB), the mass transfer rate decreases, allowing the acti-vation of a – now rapidly spinning – radio/gamma-ray millisecond pulsar (MSP), powered by the rotation of its magnetic field. The tight association between radio MSPs and NS-LMXBs has recently been demonstrated by the discovery of three transitional millisecond pul-sars (PSR J1023+0038, Archibald et al.2009; IGR J18245−2452 in the globular cluster M28, Papitto et al.2013; XSS J12270−4859, Bassa et al.2014de Martino et al.2014;).
These sources have been observed to switch between accretion-and rotation-powered emission on time-scales ranging from a cou-ple of weeks to months, showing that such state transitions may take place on time-scales compatible with those of the variations of the mass accretion rate onto the NS. At high mass inflow rates, the radio pulsar is shut off and the system is bright in the X-ray (LX>1036erg s−1). At low mass inflow rates, the magnetosphere
expands up to the light cylinder, activating the radio pulsar. The disc disappears and the system is faint in the X-ray (LX∼1032erg s−1).
Surprisingly, in addition to the X-ray outburst accreting state and the radio pulsar state, the three known transitional MSPs have been observed in another extremely peculiarsubluminousdisc state, with
LX∼1033erg s−1(see also Linares2014). During this state, both
PSR J1023+0038 (Archibald et al.2015) and XSS J1227−4859 (Papitto et al.2015) showed evidence that part of the disc material
was being accreted onto the NS surface. These subluminous states were accompanied by X-ray flaring activity, a sizeable gamma-ray emission and a flat radio spectrum. These phenomena are typical jet signatures in accreting compact objects, suggesting that large mass outflows could be launched by the rapidly rotating propellering magnetosphere of these pulsars (Papitto, Torres & Li2014; Papitto & Torres2015; but see also Takata et al.2014for an alternative modelling based on a pulsar wind/disc shock).
1.3 TheROSATsource: 1RXS J083842.1−282723
1RXS J083842.1−282723 (RX J0838−2827 hereafter) was dis-covered byROSAT, and tentatively classified as a CV by Masetti et al. (2013) based on Balmer and helium emission lines observed in its optical spectrum. Because two of the three transitional MSPs were formerly misclassified as CVs because of their CV-like opti-cal spectra, searches within the error circles of newly discovered but still unidentifiedFermi-LAT sources are being carried out, de-spite early tentative classifications based on optical spectroscopy. In particular, the spatial coincidence with the unidentified gamma-ray source 3FGL J0838.8−2829 in theFermiLarge Area Telescope (LAT) four-year point-source catalogue (Acero et al.2015) and the variability of the X-ray emission detected on a time-scale of a few hours in archivalSwiftobservations made the nature of the source controversial.
We report in this paper on a large unprecedented multi-band campaign of the field of 3FGL J0838.8−2829 in the radio, infrared, optical and X-ray bands. In Sections 2, 3 and 4, we report on the de-tails of the observations of the field of 3FGL J0838.8−2829. In Section 5, we present the data analysis and results on RX J0838−2827. In Section 6, we report on the analysis of the other X-ray sources associated with 3FGL J0838.8−2829 and in particular on the flaring source XMM J083850.4−282759, which might be a new transitional millisecond pulsar possibly associated with the gamma-ray emission. A discussion follows in Section 7.
2 X - R AY O B S E RVAT I O N S
We report here and in the following few sections on the multi-band data analysis of and results for RX J0838−2827, while in Section 6 we report on the other X-ray sources in the field, in particular on the flaring X-ray source XMM J083850.4−282759.
2.1 XMM–Newton
Two XMM–Newton observations were carried out, on 2015 Oc-tober 20–21 (ID: 0764420101; PI: Rea) and December 2–3 (ID: 0790180101; thanks toXMMDirector’s Time), and in both cases RX J0838−2827 was placed at the aim point of the European Pho-ton Imaging Cameras (EPIC). The pn camera (Str¨uder et al.2001) was configured in large-window mode (LW; 47.7-ms time reso-lution), whereas the two MOS cameras (Turner et al.2001) were operated in small-window mode (SW; 0.3-s time resolution). The thin optical blocking filter was positioned in front of the cameras in both observations. The reflection grating spectrometers (RGS; den Herder et al.2001) were operated in standard spectroscopy mode. The journal of the two observations is reported in Table1.
2.1.1 EPIC data
We processed the raw observation data files using theEPPROC(for pn
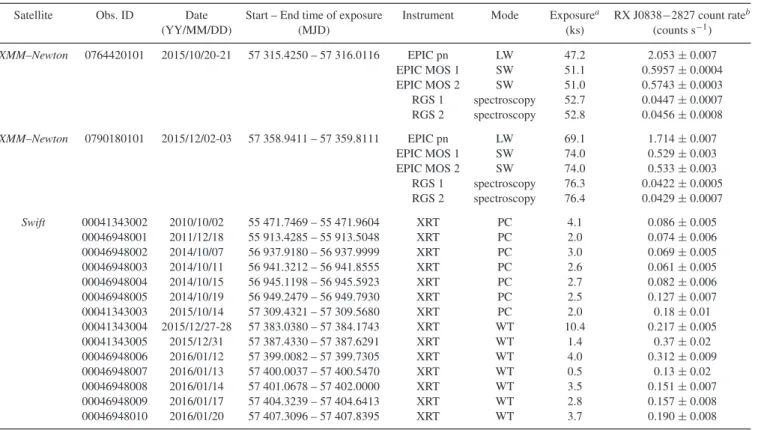
Table 1. Log of the X-ray observations.
Satellite Obs. ID Date Start – End time of exposure Instrument Mode Exposurea RX J0838−2827 count rateb
(YY/MM/DD) (MJD) (ks) (counts s−1)
XMM–Newton 0764420101 2015/10/20-21 57 315.4250 – 57 316.0116 EPIC pn LW 47.2 2.053±0.007
EPIC MOS 1 SW 51.1 0.5957±0.0004
EPIC MOS 2 SW 51.0 0.5743±0.0003
RGS 1 spectroscopy 52.7 0.0447±0.0007 RGS 2 spectroscopy 52.8 0.0456±0.0008
XMM–Newton 0790180101 2015/12/02-03 57 358.9411 – 57 359.8111 EPIC pn LW 69.1 1.714±0.007
EPIC MOS 1 SW 74.0 0.529±0.003
EPIC MOS 2 SW 74.0 0.533±0.003
RGS 1 spectroscopy 76.3 0.0422±0.0005 RGS 2 spectroscopy 76.4 0.0429±0.0007
Swift 00041343002 2010/10/02 55 471.7469 – 55 471.9604 XRT PC 4.1 0.086±0.005
00046948001 2011/12/18 55 913.4285 – 55 913.5048 XRT PC 2.0 0.074±0.006
00046948002 2014/10/07 56 937.9180 – 56 937.9999 XRT PC 3.0 0.069±0.005
00046948003 2014/10/11 56 941.3212 – 56 941.8555 XRT PC 2.6 0.061±0.005
00046948004 2014/10/15 56 945.1198 – 56 945.5923 XRT PC 2.7 0.082±0.006
00046948005 2014/10/19 56 949.2479 – 56 949.7930 XRT PC 2.5 0.127±0.007
00041343003 2015/10/14 57 309.4321 – 57 309.5680 XRT PC 2.0 0.18±0.01
00041343004 2015/12/27-28 57 383.0380 – 57 384.1743 XRT WT 10.4 0.217±0.005
00041343005 2015/12/31 57 387.4330 – 57 387.6291 XRT WT 1.4 0.37±0.02
00046948006 2016/01/12 57 399.0082 – 57 399.7305 XRT WT 4.0 0.312±0.009
00046948007 2016/01/13 57 400.0037 – 57 400.5470 XRT WT 0.5 0.13±0.02
00046948008 2016/01/14 57 401.0678 – 57 402.0000 XRT WT 3.5 0.151±0.007
00046948009 2016/01/17 57 404.3239 – 57 404.6413 XRT WT 2.8 0.157±0.008
00046948010 2016/01/20 57 407.3096 – 57 407.8395 XRT WT 3.7 0.190±0.008
Notes.aDead-time-corrected on-source exposure.
bAverage background-subtracted count rate in the 0.2–10 keV energy band for the EPIC instruments, in the 0.35–2.5 keV energy band for the combined RGS first-order data sets, and in the 0.3–10 keV energy band for theSwiftXRT data.
Analysis System (SAS,1version 15.0), with the calibration files in
the data base released in 2016 January (XMM-CCF-REL-332). The inspection of the EPIC light-curves binned at 10 s revealed episodes of strong flaring particle background in both observations. For the spatial and spectral analysis, we discarded the intervals affected by the flaring background, which were pinpointed by ap-plying intensity filters on the light-curves, following the procedure described by De Luca & Molendi (2004). This reduced the effective exposure time to approximately 38.9 (pn), 48.5 (MOS 1) and 48.4 (MOS 2) ks for the first observation, and to 64.6 (pn), 71.5 (MOS 1) and 71.2 (MOS 2) ks for the second observation.
We ran the SAS source detection script EDETECT_CHAIN on the
combined event lists from the two observations. This returned for RX J0838−2827 the position RA=08h38m43s.20, Dec.=
−28◦2701.44 (J2000.0), with an uncertainty of 1.4 arcsec (ra-dius, at the 90 per cent confidence level).2This is fully consistent
with the more accurate position of the optical counterpart, RA= 08h38m43s.37, Dec.= −28◦2701.5, with an uncertainty of about
0.2 arcsec (Masetti et al.2013). The 0.2–10 keV image of the field of 3FGL J0838.8−2829 is shown in Fig.1, and RX J0838−2827’s light-curves are shown in in Fig. 2. It was created by stacking the images of the EPIC cameras cleaned from bad pixels and hot columns from both observations. Apart from RX J0838−2827, two other X-ray sources were identified in the 68 per cent error cir-cle of 3FGL J0838.8−2829. In the following we will term them
1Seehttp://xmm.esac.esa.int/sas/
2The uncertainty on the position is evaluated as the quadratic sum of the
statistical uncertainty given by the taskEDETECT−CHAINand the systematic
absolute pointing uncertainty ofXMM–Newton.
Figure 1. Field around RX J0838−2827 in the 0.2–10 keV band as observed byXMM–Newton. The image shows the merging of all observations and data from EPIC instruments, for a total exposure time of∼125 ks. The white circle shows the position of the Fermi-LAT source 3FGL J0838.8−2829 with a 0◦.03 error radius (at the 68 per cent confidence level) as reported in the 3FGL catalogue. The black circle is centred on the best optical position, with an error circle of 2 arcsec (increasing the optical positional accuracy by a factor of 10 for imaging purposes). North is up, and east is left.
XMM J083850.4−282759 and XMM J083842.7−283832 (see Table4for details of their positions and X-ray properties).
0 2 104 4 104 6 104 8 104
0 2 4 6 8
Mag
0.2-3 keV
3-10 keV
0 0.1 0.2 0.3 0.4 0.5
HR
(3-10keV/0.2-3keV)
Counts/s
V - band
0 2 104 4 104 6 104 8 104
18.5 18 17.5
Time (s)
0 2 4 6
8 0.2-3 keV
3-10 keV
Counts/s
HR
(3-10keV/0.2-3keV)
0 0.1 0.2 0.3 0.4 0.5
Mag
0 2×10⁴ 4×10⁴ 6×10⁴ 8×10⁴
18.5 18 17.5 17
Time (s)
B - band
Figure 2. XMM–NewtonEPIC (pn+MOS) light-curves (with a binning time of 200 s) of RX J0838−2827 in two energy bands (and hardness ratios) for the first (left) and second (right)XMM–Newtonobservations. The bottom panels show theXMM–Newtonoptical monitor magnitudes during the two observations (see text for details). Errors are smaller than the markers (∼0.02–0.04 mag).
circles located on the same CCD as the source (so as to guarantee similar low-energy noise subtraction) and avoiding detector areas contaminated by possible out-of-time events from the source (in the pn) or too near to the CCD edges. In contrast, data products for the other two sources were extracted only from the event lists of the pn, because both fell outside the central window of the MOS instruments.
We restricted the analysis to photons in the 0.2–10 keV energy range withPATTERN≤4 for the pn and≤12 for the MOS, andFLAG=
0 (we also checked that the data were not affected by pile-up). For the spectral analysis of RX J0838−2827 we used only the data ac-quired by the pn camera, which provides the spectra with the highest counting statistics, in order to avoid systematic errors introduced by cross-calibration uncertainties (we checked that the MOS spectra were in agreement with the results from the pn camera). We gener-ated the spectral redistribution matrices and ancillary response files for each of the three sources with theRMFGENandARFGENtools,
re-spectively. The fits were performed with theXSPECpackage (version 12.9.0; Arnaud1996), usingχ2statistics. For the timing analysis,
we converted the photon arrival times to the Solar system barycentre reference frame using theSAStaskBARYCENand the DE-200 Solar
system ephemeris.
2.1.2 RGS data
We processed the data using the taskRGSPROCofSAS in order to
produce calibrated and concatenated photon event lists, spectra and response matrices. We focused our analysis on the first-order spec-tra alone, which are the best calibrated and have a higher number of counts. First, we subtracted the model background spectra, which were created by the standard RGS pipeline and are template back-ground files based on the count rate in CCD 9. We then combined the spectra usingRGSCOMBINE, which appropriately accounts for the
response matrices and backgrounds of the different spectrometers, and rebinned the resulting spectra to have at least one count per energy bin. The analysis was limited to the energy interval 0.35– 2.5 keV (5–38 Å), where the calibration of the response is most accurate (see Fig.3).
Figure 3. XMM–NewtonRGS first-order spectra of RX J0838−2827 for the second observation. Grey lines represent the three ionized plasma com-ponents of the model (black line) that best fits the pn (and RGS) data.
Figure 4. SwiftXRT long-term light-curve of RX J0838−2827. Fluxes relative to the most recent observations are shown in the inset.
2.2 SwiftX-ray telescope
The X-ray telescope (XRT; Burrows et al.2005) onboard theSwift
a two-dimensional image and a time resolution of 2.5073 s. The last seven observations were instead performed in windowed timing (WT) mode; that is, data were transferred from the imaging array to the frame store array with an integration time of 1.78 ms, at the expense of one dimension of spatial resolution (see Hill et al.2004
for a detailed description of the XRT readout modes).
The data were analysed primarily to study the X-ray long-term variability of RX J0838−2827. We processed the data with standard screening criteria and generated exposure maps with the taskXRT -PIPELINE(version 0.13.2) from theFTOOLSpackage (Blackburn1995), using the optical position of the source (Masetti et al.2013) and the spacecraft attitude file. We selected events with grades 0–12 and 0 for the PC and WT data, respectively, and extracted the source and background spectra usingXSELECT(version 2.4). We accumulated
the source counts from a circular region with a radius of 20 pixels (one XRT pixel corresponds to about 2.36 arcsec). In order to esti-mate the background in the PC-mode data, we extracted the events within an annulus centred on the source position with an inner and an outer radius of 40 and 80 pixels, respectively. For the WT-mode data, we opted for a circle far from the target and of the same size as the source circle, owing to the small extent of the WT window.
We created the observation-specific ancillary response files (us-ing exposure maps) withXRTMKARF(version 0.6.3), which corrects
for the loss of counts owing to hot columns and bad pixels, and accounts for different extraction regions, telescope vignetting and point spread function (PSF) corrections. We then assigned the ap-propriate redistribution matrix available in the HEASARC
calibra-tion data base,3 excluded bad spectral channels, and grouped the
background-subtracted spectra to have at least 20 counts in each spectral bin. We limited the spectral analysis to the energy range 0.3–10 keV for PC-mode data and to 0.7–10 keV for the WT-mode data, owing to known calibration issues in WT that result in spurious bumps and/or turn-ups in the spectra at low energies.4
2.3 INTEGRAL
We analysed all publicly availableINTEGRALdata collected in the direction of the source in the past 13 yr of the mission. We consid-ered allINTEGRALscience windows (ScW), namely the various pointings each lasting∼2–3 ks, in which the source was observed within 12◦off-axis from the satellite aim point for the IBIS/ISGRI instrument (Lebrun et al.2003; Ubertini et al.2003) and 3◦.5 off-axis for the two JEM-X instruments (Lund et al.2003). All data were processed and analysed using the Off-line Scientific Analysis software (OSA) version 10.2 distributed by the ISDC (Courvoisier et al.2003).
We found that the region around 3FGL J0838.8−2829 was probed by INTEGRALfor a total of 892 ks effective exposure with IBIS/ISGRI, and for 15.5 ks (10.0 ks) with JEM-X1 (JEM-X2). The data set spanned from satellite revolution 28 (starting on 52644 MJD) to 1625 (ending on 57381 MJD). We built the IBIS/ISGRI mosaics in the 20–40 keV and 40–80 keV energy bands, and the JEM-X mosaics in the 3–10 keV energy band. RX J0838−2827 was not detected by these instruments. Using the
OSA MOSAIC_SPECtool we estimated a 3σ upper limit on the source
hard X-ray flux of 1 mCrab (∼8×10⁻¹²erg cm−2s−1) in the 20–
40 keV energy band, and of 1.5 mCrab (∼10−11erg cm−2s−1) in
the 40–80 keV energy band. The corresponding upper limit in the
3Seehttp://www.swift.ac.uk/analysis/xrt/rmfarf.php
Near-infrared observations of the field of the 3FGL J0838.8−2829 source were carried out on 2016 January 14 with the 2.1-m telescope of the Observatorio Astrofisico Guillermo Haro (OAGH) in Cananea, Mexico. The telescope is equipped with the CAnanea Near Infrared CAmera (CANICA), which provides an image scale of 0.32 arcsec pixel−1, and covers a field of view
of about 4 × 4 arcmin2. CANICA observed with the H filter
starting at 08:03:46UTfor an exposure of 60 s, and with theKfilter
starting at 08:13:56UTfor an exposure of 30 s. The counterparts
to the three X-ray sources were detected in both bands, with the following magnitudes:H= 17.16± 0.2 andK=16.18 ±0.09 for RX J0838−2827;H=17.0± 0.2 andK= 16.7± 0.1 for XMM J083850.4−282759; andH=17.0±0.2 andK=16.2± 0.1 for XMM J083842.7−283832. The zero-points were 20.18 and 21.34 for theHandKfilters, respectively (see also Fig. 5). Neither XMM J083850.4−282759 nor XMM J083842.7−283832 have a counterpart in the Two-Micron All-Sky Survey (2MASS) catalogue.5
3.2 XMM–Newtonoptical monitor
TheXMM–Newton Optical/UV Monitor Telescope (OM; Mason et al.2001) was configured in ‘Image’ mode throughout the first observation and used theV filter, providing a wavelength cover-age within the range 5100–5800 Å A total of 10 exposures were acquired, resulting in a total dead-time-corrected on-source expo-sure time of about 45.8 ks (the first five expoexpo-sures had a dura-tion of about 5 ks each, whereas the following five lasted about 4.16 ks). The OM acquired the data in both ‘fast-window’ and ‘Image’ modes during the second observation, using theBfilter (centred on 4392 Å and with band pass between 3800 and 5000 Å). No useful analysis could be carried out on the data sets taken in the fast-window mode, because the source fell outside the small square window (23×23 pixel2) of the instrument. We then focused on the
data in the ‘Image’ mode, which consists of fifteen 4.4-ks frames for a total exposure of 66.0 ks.
We extracted the background-subtracted photometric data using theOMICHAINprocessing pipeline with the default parameter settings,
as recommended by theSASthreads.6Only one source was detected
within the error circle of the X-ray position of RX J0838−2827, for which we show the light-curve in Fig.2. The optical sion clearly shows a variability correlated with the X-ray emis-sion, around an average value of 17.77 mag in theV filter and of 17.53 mag in theBfilter (expressed in the Vega photometric system). XMM J083850.4−282759 and XMM J083842.7−283832 are clearly detected in the second, longest observation. Interestingly, the former source exhibits a flare (B∼ 19.5 mag) simultaneous with that observed in the soft X-ray flux (see Sec-tion 6 and Fig.6). No significant flaring episodes are observed in the data sets of the latter source.
5Seehttp://www.ipac.caltech.edu/2mass/releases/second/
6See http://xmm2.esac.esa.int/sas/8.0.0/documentation/threads/omi_
Figure 5. Field around RX J0838−2827 in various energy bands. The radio images were taken by ATCA. The top panels show images at 5.5 GHz (top left) and 9 GHz (top right): superimposed are theFermi-LAT 3FGL position (0◦.033 error circle at the 68 per cent confidence level), and a 2-arcsec black circle around the optical position of RX J0838−2827. The middle panels show the infraredKband (middle left) andHband (middle right) as observed by the OAGH telescope. The bottom panels show the opticalBband (bottom left) andRband (bottom right) from the IAC80 telescope. The black circle in the middle and bottom panels is centred on the RX J0838−2827 best optical position with an error radius of 1 arcsec (increasing the optical positional accuracy by a factor of 5 for imaging purposes). North is up, and east is left.
3.3 IAC-80
Optical imaging observations of the field of 3FGLJ0838.8-2829 were carried out with the IAC-80 telescope on 2015 December 11 and 12 (MJD 57367 and 57368) and on 2016 January 5 and 28 (MJD 57392 and 57415). A set of exposures lasting 300 s were obtained on each night, alternating theBandRfilters. Image reduction was car-ried out by following the standard procedures: subtraction of an av-eraged bias frame, division by a normalized flat frame. Astrometry
was performed using the USNOB1.07catalogue. Aperture
photom-etry was carried out with thePHOTOMsoftware part of theSTARLINK8
package. The photometric calibration was performed against the APASS catalogue. In order to minimize any systematic effect, we
Figure 6. Top: 0.2–10 keV background-subtracted and exposure-corrected pn light-curve of source no. 2 (XMM J083850.4−282759) during the second
XMM–Newtonobservation. A binning time of 400 s was adopted in the inset with the zoom of the flare. Time is in units of seconds since the start of the exposure.Bottom:XMM-OM field of view with superimposed the 68 per cent
Fermi-LAT position of 3FGL J0838.8−2829 (light blue) and the three X-ray sources detected in theXMM-pn field of view (white). Green denotes the position of all the radio detections at 5.5 GHz within the 3FGL error circle (see text for details).
performed differential photometry with respect to a selection of local isolated and non-saturated standard stars. In Fig.5we show two images taken on 2015 December 11 in theBandRbands. We detected the three X-ray sources in both bands. RX J0838−2827 dis-plays significant variability matching the periodicity observed in the X-ray and with the OM. The mean magnitudes areB∼17.7 and
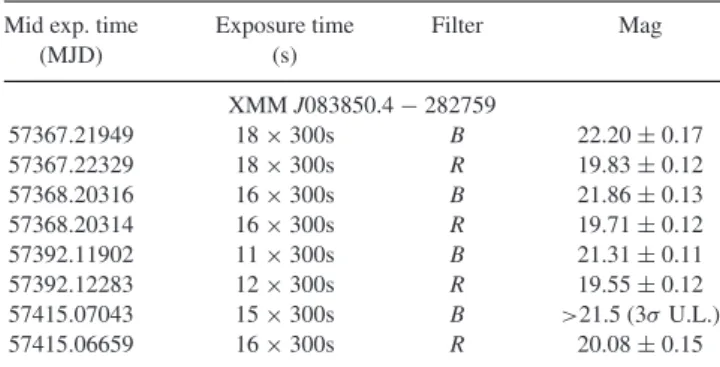
R∼17.0. The other two X-ray sources were detected with mean magnitudesB∼21.7 andR∼19.8 for XMM J083850.4−282759 andB∼20.0 andR∼19.01 for XMM J083842.7−283832. This last source shows a steady optical flux. In contrast, some variability is revealed in XMM J083850.4−282759 both in the singleR-band exposures (in theBband the source is too faint to be detected in the single frames) and among the different nights (Table3).
3.4 ESO-NTT observations
We performed optical spectral observations of RX J0838−2827 on 2016 February 27 with the ESO-NTT telescope (ID: 296.D-5034; PI: Rea). The observations were carried out with the EFOSC2
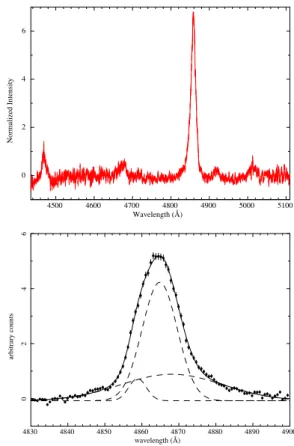
spec-Figure 7. Top: An example of the ESO-NTT spectra of RX J0838−2827.
Bottom: Modelling of the Hβemission line with three Gaussians (see text for details).
trograph using grism 19 and a slit aperture of 1 arcsec, covering the spectral range 4445–5110 Å with a resolutionR∼2500 (0.67 Å pixel−1). A total of 29 spectra, each one lasting 550 s, were
ob-tained in the time interval from 01:05:30UTto 06:55:33UT. Data
were reduced with standard procedures using theESO-MIDASpackage for bias subtraction and flat-field correction. Wavelength calibration was carried out using helium–argon lamps. The acquired spectra are shown in Figs7and8.
4 R A D I O O B S E RVAT I O N S
We observed the field around the position of 3FGL J0838.8−2829 using the Australia Telescope Compact Array in the 1.5A configura-tion at 5.5 and 9 GHz with a bandwidth of 2 GHz at each frequency (TOO project CX339). The observations were carried out on 2015 December 4 from 12:46 to 20:28 (UT), with a total integration time
of 6.2 h. We used PKS B1934-638 as the flux calibrator and 0858-279 as the phase calibrator. After standard calibration and imaging withMIRIAD(Sault, Teuben & Wright1995), we ran one round of
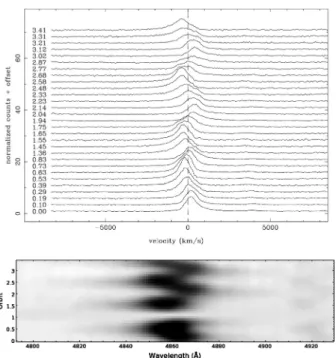
Figure 8. ESO-NTT spectra of RX J0838−2827.Top: TheHβ emission line as a function of the orbital phase (computed assuming phase zero for the first NTT spectrum).Bottom: Trailed spectra centred on theHβemission line; orbital phases are relative to the 1.64-hr periodicity.
5 R X J 0 8 3 8−2 8 2 7 : DATA A N A LY S I S A N D R E S U LT S
5.1 X-ray timing analysis
The light-curves of the two XMM–Newton observations of RX J0838−2827 reveal substantial variations with time (see Figs2,
9and 10). A strong modulation with period of∼1.6 h (6 ks) is easily recognisable, with another ample modulation on a time-scale approximately 10 times longer. Because the longer modulation is present in both theXMM–Newtonobservations, it might be recur-rent, with a characteristic time of∼15 h (54 ks).
The modulation pattern is complex, and we lacked knowledge of its origin, so we adopted the following approach to model it: we
Figure 10. XMM–Newtonlight-curves for the first (left) and second (right) observations folded at the system orbital period. The top panels are relative to the time-span of the maximum of the beat modulation, and the bottom panels to the minimum.
first fitted two sinusoidal functions to the data of each observation independently. Because the fit was not satisfactory, we tested the addition of further sinusoidal components with periods free to as-sume any value (i.e. we did not force them to be integer factors or multiples ofP1orP2). In other words, we modelled the data with a
Fourier sum of the form
A0+
k2
Aksin
⎛
⎝2π(x−φk)
Pk
⎞
⎠. (1)
Of course, askincreases, the adherence of the model to the data improves, but we found that the simplest function that fits the data reasonably well, adequately describing the occurrence of minima and maxima and the overall shape of the curve, requires three sine components (k=3). By fitting this purely phenomenological model to the data, we derived the valuesP1, XMM1=1.644±0.005 h (5.92
±0.02 ks),P2, XMM1=15.0±0.5 h (54.2±2.0 ks), andP3, XMM1
= 1.491± 0.008 h (5.37±0.03 ks) for the first XMM–Newton
observation, andP1, XMM2 = 1.650 ±0.003 h (5.94± 0.01 ks),
P2, XMM2=15.2±0.2 h (54.7±0.7 ks), andP3, XMM2=1.477±
0.003 h (5.34±0.01 ks) for the second. The measures ofP1and
P2are not precise enough to bootstrap a unique coherent solution
Figure 11. The left panel shows the results of the spectral analysis of the peak spectra of the long-term modulation, while the right panel shows the results of the minima. From top to bottom (in both panels): 0.2–10 keV pn spectra of RX J0838−2827 fitted to theTBABS*PCFABS*(MEKAL+MEKAL+MEKAL) model (solid
lines);E×f(E) unfolded spectra; post-fit residuals in units of standard deviations. The first observation is represented in black; the second in red.
that links the twoXMM–Newtondata sets (in particular, there is a strong alias degeneracy inP1).
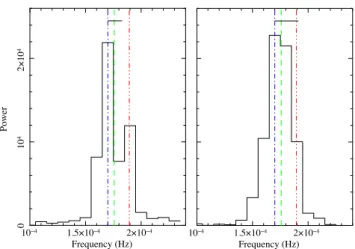
In order to better assess the situation, we inspected a Fourier trans-form of the secondXMM–Newtonobservation computed using the pn data that allow the highest timing resolution (bin time: 47.66 ms). Several peaks can be observed in the power spectral density (PSD) plot (Fig.9). Two strong close but distinct peaks (their separation is larger than the intrinsic Fourier resolution, ν 1.4×10⁻⁵Hz)
are located at=1.69(5)×10−4Hz (the central frequency was
measured by the fit with a Gaussian, and is equivalent to 1.64± 0.04 h) andω=1.88(9)×10−4Hz (1.47±0.08 h), and they clearly
correspond toP1, XMM2andP3, XMM2, respectively. An even higher
peak is present at∼1.87×10⁻⁵Hz (14.88 h) and is consistent with
P2, XMM2. The fact that the central frequency of this peak differs by
less than 2 per cent from the quantityω–strongly suggests that the peak is the sideband (beat) frequency betweenandω, which we interpret as the orbital and spin periods of RX J0838−2827, re-spectively (see Section 7.1). Many other peaks that stand out above the significance threshold in the PSD can be interpreted as combi-nations ofandω. The most prominent ones are labelled in Fig.9. The PSD computed from the first observation is similar (Fig.9), but only one peak is present around the frequencies ofandω. This is to be expected in any case, because of the lower intrinsic resolution of this observation (∼2.2×10⁻⁵Hz), but the slightly asymmetric
shape of the peak, which is unbalanced towards, suggests that it may actually be a blend of two peaks.
5.2 X-ray spectral analysis
We started the spectral analysis by fitting the pn averaged spectra of the two observations to a set of models: power laws, bremsstrahlung, blackbodies, an accretion disc consisting of multiple blackbody components (DISKPBB), a model describing the emission produced
by a thermal distribution of electrons that Compton up-scatter soft seed X-ray photons (NTHCOMP; Zdziarski, Johnson & Magdziarz 1996; ˙Zycki, Done & Smith1999), and a model reproducing the emission by hot diffuse gas (MEKAL). We accounted for photoelectric
absorption by the interstellar medium along the line of sight through the TBABSmodel, and adopted the photoionization cross-sections
from Verner et al. (1996) and the chemical abundances from Wilms, Allen & McCray (2000). None of the above-mentioned models gave a satisfactory description of the data.
Much more acceptable results were achieved when fitting the data to models consisting of severalMEKALcomponents at different
temperatures.
Given the strong flux variability in both observations, as well as the variable hardness ratio we observed comparing light-curves in different energy bands (see Fig.2), we performed the spectral analysis comparing time-resolved spectra, which we believe yielded more meaningful results for this variable source (see Fig.11). We first analysed the spectra during the peak of the 54.7-ks beat mod-ulation for both observations, and then we extracted spectra for the maximum and minimum of the shorter 5.9-ks periodicity. When fitting with a series of 3MEKALmodels we found good results for all the spectra we considered. Despite the cycle-to-cycle variations observed in the hardness ratio in both observations (see Fig.2), we did not find significant variability (within the 90 per cent parameter uncertainties) when fitting the 1.64-h phase-dependant spectra nor merging the two observations in phase to increase the statistics of each phase-resolved spectrum (probably owing to the low number of counts that we could collect at the minimum phases). However, we found significant changes in the spectra collected at the max-imum and minmax-imum of the long-term beat period of 54.7 ks. The best-fitting parameters for the absorbed 3MEKALmodel are listed
in Table2, and the spectrum and the best-fitting model are shown in Fig.11. It is evident how the relative significance of the three different hot plasmas changes along the beat modulation, with the coolest component at an effective temperature of∼0.2 keV being more prominent at the maxima of the beat (ω–) modulation. This might be because accretion switches to the other (lower) pole at the half-beat cycle, and the other pole might not be visible anymore (depending on the colatitude and the inclination angles).
The source 0.2–10 keV observed flux was 7.6 × 10⁻¹² erg
cm−2 s−1, a factor of∼1.2 larger than that measured during the
second observation, about 1.5 months later. The derived absorption column density,NH∼1.6×1020cm−2, is about one order of
mag-nitude lower than the estimated total Galactic value in the direction of the source (∼2×1021cm−2; Willingale et al.2013), implying a
close-by location of this source within our Galaxy.
5.3 High-resolution X-ray spectra
Table 2. Results of the fits of the XMM–NewtonEPIC pn spectra of RX J0838−2827 at the minimum and maximum of the∼54.7-ks beat modulation. For each beat phase the spectra of both observations were fitted together to theTBABS*PCFABS*(MEKAL+MEKAL+MEKAL) model, with all
normalizations free to vary. Uncertainties are quoted at the 90 per cent confidence level for a single parameter of interest.
Parameter Minimum Maximum
Notes.aThe abundances are those of Wilms, Allen & McCray (2000). The photoelectric absorption cross-sections are from Verner et al. (1996). bNormalizations are in units of 10−4cm−5.
cFluxes are in units of 10−12erg cm−2s−1and in the 0.2–10 keV energy
range.
Table 3. Log of IAC80 imaging observations and results of photometry of the source XMM J083850.4−282759. Magnitudes are in the Vega system and are not corrected for Galactic extinction.
Mid exp. time Exposure time Filter Mag
(MJD) (s)
XMMJ083850.4−282759
57367.21949 18×300s B 22.20±0.17
57367.22329 18×300s R 19.83±0.12
57368.20316 16×300s B 21.86±0.13
57368.20314 16×300s R 19.71±0.12
57392.11902 11×300s B 21.31±0.11
57392.12283 12×300s R 19.55±0.12
57415.07043 15×300s B >21.5 (3σU.L.)
57415.06659 16×300s R 20.08±0.15
also significantly detected. All the observed lines were well fit-ted by the multiple hot ionized plasma models (MEKAL) used to fit
the EPIC-pn spectra (see Section 5.2). In particular, in the RGS spectrum of the secondXMMobservations we identified the lines corresponding to: MgXIIH-like Lymanαat 8.42 Å, NeXH-like
Lymanαat 12.13 Å, NeIXHe-like w-resonance at 13.45 Å, OVIII
H-like Lymanα(18.97 Å) andβ(16.01 Å), and a triplet of He-like OVIIcentred at 21.60 Å (see Fig.3).
In order to test possible signs of variability among the most prominent lines between the maximum and minimum of the 1.64-h X-ray modulation, we fitted t1.64-he two p1.64-hase-resolved RGS data sets (merging data of both observations) with an absorbed power-law plus two Gaussian functions with energies fixed at 21.60 Å
(0.57 keV) and 18.97 Å (0.65 keV), and with all spectral parameters forced to be the same except for the normalizations. The equivalent width of the OVII line is 64+−3417 eV in the RGS spectrum at the
maximum of the modulation, while only an upper limit of<62 eV (at 90 per cent) could be derived in the RGS spectrum at the minimum of the 1.64-h modulation. Similarly, the equivalent width of the OVIIIline is 33+−613eV in the RGS spectrum at the maximum, and
we derived an upper limit of<69 eV at the minimum. No significant phase-dependent variability was detected in the emission lines, and the oxygen lines are well reproduced by the lowest-temperature (∼0.2keV)MEKALcomponent.
5.4 Long-term X-ray light-curve
The long-term light-curve of RX J0838−2827 presented in Fig.4
was extracted after fitting allSwift/XRT spectra with an absorbed power-law model, with the absorption column density fixed to the value derived from the fits of theXMM–Newton data (the lower counting statistics of the XRT data precluded a more detailed mod-elling as carried out for the EPIC data sets). We obtainedχ2
ν =1.13 for 203 degrees of freedom. We believe that the large scatter in the flux values clearly visible in the figure (especially in the most recent observations) is probably because the short exposures of the observations (see Table1) have sampled the source∼54-ks cycle at random phases. However, the long-term light-curve indicates that no substantial variation has been observed in the source X-ray flux for the last 6 yr.
5.5 Results from optical observations
The optical spectra of RX J0838−2827 (see Fig.7) are dominated by prominent emission lines such as Hβ, HeI(λ4471, 4919, 5015), HeII(λλ4686) and possibly Bowen-blend NIII(λ4634–41)/CIII(λ
4647–50). No significant absorption feature is detected, in agree-ment with the findings of Masetti et al. (2013).
Among the emission features detected, Hβis the most prominent. In the individual spectra we found no evidence for a double-horned profile (usually interpreted as a signature for an accretion disc). The line profile is, however, clearly asymmetric. We tried to model the Hβline with a set of multiple Gaussians and found a reasonable solution using three Gaussians plus a constant: in Fig.12we show the velocities of these three components. The Hβline consists of a narrow (FWHM=11 Å∼680 km s−1), a broad (FWHM∼30 Å∼
1900 km s−1) and a very narrow (FWHM∼6 Å∼370 km s−1)
component, the latter statistically detected in only a few spectra (see Fig.12). The large width of the broad component indicates that it is probably formed in the magnetically confined accretion flow, with the narrow one probably forming in the ballistic trajectory of the accretion stream, and the very narrow one in the irradiated hemi-sphere of the donor star. These components are generally observed in polars, and particularly in asynchronous polars (see e.g. Schwarz et al.2005).
Fits to the radial velocity measurements for each line were first attempted using a constant and a sinusoidal function (see Fig.12). We here use the radial velocities as derived for the Hβ narrow and broad components, and the radial velocity measurements of the other emission lines obtained through a single Gaussian. A fit with a constant plus a single sinusoidal function never pro-vided a satisfactory result in terms of reducedχ2. We then tried
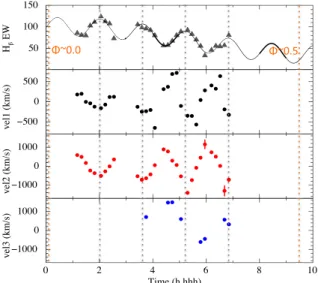
Figure 12. Equivalent width of the Hβ line (top panel), and velocities of three Hβcomponents as a function of time as observed from ESO-NTT. Vertical dashed lines represent the phases 0 and 0.5 of the 15.2-h modulation (orange), and the maxima of the 1.64-h orbital modulation (grey).
P3=P3, XMM2=1.47 h (fixed) (see Fig.12). We measured the
fol-lowing P1 periods: 1.75± 0.05 h (Hβ, first velocity,χν2/dof=
1.40/21), 1.72 ± 0.05 h (Hβ, second component, χ2
ν/dof= 0.71/21), 1.53±0.01 h (HeI4480 Å,χν2/dof=0.67/20), 1.48
± 0.01 ks (HeI4920 Å,χν2/dof=4.53/20), and 1.66±0.04 h
(HeI5020 Å,χν2/dof=0.61/20). From the first Hβcomponent,
we were able to derive some constraints on the amplitudes:A0=
−(4±1)×102km s−1,A
1=(4.2±0.5)×102km s−1,A2=(6.3
±1.6)×102km s−1,A
3=(1.7±0.3)×102km s−1. This
multi-sinusoidal representation indicates that, in addition to the orbital modulation (with an amplitude of about 400 km s−1, see Fig.8),
a fast-moving high-velocity component shifting from a maximum of about+1100 to−1200 km s−1may be caused by the ballistic
accretion stream, which also changes along the beat cycle. For each spectrum, we also measured the equivalent width (EW) of the Hβand HeIemission lines. We found evidence for significant EW variability, as also observed for the optical flux measured by our IAC-80 andXMM–Newton/OM observations (see e.g. Fig.2, right panel, bottom). The EW of all emission features seems to be modulated over the 1.64-h and 15.2-h periodicities, the orbital period and the long-term beat periodicity (see Fig.12). Because the spectral line EW is a proxy of the source optical flux, such findings are not unexpected.
The NTT data consist of short exposures of∼500 s each, spanning only a few cycles of the orbital modulation at 1.64 h, for a total observation time of ∼6 h (see Figs 8and 12). For this reason, when fitting theses data with the multicomponent models used in Section 5.1, we heldP2andP3at theXMM–Newtonvalues measured
during the second observation.
Because of the very sparse sampling, long data gaps and short exposures, the IAC80 photometric data are of limited help in con-straining the model and/or refining the periods. So, we fixedP1=
P1, XMM2=1.64 h andP3=P3, XMM2=1.47 h (the three-sine model
also provides a much better fit for the IAC80 data than the two-sine model). In this way, for the long modulation we foundP2, B 15.1 h
from theB-filter data andP2, R 15.2 h from theR-filter data.
6 T H E T W O OT H E R X - R AY S O U R C E S I N T H E F I E L D : X M M J 0 8 3 8 5 0 . 4−2 8 2 7 5 9 A N D
X M M J 0 8 3 8 4 2 . 7−2 8 3 8 3 2
Of the two additional X-ray sources within the field of the mCV, XMM J083850.4−282759 can be identified in the USNO A2 Catalogue at RA=08h38m50.s4, Dec.= −28◦2756.7 (J2000.0)
withR = 18.0 andB = 20.6, and XMM J083842.7−283832 is catalogued in the Wide-field Infrared Survey Explorer (WISE;9
Wright et al.2010) as WISE J083842.77−282830.9. Its position is RA=08h38m42.s777, Dec.= −28◦2830.99 (J2000.0), and it
has optical magnitudes in the USNO B1 Catalogue ofB1∼19.66,
B2∼18.49,R2∼19.02 andI∼18.01.
We carried out a detailed X-ray spectral and timing analysis for both sources. XMM J083850.4−282759 appears to be variable in the X-ray (see the values for the root mean square fractional variation and fluxes in Table 4), and showed a flare lasting for
∼600 s with a structured morphology in the second observation (see Fig.6).10 For both sources, spectra of the two observations
were fitted together with an absorbed power-law model, and the absorption column density was tied up across the data sets (for the case of XMM J083850.4−282759 both the flare and quiescent spectra were extracted). The best-fitting parameters are reported in Table4. The steady emission of XMM J083850.4−282759 is brighter during the second observation by a factor of∼5, while showing the flaring episode, and its spectrum is slightly harder than in the first observations. In contrast, XMM J083842.7−283832 appears to be steady during the X-ray observations.
7 D I S C U S S I O N
Our multiband study of the field of 3FGL J0838.8−2829 re-vealed two variable X-ray sources: RX J0838−2827 and XMM J083850.4−282759. Here we discuss our results and the nature of these two intriguing objects.
7.1 RX J0838−2827: an asynchronous magnetic CV
RX J0838−2827 has been shown to be highly variable on short and long time-scales with a complex behaviour. In particular, we detect two dominant periodicities, at 1.64 h and 15.2 h in the power spectrum, as well as a 1.47-h peak, which has about half the power of the 1.64 h one (see Fig.9). These are remarkably well correlated, as the long periodicity is found at precisely the beat between the two shorter ones. These characteristics and their time-scales are uncommon in other variable X-ray sources, such as the LMXBs, but are consistent with those observed in CVs of the magnetic type. The close 1.64-h and 1.47-h periods, if inter-preted as the binary orbital period and the rotational period of the WD, givePspin/Porb∼0.90. The location of RX J0838−2827 in the
spin–orbit period plane of mCVs is shown in Fig.13, and strongly suggests that this system is close to, but not right at, synchro-nism. We therefore have identified either one of the slowest-rotating IPs (see also Coti Zelati et al.2016) or a highly de-synchronized polar. Other weakly asynchronous magnetic systems with similar spin–orbit ratios are Paloma withPspin/Porb∼0.93 (Schwarz et al. 2007), and IGR J19552+0044 withPspin/Porb∼0.82 (Bernardini
et al. 2013). The other four confirmed asynchronous polars
9Seehttp://wise2.ipac.caltech.edu/docs/release/allsky/
10A careful analysis of the background light-curve excludes a background
Table 4. Positions, pn count rates and spectral fit results for the X-ray sources within the error box of 3FGL J0838.8−2829. The source numbering is as shown in Fig.6. The pn spectra were fitted to theTBABS*PEGPWRLWmodel in the energy range 0.2–10 keV. Uncertainties are quoted at a 90 per cent confidence
level for a single parameter of interest, whereas upper limits are given at the 3σ confidence level. (q) and (f) refer to the quiescent and flaring states of XMM J083850.4−282759, respectively, during the second observation.
Source Obs ID RA Dec. Count ratea rmsb NH Unabs. fluxa χ2
ν(dof) (J2000.0) (×10−3s−1) (1021cm−2) (10−14erg cm−2s−1)
XMM J083850.4−282759 0764420101 08h38m50s.40 −28◦2759.04 16.7±0.9 0.37±0.06 0.3±0.2 1.6±0.2 8±1 0.97 (63)
0790180101 74±2 (q) 1.23±0.07 tied 1.15±0.08 (q) 38±3 (q) 1223±82 (f) tied 1.3±0.2 (f) 550±90 (f)
XMM J083842.7−283832 0764420101 08h38m42s.72 −28◦2832.52 22.1±0.9 <0.18 1.1±0.3 1.9±0.2 11.1±0.9 0.94 (27)
0790180101 14.8±0.8 <0.17 tied 2.1±0.2 8.6±0.9
Notes.aIn the 0.2–10 keV energy range.
bRoot mean square fractional variation, determined by applying the
LCSTATS(v. 1.0) tool ofXRONOSon the 0.2–10 keV background-subtracted and
exposure-corrected light-curves from the pn camera with a binning time of 400 s.
Figure 13. Orbital and spin periods of polars (grey dots), pre-polars (dark grey circles), and IPs (red triangles) known to date, with the values derived for RX J0838−2827 shown as a blue star. The dot–dashed line represents
Pspin=Porb. Data adapted from Ferrario, de Martino & G¨ansicke (2015).
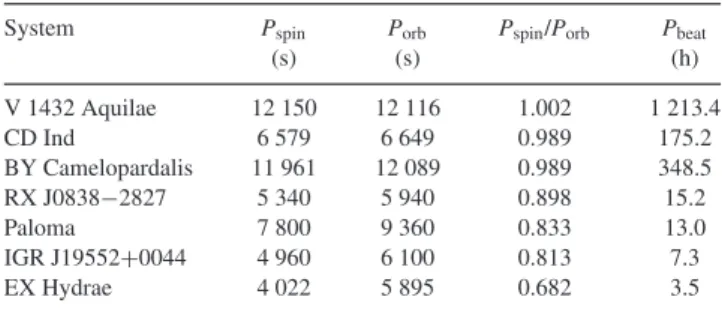
Table 5. Main properties of the slightly desynchronized mCVs currently known (in order of increasing degree of asynchronism).
System Pspin Porb Pspin/Porb Pbeat
(s) (s) (h)
V 1432 Aquilae 12 150 12 116 1.002 1 213.4
CD Ind 6 579 6 649 0.989 175.2
BY Camelopardalis 11 961 12 089 0.989 348.5
RX J0838−2827 5 340 5 940 0.898 15.2
Paloma 7 800 9 360 0.833 13.0
IGR J19552+0044 4 960 6 100 0.813 7.3
EX Hydrae 4 022 5 895 0.682 3.5
Notes.∗The listed values are taken from: V 1432 Aquilae, Mukai et al. (2003); CD Ind, Myers et al. (2017); BY Camelopardalis, Silber et al. (1997); RX J0838−2827, this study; Paloma, Joshi et al. (2016); IGR J19552+0044, Bernardini et al. (2013); EX Hydrae, Mauche et al. (2009).
are only very slightly de-synchronized (Pspin/Porb > 0.98; see
also Fig.5).
Folding the X-ray light-curve at the 1.64-h period (see Fig.10; or at the 1.47-h period) the shape is almost flat-topped, closely re-sembling the shapes observed in strongly magnetic polar systems (Cropper 1990), where the modulation is caused by the
self-occultation of the accretion pole as the WD rotates. The spectrum is thermal, requiring three optically thin emitting regions with tem-peratures of 0.2, 1 and 14 keV, highly absorbed by dense partial (∼70 per cent) covering material (∼2×1024cm−2). The spectral
characteristics also closely resemble those observed in magnetic CVs, both polars and IPs (e.g. Ramsay & Cropper2004; Bernardini et al.2012). The lack of spectral changes (except for the normal-ization) at the∼1.6–1.5 h periods is consistent with the spectral behaviour seen in polars owing to the self-occultation of the main accreting pole, while IPs instead show highly variable absorption along the spin period. Furthermore, and in contrast to many polars, RX J0838−2827 does not show any evidence of a soft optically thick (blackbody) component. This component originates from the reprocessing of hard X-rays and cyclotron radiation in the WD po-lar regions. The presence of this component was for a long time considered ubiquitous in polars, until recent observations showed that this is not necessarily so (Ramsay & Cropper2004). On the other hand, IPs have typically hard spectra, and the recent identifi-cation of a soft blackbody component in about 30 per cent of these systems (Anzolin et al.2008; Bernardini et al.2012) does not make these characteristics an identifying feature of one or the other type of mCVs.
The long observations acquired withXMM–Newtonhave allowed an unprecedented monitoring of RX J0838−2827, revealing a re-markable long-term 15.2-h X-ray modulation that repeats itself in the two observations taken 1.5 months apart, which we naturally interpret as the beat period between the 1.64- and 1.47-h period-icities. The spectrum changes mainly in the normalizations of the optically thin components and in the temperature of the warmer plasma, but not in the partial absorption components. This further strengthens our interpretation that this variability is not the orbital period because the orbital X-ray variability in the asynchronously rotating IPs is found to be caused by absorbing material fixed in the binary frame, such as the hotspot at the rim of an accretion disc or eclipses in high-inclination systems (see Parker, Norton & Mukai
half-beat cycle. The weaker modulations at the 1.47- and 1.64-h periods at about half the 15.2-h beat period indicate that there is pole-switching in RX J0838−2827.
In particular, disc-less models predict the dominance of the beat and of the orbital frequencies and a much lower or even undetectable spin peak in the power spectrum in configurations of moderately high values of the binary inclination angle (i) and magnetic colati-tude (m), provided thati+m>90o+β, whereβis the pole-cap
opening angle (Wynn & King1992). The presence of lower peaks at sidebands depends on the pole-switching effect that modulates the light-curve. Furthermore, the power of the spin peak is dependent on the degree of asymmetry, with strong asymmetries producing weaker spin pulsations (Wynn & King1992). This appears to be the case in RX J0838−2827. In addition, the slope of the beat modula-tion depends on the transimodula-tion times of accremodula-tion flipping onto the two poles, and thus the almost smooth variability at the 15.2-h pe-riod would indeed indicate that the stream from the donor star does not switch between the two poles instantaneously. We further note that a largeβtends to produce either sinusoidal or flat-topped light curves, indicating that accretion in RX J0838−2827 occurs over wide areas of the WD poles. Furthermore, the faint phase of the modulation at the 1.64-h (or 1.47-h) period (see Fig.10) observed at beat maximum lasts∼0.3. This can be used to estimate the ranges of binary inclinationiand magnetic colatitudem(Cropper1990), as coti=cos(πδφ) tan(m), whereδφis the length of the faint phase. Moreover, the lack of X-ray eclipses restrictsi75◦. We then find 24◦m59◦for 10◦i75◦. A detailed modelling of accretion regions is, however, beyond the scope of this work and will be the subject of a future publication. Flipping accretion configurations are probably also occurring in other asynchronous systems such as Paloma (Schwarz et al.2007), BY Cam (Piirola et al.1994), CD Ind (Ramsay et al.1999) and V1432 Aql (Mukai et al.2003). In the latter system, the hard X-ray emission is found to be dominated by the orbital variability along the beat cycle, while the X-ray spin vari-ability is almost undetected in a longBeppoSAXobservation (Mukai et al.2003) and with complex structure inXMM–NewtonandRXTE
observations (Rana et al.2005).
The short orbital period of RX J0838−2827 puts this mCV be-low the 2–3-h orbital period gap of CVs, where most polars are found (Ferrario et al.2015; see also Fig.13). An orbital period of 1.64 h (98 min) is close to that of the IP EX Hya, which is also (but not so weakly) de-synchronized (Pspin ∼ 67 min). Its spin–orbit
period ratio (Pspin/Porb=0.68), similar to that of the few IPs found
below the gap, could indicate that these systems will never reach synchronism (see Norton et al. 2004). Regarding the other two weakly de-synchronized mCVs, Paloma and IGR J19552+0044, they are both short-period systems. The former, with a 157-min orbital period, falls inside the orbital period gap, and the second, with a 101-min orbital period, is below the gap. They are proba-bly in a transition stage before reaching synchronism, and are thus believed to be polar progenitor candidates. On the other hand, the four asynchronous polars are less de-synchronised. Synchroniza-tion time-scales of∼170 and∼200 yr were found in V1500 Cyg (Harrison & Campbell2016) and V1432 Aql (Staubert et al.2003), respectively, suggesting that the cause was probably a nova explo-sion in the past. The lack of nova shells around the four systems is not, however, evidence against the nova interpretation, because many old novae do not show such relics (Pagnotta & Zurek2016). Therefore, given the closer similarities of spin–orbit period ratios to Paloma and IGR J19552+0044, rather than to the four asyn-chronous polars, we suggest that RX J0838−2827 is in a similar evolutionary stage. A spectro-polarimetric study will provide tight
constraints on the magnetic field and geometry of this new interest-ing mCV and its evolution.
7.2 XMM J083850.4−282759: a candidate transitional millisecond pulsar?
The identification of RX J0838−2827 as an asynchronous polar ar-gues against its identification as a possible counterpart of theFermi -LAT gamma-ray source 3FGL J0838.8−2829, because emission at
∼GeV energies has to date never been reported from CVs. One possibility might be that the gamma-ray emission is associated with one of the two faint X-ray sources detected in theFermi-LAT error circle.
As reported in Table4, the absorption column density derived from the X-ray spectrum of XMM J083850.4−282759 isNH ∼
3×1020cm−2, about one order of magnitude lower than the total
Galactic value in the direction of the source. Assuming that the full observed column density contributes to the optical/near-infrared absorption, we estimate a colour excessE(B−V)=0.05 mag (using theNH/E(B−V) conversion of Predehl & Schmitt1995). From the
results of our optical and near-infrared photometry (Sections 3.1 and 3.3), we obtain for this source a de-reddenedB−Rcolour in the range 1.5–2.5 mag (taking into account the source variability and the uncertainties in the photometry) andH−K=0.3±0.2 mag, broadly consistent with a late-type K2–M5 main sequence star. Under this hypothesis, using the distance modulus, the constraints on the source distance are very broad, ranging from 0.7 (M5) to 6.2 (K2) kpc.
In light of the observed colours, a coronal flare from an M-type star could be an explanation for the brightening observed in theXMM–NewtonX-ray and optical light curves shown in Fig.6. However, considering the inferred distance, the average X-ray flux (∼8.5×10⁻¹⁴ erg cm−2s−1in the range 0.2–10 keV, excluding
the flare) would translate into a luminosity of 5×1030 <L X<
4×1032 erg s−1, which is too high for an active M-type star in
‘quiescence’ (see e.g. Stelzer et al.2013).
An interesting possibility is the association of 3FGL J0838.8−2829 with the X-ray-variable source XMM J083850.4−282759, as a possible transitional millisecond pulsar (Archibald et al.2009; Papitto et al.2013). Such sources are often found in a subluminous disc state characterized by enhanced X-ray variability between a high and a low flux level that differ by a factor of∼10, and often show occasional flaring activity on time-scales of several minutes (de Martino et al.2013; Bogdanov et al.
2015), as we observe from XMM J083850.4−282759. A relatively bright emission is also observed at gamma-ray (de Martino et al.
2010; Stappers et al.2014; Li et al.2014), optical (de Martino et al.
2013; Bogdanov et al.2015) and radio (Hill et al.2011; Deller et al.2015) wavelengths. Even though the absence of an ATCA radio detection from XMM J083850.4−282759 does not favour its identification as a transitional millisecond pulsar, the non-detection of a radio source might be compatible with a larger distance of the putative pulsar. In this respect, we note that the gamma-ray flux of 3FGL J0838.8−2829 (∼10−9ph cm−2s−1in the 1–100 GeV band;
Acero et al.2015), and its average X-ray flux (∼8.5×10⁻¹⁴ erg
cm−2s−1in the 0.2–10 keV band) are∼10 and 100 times smaller,
also in agreement with results for other binary millisecond pulsars observed byFermi-LAT (Acero et al.2015).
The detection of optical/near-infrared emission from a late-type companion star, as inferred from the observed colours, would sug-gest a redback system observed in the radio pulsar state. The con-straints on the X-ray luminosity reported above would be in agree-ment with such a scenario. However, without knowing the orbital period, the strength of possible irradiation effects, the companion spectral type and the system distance, all the above considerations should be taken with some caution, and alternative scenarios (e.g. a black-widow system) cannot be ruled out.
AC K N OW L E D G E M E N T S
The scientific results reported in this article are based on observa-tions obtained withXMM–NewtonandSwift.XMM–Newtonis an ESA science mission with instruments and contributions directly funded by ESA member states and the National Aeronautics and Space Administration (NASA).Swiftis a NASA mission with the participation of the Italian Space Agency and the UK Space Agency. This research has made use of softwares and tools provided by the High Energy Astrophysics Science Archive Research Center (HEASARC), which is a service of the Astrophysics Science Divi-sion at NASA/GSFC and the High Energy Astrophysics DiviDivi-sion of the Smithsonian Astrophysical Observatory. The research has also made use of data from the Two Micron All Sky Survey, which is a joint project of the University of Massachusetts and the Infrared Processing and Analysis Center/California Institute of Technology, funded by NASA and the National Science Foundation. We also made use of data products from the Wide-field Infrared Survey Ex-plorer, which is a joint project of the University of California, Los Angeles, and the Jet Propulsion Laboratory/California Institute of Technology, funded by NASA. The CANICA project is funded by the CONACyT grant G28586-E (PI: Luis Carrasco). This research is based on observations collected at the European Organization for Astronomical Research in the Southern Hemisphere under ESO program 296.D-5034 (PI: Rea). The results reported in this article are also based on observations made by the Australia Telescope Compact Array (ATCA), which is part of the Australia Telescope National Facility that is funded by the Australian Government for operation as a National Facility managed by CSIRO. This article also uses observations made with the IAC80 operated on the island of Tenerife by the IAC in the Spanish Observatorio del Teide. We are grateful to the XMM-Newton, ESO and ATCA Directors for awarding us their proprietary Director’s Time.
We thank Elisa Costantini for useful discussion, and gratefully acknowledge the referee for his/her useful comments and sugges-tions. NR, FCZ, PE and AB are supported by the NWO Vidi Grant A.2320.0076 and by the European COST Action MP1304 (New-COMPSTAR). NR, FCZ, DFT, EdOW and JL are also supported by grants AYA2015-71042-P and SGR2014-1073. FCZ, DFT, AP, EB and CF acknowledge the International Space Science Institute (ISSI-Bern), which funded and hosted the international team ‘The disc-magnetosphere interaction around transitional millisecond pul-sars’. DdM acknowledges support from INAF–ASI I/037/12/0. AP acknowledges support via an EU Marie Skłodowska Curie fellow-ship under grant no. 660657-TMSP-H2020-MSCA-IF-2014. MH is supported by grants ESP2015-66134-R, SGR2014-1458 and FEDER funds. ML and JC acknowledge support by the Span-ish grant AYA2013-42627. ML is also supported by EU’s Hori-zon 2020 programme through a Marie Sklodowska-Curie Fel-lowship (grant no. 702638). JC also acknowledges support by
the Leverhulme Trust through the Visiting Professorship Grant VP2-2015-046.
R E F E R E N C E S
Acero F. et al., 2015, ApJS, 218, 23
Alpar M. A., Cheng A. F., Ruderman M. A., Shaham J., 1982, Nature, 300, 728
Anzolin G., de Martino D., Bonnet-Bidaud J.-M., Mouchet M., G¨apnsicke B. T., Matt G., Mukai K., 2008, A&A, 489, 1243
Archibald A. M. et al., 2009, Science, 324, 1411 Archibald A. M. et al., 2015, ApJ, 807, 62
Arnaud K. A., 1996, in Jacoby G. H., Barnes J., eds, Astronomy Society of the Pacific Conference Series Vol. 101, Astronomical Data Analysis Software and Systems V. Astron. Soc. Pac., San Francisco, p. 17 Bassa et al., 2014, MNRAS, 441, 1825
Bernardini F., de Martino D., Falanga M., Mukai K., Matt G., Bonnet-Bidaud J.-M., Masetti N., Mouchet M., 2012, A&A, 542, 22
Bernardini F. et al., 2013, MNRAS, 435, 2822
Blackburn J. K., 1995, in Shaw R. A., Payne H. E., Hayes J. J. E., eds, Astronomy Society of the Pacific Conference Series Vol. 77, Astronom-ical Data Analysis Software and Systems IV. Astron. Soc. Pac., San Francisco, p. 367
Bogdanov S. et al., 2015, ApJ, 806, 148
Boyd D. et al., 2014, Soc. Astron. Sci. Ann. Symp., 33, 163 Burrows D. N. et al., 2005, Space Sci. Rev., 120, 165 Campbell C. G., Schwope A. D., 1999, A&A, 343, 132 Coti Zelati F. et al., 2016, MNRAS, 456, 1913 Courvoisier T. J.-L. et al., 2003, A&A, 411, 53 Cropper M., 1990, Space Sci. Rev., 54, 195 De Luca A., Molendi S., 2004, A&A, 419, 837 de Martino D. et al., 2010, A&A, 515, A25 de Martino D. et al., 2013, A&A, 550, 89 de Martino D. et al., 2014, MNRAS, 444, 3004 Deller A. T. et al., 2012, ApJ, 756, L25 Deller A. T. et al., 2015, ApJ, 809, 13 den Herder J. W. et al., 2001, A&A, 365, L7
Ferrario L., de Martino D., G¨ansicke B. T., 2015, Space Sci. Rev., 191, 111 Halpern J. P., Bogdanov S., Thorstensen J. R., 2017, ApJ, 838, 124 Harrison T. E., Campbell R. K., 2016, MNRAS, 459, 4161
Hill J. E. et al., 2004, in Flanagan K. A., Siegmund O. H. W., eds, Proc. SPIE Conf. Ser. Vol. 5165, X-Ray and Gamma-Ray Instrumentation for Astronomy XIII. SPIE, Bellingham, p. 217
Hill A. B. et al., 2011, MNRAS, 415, 235
Joshi A., Pandey J. C., Singh K. P., Agrawal P. C., 2016, ApJ, 830, 56 Lebrun F. et al., 2003, A&A, 411, 141
Li K. L., Kong A. K. H., Takata J., Cheng K. S., Tam P. H. T., Hui C. Y., Jin R., 2014, ApJ, 797, 111
Linares M., 2014, ApJ, 795, 72L Lund N. et al., 2003, A&A, 411, 231 Masetti N. et al., 2013, A&A, 559, 58 Mason K. O. et al., 2001, A&A, 365, L36
Mauche C. W., Brickhouse N. S., Hoogerwerf R., Luna G. J. M., Mukai K., Sterken C., 2009, Inf. Bull. Var. Stars, 5876, 1
Mukai K., Hellier C., Madejski G., Patterson J., Skillman D. R., 2003, ApJ, 597, 479
Myers G. et al., 2017, PASP, 129, 4204
Norton A. J., Wynn G. A., Somerscales R. V., 2004, ApJ, 614, 349 Pagnotta A., Zurek D., 2016, MNRAS, 458, 1833
Papitto A., Torres D. F., 2015, ApJ, 807, 33 Papitto A. et al., 2013, Nature, 501, 517
Papitto A., Torres D. F., Li J., 2014, MNRAS, 438, 2105
Papitto A., de Martino D., Belloni T. M., Burgay M., Pellizzoni A., Possenti A., Torres D. F., 2015, MNRAS, 449, 26
Parker T. L., Norton A. J., Mukai K., 2005, A&A, 439, 213