New tools in dry eye disease research: a more efficient clinical trial design using controled environment and molecular biomarkers, and a new clinical questionnaire
284
0
0
Texto completo
(2)
(3)
(4)
(5)
(6)
(7) Agradecimientos / Acknowledgments Al fin abordo este último punto de mi tesis doctoral. Parecía que no llegaría este momento, pero ha llegado, como no podía ser de otra manera. Han pasado 8 años desde que pisé por primera vez el IOBA, tiempo más que suficiente para haber crecido tanto intelectualmente como físicamente (nos hacemos mayores…), pero sobre todo para considerar el Instituto como “mi casa” y, por lo tanto, sentir a las personas que allí “viven” como “mi familia”. Por ello, con estas líneas quiero expresar mi agradecimiento a todos ellos. En primer lugar, a mis tres “madres”, las doctoras Margarita Calonge, María Jesús González y Amalia Enríquez de Salamanca. He de confesar que en principio me asustaba la idea de tener tres directoras de Tesis, por los problemas que ello pudiera generar (ya sabéis, diferentes criterios, correcciones sobre correcciones, etc…), sin embargo, ha funcionado mucho mejor de lo que yo esperaba. Mil gracias a las tres por todo. Gracias María por abrir en 2009 las puertas del IOBA a aquel alumno que se interesó acerca de qué era eso de la investigación que nos contabas en clase. Desde entonces hasta ahora he aprendido infinidad de cosas y espero no haber defraudado la confianza que en mi depositaste. Gracias Amalia por el esfuerzo que has tenido que realizar para hacer que un óptico como yo entienda, al menos, cuáles son las moléculas “buenas” y las “malas”. Prometo seguir estudiando. Gracias Marga, en mayúsculas. Por las palabras de ánimo en los momentos bajos. Por tu implicación absoluta a pesar de que a tus días les falten horas. Por ser un motor, ya que si tú das el 100% no hay excusa para que los que somos más pequeñitos no demos el 120%. Os reitero a las tres mi agradecimiento más sincero. En segundo lugar, quiero agradecer al profesor José Carlos Pastor y al doctor Miguel Maldonado, los “patriarcas” de esta gran familia que es el IOBA. Jefe, aunque nos separe el factor de que mi trabajo haya versado sobre cosas importantes del ojo y usted se dedique a la retina, quiero que sepa que es usted.
(8) Agradecimientos un ejemplo para mí. Gracias por inculcarnos la cultura del esfuerzo y por hacer del IOBA lo que hoy es. Miguel, en primer lugar, enhorabuena por el cargo y, en segundo lugar, gracias por el interés que has mostrado por mi proyecto cada vez que hemos tenido ocasión de hablar unos minutos. Gracias también a la Doctora Yolanda y a Ana Rodríguez. Os nombro al mismo tiempo porque soy plenamente consciente de que juntas es como habéis sufrido la avalancha de Tesis Doctorales este año. Gracias por vuestro esfuerzo. Yolanda, quiero además agradecerte todos los consejos que me has dado a lo largo de este tiempo. Ana, que decirte. Que no está pagado el trabajazo que haces y todo lo que nos ayudas. Mil gracias!!!! En toda familia los hermanos mayores son el espejo en el que los hermanos pequeños nos fijamos, y como la familia del IOBA es numerosa quiero agradecerles a todos ellos. Al doctor Alberto López Miguel, el hermano “picón”. Aunque disfrutas metiendo puyas a tus hermanos pequeños, en el fondo sabemos que nos quieres. Muchísimas gracias por todo el esfuerzo, la implicación absoluta en la tesis, la ayuda con las publicaciones, las conversaciones, los consejos, etc… Pero sobre todo por ser un líder y un modelo a seguir. A las doctoras Itziar Fernández y Teresa Nieto, las hermanas listas. Itziar, al igual que me pasa con Alberto, si te agradezco todo lo que te mereces me quedo sin espacio. Tu trabajo, consejos y apoyo han sido imprescindibles para el desarrollo de esta Tesis. Mil gracias por tu confianza y por desentrañarme un poco los misterios de la estadística. Gran parte de esta Tesis es gracias a ti. Teresa, aun corriendo el riesgo de que me llames pelota quiero que sepas que incluso sin quererlo eres un ejemplo de saber hacer y saber estar. Intentaré copiarte para cuando sea mayor. También me gustaría agradecer a Francisco Blázquez, al doctor Fernando Ussa, y a Miguel Ángel García, los hermanos responsables. Paco, gracias a ti he aprendido a hacer las cosas como hay que hacerlas. Gracias también por todo el apoyo logístico y tecnológico. Fer, gracias por ser un ejemplo de cómo ha de actuar un clínico. Con que mis pacientes hayan estado conmigo la mitad de satisfechos de lo que los tuyos están contigo me doy por contento. ¡Y, sobre todo, gracias por.
(9) Agradecimientos Minette! Miguel Ángel, gracias por tu trabajo para hacer de esa casa un lugar mejor. Gracias a los tres por vuestro apoyo y por las conversaciones compartidas. Y finalmente gracias al doctor Roberto Reinoso por interesarte por mi presente y mi futuro. Eres la muestra de que en tierras leonesas también nace gente bien maja. Y como no, gracias al hermano revoltoso, Carlos Matesanz. Charli, como tú mismo dirías, eres la hostia. Mil gracias por las risas y las conversaciones, ¡y por mantener en pie el edificio! Una de las partes más importantes para mí en estos agradecimientos es la dedicada a los “hermanos pequeños” que he tenido durante todos estos años. Dicen que donde hay niños hay alegría, y en esta familia metafórica no puede ser más cierto. Vosotros y vosotras habéis conseguido que incluso en los momentos malos haya ido a trabajar con ganas, aunque únicamente fuera para compartir 15 minutos de café. Gracias a los hermanos que aún viven en casa de los padres. Lau, te odio y te quiero a partes iguales (aunque el odio sea de mentirijilla). Juan, podríamos considerarte un hermano adoptado. Sigue imitándome y te irá bien en la vida. Gracias por vuestra amistad y recordad que siempre tendréis una cama pequeña en nuestra casa. Marina, estoy escribiendo esto a 48 h de tu boda. ¿Te has enterado de que te casas? ;-P Gracias por aguantarme. Mario (alias Mairon), eres tan buena persona como jugador de comunio, lo cual es mucho decir. Jesús, eres tan buena persona como la inversa de tus capacidades como jugador de comunio, lo cual también es mucho decir. Gracias. Paz, Antonio, lo tengo que decir, sin vosotros se desmonta el chiringuito. Mil gracias por vuestro esfuerzo y ayuda. Paz, gracias por ayudarme con las historias clínicas en momentos de crisis. Antonio, gracias por enseñarme a destruir lentes de contacto para sacar el liquidillo. Se os quiere. ¡Hala Madrid! Gracias también a las hermanas recién nacidas (Amanda, Cristina, Elena, Mari Luz), que sepáis que no moláis tanto como los más grandes, pero también sois bastante majas. Seguid así. Eva, gracias por meternos el gusanillo runner. A por la maratón. También quiero dar las gracias a los hermanos que ya volaron del nido. Doc, Anita, Isita, Laura, Toni, Vicen, Martino, Marisa, Esther con H, Noe. Aunque dejasteis el hogar hace tiempo se os.
(10) Agradecimientos sigue sintiendo cerca. Eso significa que dejasteis huella y es un placer seguir en contacto con todos vosotros. Esperemos no perderlo nunca. A todos y cada uno de estos “hermanos/as pequeños/as” os quiero agradecer vuestra amistad, las risas, las confidencias. Vuestro calor en los buenos y en los malos momentos. Y, sobre todo, vuestra paciencia para aguantarme. Mil gracias y recordad que “no hay un grupo tan genial”. No creáis que me he olvidado de Carmen y Albertito. Simplemente os he sacado del grupo por vuestra implicación en esta tesis. Carmen, gracias de corazón por todo tu esfuerzo. La mitad de un capítulo es tuyo. Gracias por todo ese trabajo a la sombra que haces (tú u otras personas) y sin el cual no creo que pudiéramos continuar. Albertito, gracias por tu colaboración con la parte clínica de la Tesis. Un placer haber compartido tantos momentos contigo desde que entramos en Óptica. Cuida del Contact Team ahora que eres el “viejo” del grupo. Me gustaría agradecer también a la “abuela” de la familia. Nieves, gracias por hacer grupo organizando las fiestas. Eres muy grande. Y a los familiares de fuera. I also would like to thank Dr. Philipp Steven for the chance to do my stay in his research group, which has been one of the best experiences of my life. Philipp, thank you for your help during my stay, for opening me your house and for making me feel as at home. It has been an honor and a privilege for me to work with you. I really appreciate your involvement in this project. In addition, I want to send many thanks for the entire group (Jens, Uta, Sebastian, etc…) and for the rest of the members of the FOR2240, for letting me belong as a member of this group. Dr. Stern, I also would like to thank you for your direct and indirect support. Without your FML and the chamber this project wouldn´t have been possible. Thank you very much. Por último, quiero agradecer a la familia de fuera del IOBA. A mis abuelos, porque soy quien soy en parte gracias a lo que ellos me han transmitido. Sé que mi abuela se sentirá orgullosa de mí, y mi abuelo, allá donde esté, también lo hará. A la familia postiza. Jose, Mila, Jorge, Rebe, Patricia, Germanes. Gracias por vuestro apoyo y por vuestro cariño. Por incluirme en vuestras vidas y.
(11) Agradecimientos compartirla conmigo. Y también a mis amigos más cercanos, los que estáis siempre y a los que os considero familia aunque no tengamos lazos de sangre. Oscar, Luismi, Pablo, Bruno, miembros del Núcleo Duro. Se les quiere. Y cómo no, a los Pentapolares. Sois mala gente, odiosos, raros y, aun así, sois los mejores. Lloramos y reímos juntos, incluso al mismo tiempo si hace falta. Y que siga siendo así siempre, porque eso es muuuy Pentapolar. Muchas gracias por hacerme sentir uno de vosotros. Que me ha dado el IOBA. Pues todo. Experiencias, conocimiento, amigos. Pero algo destaca por encima de todo. Tú. Al IOBA le debo el haberte conocido y haber iniciado un nuevo proyecto. Más largo que una Tesis y quizá más duro, pero segurísimo que infinitamente satisfactorio. Nuestro proyecto de vida juntos. Gracias Sara por completarme y por aguantarme, por hacerme mejor. Te quiero peque peque. MIL GRACIAS A TODOS. MIL GRACIAS FAMILIA!.
(12)
(13) PROLOGUE. 7.
(14) 8.
(15) PROLOGUE. Index. Prologue ......................................................................................................... 7 Index .....................................................................................................................9 Financial Support................................................................................................13 Abbreviations .....................................................................................................15 Organization .......................................................................................................17 Summary / Sumario.............................................................................................19 Chapter 1: Introduction, Justification, Hypothesis, And Objectives................. 29 1. Dry Eye Disease (DED) ...................................................................... 31 1.1. Lacrimal Functional Unit (LFU) ......................................................... 31 1.2. DED Definition ................................................................................. 32 1.3. DED Classification ............................................................................ 34 1.4. DED Epidemiology ........................................................................... 37 1.5. DED Diagnosis .................................................................................. 39 1.5.1. Symptoms Evaluation ...................................................................... 40 1.5.2. Tear Flow Evaluation ....................................................................... 44 1.5.3. Tear Osmolarity Evaluation .............................................................. 47 1.5.4. Ocular Surface Evaluation ................................................................ 48 1.5.5. Blinking, Eyelids, And Meibomian Glands Evaluation ........................ 49 1.5.6. Visual Function Evaluation ............................................................... 50 1.6. DED Therapies ................................................................................. 50 1.6.1. Education And Environmental Strategies .......................................... 51 1.6.2. Artificial Tear Substitutes, Gels And Ointments ................................. 52 1.6.3. Autologous Serum............................................................................ 53 1.6.4. Punctal Plugs ................................................................................... 54 1.6.5. Cyclosporine A ................................................................................. 54 1.6.6. Oral Tetracyclines ............................................................................ 55 1.6.7. Lifitegrast ........................................................................................ 56 1.6.8. Topical Corticosteroids ..................................................................... 57 2. Influence Of Environmental Conditions In DED ................................. 63 2.1. Outdoor Environment Conditions .................................................... 64 2.1.1. Relative Humidity (RH) ..................................................................... 64 2.1.2. Temperature .................................................................................... 66 2.1.3. Wind / Air Flow ................................................................................ 66 2.1.4. Pollutants ........................................................................................ 67 2.1.5. Ultraviolet Light ............................................................................... 68 2.2. Indoor Environmental Conditions..................................................... 68 2.2.1. Computer Vision Syndrome (CVS) ..................................................... 69. 9.
(16) PROLOGUE 2.2.2. Sick Building Syndrome .................................................................... 70 3. Recreation Of Environmental Conditions In Experimental DED ......... 72 3.1. In Vitro Models Of DED .................................................................... 72 3.2. Ex Vivo Models Of DED .................................................................... 74 3.3. Animal Models Of DED ..................................................................... 75 3.3.1. Murine Models ................................................................................ 75 3.3.2. Rat Models ...................................................................................... 79 4. Recreation Of Environment Conditions For The Clinical Study Of DED: Controlled Environment Chambers .............................................................. 81 5. Biomarkers In DED ........................................................................... 84 5.1. DED Biomarkers And Inflammation .................................................. 84 5.1.1. Molecular Biomarkers ...................................................................... 85 5.1.2. Cellular Biomarkers .......................................................................... 90 5.2. Effect Of Environment Conditions On DED Biomarkers ..................... 93 5.3. Effect Of DED Therapies On Biomarkers Under Adverse Environment Conditions ................................................................................................... 95 6. Justification ..................................................................................... 96 7. Hypothesis And Objectives............................................................... 99 8. References....................................................................................... 101 Chapter 2: New Design Of Clinical Trials: Use Of Controlled Environmental Chambers ................................................................................................. 127 1. Materials And Methods ................................................................. 130 1.1. Study Procedure ............................................................................ 130 1.2. Drug Masking And Administration.................................................. 134 1.3. Patient Selection ............................................................................ 135 1.4. Clinical Assessment ........................................................................ 136 1.5. Outcome Measurement Endpoints ................................................ 140 1.5.1. Primary Efficacy Outcome Measures .............................................. 140 1.5.2. Secondary Efficacy Outcome Measures .......................................... 141 1.5.3. Safety Outcome Measures ............................................................. 141 1.6. Sample Size And Statistical Analysis ............................................... 141 2. Results ........................................................................................... 143 2.1. Patient And Baseline Characteristics .............................................. 143 2.2. Efficacy Analysis ............................................................................. 145 2.3. Safety Analysis ............................................................................... 147 2.4. Secondary Outcome Measures ...................................................... 147 2.5. Treatment Satisfaction................................................................... 151 3. Discussion...................................................................................... 152 4. References..................................................................................... 157 Chapter 3: Tear Biomarkers ......................................................................... 161 1. Materials And Methods ................................................................. 163 1.1. Tear Sample Collection .................................................................. 163. 10.
(17) PROLOGUE 1.2. 1.3. 1.4. 2. 2.1. 2.2. 2.3. 2.4. 2.5. 3. 4.. Tear Inflammatory Molecules Analysis ........................................... 163 Definition Of The Type Of Tear Biomarkers .................................... 165 Statistical Analysis.......................................................................... 165 Results ........................................................................................... 161 Inflammatory Molecule Concentrations In Tears ............................ 167 Disease Severity Biomarkers .......................................................... 171 Therapeutic Biomarkers ................................................................. 174 Disease Activity Biomarkers ........................................................... 177 Best Potential Biomarkers After Multiple Comparisons Analysis ........ 178 Discussion...................................................................................... 179 References..................................................................................... 184. Chapter 4: New Questionnaire For Ded-Related Symptom Evaluation.......... 189 1. Justification ................................................................................... 191 2. Materials And Methods ................................................................. 193 2.1. Phase I: Tool Design ....................................................................... 193 2.2. Phase II: Tool Evaluation ................................................................ 194 2.3. Patient Selection............................................................................ 194 2.4. Study Procedure ............................................................................ 195 2.5. Sample Size And Statistical Analysis ............................................... 196 3. Results ........................................................................................... 199 3.1. OSDI .............................................................................................. 201 3.2. Sande II.......................................................................................... 201 3.3. ECS-Q ............................................................................................ 202 3.4. Correlations And Questionnaires Concordance .............................. 202 4. Discussion...................................................................................... 205 5. References..................................................................................... 208 Conclusions ................................................................................................. 211 Capítulo 5: Resumen en español .................................................................. 217 1. 2. 3. 4. 5. 6.. Introducción .................................................................................. 219 Hipótesis ....................................................................................... 221 Objetivos ....................................................................................... 222 Nuevo diseño de ensayos clínicos y biomarcadores en lágrima....... 223 Nuevo cuestionario para evaluar sintomatología de SOS ............ 232 Conclusiones ................................................................................. 237. Epilogue ...................................................................................................... 241 Limitations And Future Studies ....................................................................... 243 Scientific Dissemination .................................................................................. 245 Annex .............................................................................................................. 249. 11.
(18)
(19) PROLOGUE. Financial Support This research has been possible thanks to the following financial support: . Spanish Ministry of Economy and Competitiveness: Grant SAF201015361; Molecular Biomarkers and Therapeutic Targets in Oculars Surface Inflammation. PI: Amalia Enríquez de Salamanca Aladro.. . Consejería de Educación, Castilla y León Council: Grant VA174U14; Molecular Biomarkers in Human Dry Eye Syndrome under Controlled Environment Conditions. PI: Margarita Calonge Cano.. . Allergan Inc. (Inflammation Research Program), Irvine, CA, USA, contributed with extra-funding for Environmental Chamber usage.. The pre-doctoral student also received the following support from The University of Valladolid: . European Social Funds, Operative Program for Castilla y León, Castilla y León Council, Spain, Grant EDU/346/2013. 2013-2017. . Grant for short research stays during the development of Doctoral Theses. 2016.. All funding organizations had no role in the design or conduct of this research.. 13.
(20)
(21) PROLOGUE. Abbreviations Throughout this manuscript, different abbreviations have been used, which are described below:. ACE CCLR. Adverse controlled environment Centre for Contact Lens Research. BCVA CERLab. Best corrected visual acuity Controlled Environment Research Laboratory Conjunctival impression cytology. CI. Confidence interval. CIC. CsA. Cyclosporine A. DED. Dry eye disease. DEWS. Dry eye workshop. ECS-Q. Evaluation of change in symptoms-questionnaire. EGF. Epidermal growth factor. ETDRS. Early Treatment for Diabetic Retinopathy Study. EDEV ELISA. Experimentally-induced dry eye in vitro Enzyme-linked immunosorbent assay. EVEIT. Ex vivo eye irritation test. FC. Fold-change. FDA. Food and Drug Administration. FML group. Fluorometholone group. GvHD. Graft versus host disease. H. Hour. HCE. Human corneal epithelia. HLA-DR. ICAM-1 ICES. Intercellular adhesion molecule 1 Intelligently controlled environmental system. ICC. Human leukocyte antigen Drelated Intraclass coefficient correlation. IgA. Immunoglobulin A. IL. Interleukin. IOP. Intraocular pressure. IFN. Interferon. IP-10. IFN-γ induced protein 10. LFA-1. Lymphocyte functionassociated antigen 1. LFU. Lacrimal functional unit. 15.
(22) PROLOGUE. M-DED. Moderate-DED group. mb. Millibar. MCP-1. Monocyte chemoattractant protein–1. MDS. Multidimensional scaling. MGD. Meibomian gland dysfunction. NIBUT. Non-invasive break-up time. OSDI. Ocular surface disease index. PA. Polyvinyl alcohol group. PM. Particular matter. RA. Receptor antagonist. RANTES. Regulated upon activation normal T-cell expressed and presumably secreted. RH. Relative humidity. ROS. Regression on order statistics. RT-PCR. S-DED. Severe-DED group. SANDE. SD. Standard deviation. SS. Sjögren’s syndrome. TBUT. Tear break-up time. TGF‐β. Transforming growth factor beta. TNF-α. Tumor necrosis factor alpha. USA. United States of America. VAS. Visual analogue scales. Reverse transcription polymerase chain reaction Symptoms assessment in dry eye. 16.
(23) PROLOGUE. Organization This Doctoral Thesis applies for the International-awarded Doctorate Degree. It has been performed at the University of Valladolid, under the regulations of the International Doctorate Committee. The joint requirements are as follows: the whole manuscript has been written in English and a general summary in Spanish, in which the objectives, methodology and summary of results are presented. This Thesis report is organized in 8 sections as follows: 1. Prologue 2. Chapter 1: Introduction, Justification, Hypothesis, and Objectives 3. Chapter 2: New Design of Clinical Trials: Use of Controlled Environmental Chambers 4. Chapter 3: Tear Biomarkers 5. Chapter 4: New Questionnaire for Dry Eye Disease-Related Symptom Evaluation 6. Conclusions 7. Capítulo 5: Resumen de la tesis doctoral en español 8. Epilogue. Part of this Doctoral Thesis was developed during a 3-month research stay at the University of Cologne (Köln, Germany) in collaboration with the Department of Ophthalmology (Chairman: Claus Cursiefen) and under the direct supervision of Dr. Philipp Steven.. 17.
(24)
(25) PROLOGUE. Summary Objectives: The main aims of this doctoral thesis were 3: 1) to study the usefulness of a new two-step design of clinical trials using a controlled environment chamber to evaluate the safety and efficacy of new dry eye disease (DED) therapies; 2) to evaluate the effect of a common DED therapy on clinical symptoms and signs and tear inflammatory molecule levels at different timepoints (i.e. pre- and post-treatment, pre- and post-adverse environmental condition [ACE; 23°C temperature, 5% relative humidity, 0.43 m/s localized airflow] exposure), identifying different biomarkers (disease severity, therapeutic efficacy, and disease activity); 3) to analyze why clinical symptoms usually fail at translating what patients feel and to develop a new and simpler questionnaire that can detect changes in DED-related symptoms between two time-points in an easier and yet more accurate way than the current questionnaires. Methodology: To meet the first and second aims, a single-center, doublemasked, randomized, vehicle-controlled, phase II clinical trial was conducted, assessing the efficacy of topical 0.1%-fluorometholone in moderate-to-severe DED patients for ameliorating the worsening of the ocular surface when exposed to an adverse environment. A total of 41 patients randomly received one drop 4 times daily of either topical 0.1%-fluorometholone (FML group) or polyvinyl alcohol (PA group) for 22 days. During the 4 visits of the study (V1, day 0, baseline / V2; day 21, pre-ACE exposure / V3, day 21, post-ACE exposure / V4, day 22, 24h post-ACE exposure) DED signs and symptoms were evaluated. Also, tear samples were collected at the beginning of each visit for further analysis. An immune. bead-based array analyzed the concentrations of 18 molecules (EGF, IFN-γ, TNF-α, IL-1β, IL-1RA, IL-2, IL-4, IL-6, IL-8/CXCL8, IL-10, IL-12, IL-13, IL-17A, IP10/CXCL10,. MCP-1/CCL2,. MIP-1α/CCL3,. RANTES/CCL5. and. MMP-9).. 19.
(26) PROLOGUE Multidimensional scaling (MDS) used molecule concentrations at V1 to determine the pattern of similarities among patients. A linear mixed effect model analyzed the influence of visits, treatment, and severity on changes in molecule concentrations. Multiple comparisons analysis was used to eliminate the effects multiple statistical tests. Regarding the third aim, we carried out a prospective observational study in collaboration with the University of Cologne to perform a clinical-based evaluation of the Evaluation of Change in Symptoms-Questionnaire (ECS-Q), the new tool proposed. This study consisted on two visits (V1, baseline / V2, followup after therapy) in which DED-related signs and symptoms were evaluated, the latest ones using different questionnaires, OSDI, SANDE II, and ECS-Q. The new ECS-Q had 2 parts: ECS-Q1, that had three possible answers as to how to grade change after therapy in V2 (better, worse, equal), and ECS-Q2 that quantified the change observed. Results: After 21-day treatment, the FML group had greater improvements in corneal and conjunctival staining, hyperemia, and tear break-up time than did the PA group. After ACE, the percentage of patients having a ≥1 grade increase in corneal staining was significantly higher in the PA group (63.1% vs 23.8%, respectively). Additionally, the FML group showed no significant changes in corneal staining, conjunctival staining, and hyperemia after the ACE exposure, while the PA group showed a significant worsening in corneal staining, conjunctival staining, and hyperemia. The FML group maintained V2 corneal staining scores, while the PA group did not recover the previous status 24h after the exposure. There were no adverse events. Regarding the tear samples analysis, MDS divided patients into two groups based on differences in EGF, IFN-γ, IL-8/CXCL8, RANTES/CCL5, and MMP-9 levels. These groups had different clinical severities based on Schirmer test, conjunctival staining, and corneal staining, thus, these groups were named moderate and severe DED groups. Both groups presented significant different levels of EGF, IFNγ, IL-2, IL-8/CXCL8, IL-10, IL-12, RANTES/CCL5, and MMP-9. IL-1RA, IL-2, and TNF-. 20.
(27) PROLOGUE α were differentially affected by time, depending on the treatment. Between V2V3, there were significant changes in EGF, IL-1RA, IL-2, IL-8/CXCL8, IL-13, IP10/CXCL10, TNF-α, and MMP-9. The strongest biomarker candidates were IFN-γ, IL-2, IL-8, IL-12, RANTES/CCL5, and MMP-9 as DED severity biomarkers; IL-2 as a therapeutic (FML) biomarker; and EGF as a DED activity biomarkers. Finally, 36 DED patients were included in the observational study. Between V1 and V2, DED-related symptoms decreased with all the questionnaires used (OSDI, SANDE II, and ECS-Q). Some (5.5%) patients did not adequately complete SANDE II questionnaire, while all patient correctly interpreted ECS-Q. Patients responding “better” in ECS-Q presented a significantly lower corneal staining that those responding “worse”. Moreover, these patients had a significantly lower SANDE II score than those who responded “equal” or “worse”. Finally, a poor concordance between OSDI and ECS-Q was observed, while between ECS-Q and SANDE II the concordance was moderate. Conclusion: The new two-step clinical trial design proposed is useful to evaluate the efficacy of new DED therapies, both in the traditional way but also in the protective effect after an inflammatory desiccating stress. FML can be used as a positive control in future trials evaluating the effectiveness of new therapies for DED using this new clinical trial design. The following molecules (IFN-γ, IL-2, IL-12, RANTES/CCL5, and MMP-9) allow to classify patients according to their DED severity in an objective way. Thus, these biomarkers also can be useful to better select target patients for clinical trials. lL-2 is proposed as the strongest therapeutic biomarker for fluormetholone therapy that could be used as an objective therapeutic evaluation end-points in future clinical trials with that drug. EGF is proposed as a biomarker that could provide a better definition of DED disease activity. Due to its simplicity, the new questionnaire developed can be a useful tool for the evaluation of the patient´s perception regarding the evolution of their DED symptoms.. 21.
(28)
(29) PROLOGUE. Sumario Objetivos: Los objetivos principales de esta tesis doctoral fueron 3: 1) estudiar la utilidad de un nuevo diseño de ensayos clínicos en dos fases utilizando una cámara de ambiente controlado para evaluar la seguridad y la eficacia de las nuevas terapias para el síndrome de ojo seco (SOS); 2) evaluar en diferentes momentos (es decir, pre- y post-tratamiento, pre- y post-ambiente controlado adverso [ACA; temperatura de 23°C, humedad relativa del 5%, flujo de aire de 0,43 m/s) el efecto de un tratamiento común para el SOS sobre los síntomas y los signos clínicos, así como sobre los niveles de moléculas inflamatorias, identificando diferentes biomarcadores (severidad de la enfermedad, eficacia terapéutica y actividad de la patología); 3) analizar por qué la evaluación de la sintomatología no suele reflejar lo que los pacientes sienten, y desarrollar un cuestionario nuevo y más simple que pueda detectar cambios en los síntomas relacionados con SOS entre dos momentos de tiempo de una manera más sencilla y precisa que los cuestionarios actuales. Metodología: Para cumplir con los objetivos primero y segundo, se realizó un ensayo clínico fase II, doble enmascaramiento, aleatorizado, y controlado por vehículo, que evaluó la eficacia de la fluorometolona tópica al 0.1% en la reducción del empeoramiento de la superficie ocular de pacientes con SOS moderado y/o severo cuando éstos se exponen a un ambiente adverso. Un total de 41 pacientes fueron asignados aleatoriamente al grupo de estudio (grupo FML; fluorometolona tópica al 0.1%) o al grupo control (grupo PA; alcohol polivinílico). Los participantes se administraron 1 gota del tratamiento asignado en cada ojo, 4 veces al día durante 22 días. En cada una de las 4 visitas del estudio (V1, día 0, visita inicial / V2, día 21, pre-ACA / V3, día 21, post-ACA / V4, día 22, 24h postACA) se evaluaron los signos clínicos y los síntomas, y se recogieron muestras de. 23.
(30) PROLOGUE lágrima para su posterior análisis. Este análisis se realizó mediante técnica de Luminex, analizando las concentraciones de 18 moléculas (EGF, IFN-γ, TNF-α, IL1β, IL-1RA, IL-2, IL-4, IL-6, IL-8 / CXCL8, IL IL-12, IL-13, IL-17A, IP-10 / CXCL10, MCP1 / CCL2, MIP-1α / CCL3, RANTES / CCL5 y MMP-9). Se realizó un escalamiento multidimensional (MDS) utilizando las concentraciones de las moléculas en V1 para determinar el patrón de similitudes entre los pacientes. Mediante un modelo de efecto mixto lineal se analizó la influencia de las visitas, el tratamiento y la severidad en los cambios en las concentraciones de las moléculas evaluadas. Finalmente, se llevó a cabo un análisis de comparaciones múltiples. En cuanto al tercer objetivo, se realizó un estudio prospectivo observacional en colaboración con la Universidad de Colonia para realizar una evaluación clínica de un nuevo cuestionario “Evaluación de Cambio en Síntomas-Cuestionario” (ECSQ). Este estudio consistió en dos visitas (V1, basal / V2, seguimiento tras terapia) en las que se evaluaron los signos y síntomas relacionados con SOS. Para ello se utilizaron diferentes cuestionarios, OSDI, SANDE II y ECS-Q. El nuevo ECS-Q tenía dos partes: ECS-Q1, que tenía tres respuestas posibles sobre el grado de cambio después de la terapia en V2 (mejor, peor, igual) y ECS-Q2 que cuantificaba el cambio observado. Resultados: Después de 21 días de tratamiento, el grupo de FML tuvo reducciones mayores en tinción corneal y conjuntival, e hiperemia que el grupo PA, así como un aumento del tiempo de ruptura lagrima. Después de la exposición a ACA, el porcentaje de pacientes con un aumento ≥1 en la tinción corneal fue significativamente mayor en el grupo PA que en el grupo FML (63,1% vs 23,8%, respectivamente). Además, tras esta exposición el grupo FML no mostró cambios significativos en tinción corneal, conjuntival e hiperemia, mientras que el grupo PA mostró un empeoramiento significativo de los tres parámetros. El grupo FML mantuvo las puntuaciones de tinción corneal de V2, mientras que el grupo PA no recuperó el estado anterior 24 horas después de la exposición. No hubo eventos adversos.. 24.
(31) PROLOGUE En cuanto al análisis de las muestras de lágrimas, el análisis MDS dividió a los pacientes en dos grupos basándose en las diferencias en los niveles de EGF, IFNγ, IL-8 / CXCL8, RANTES / CCL5 y MMP-9. Estos grupos tenían diferente gravedad clínica basada en los resultados del test de Schirmer, la tinción conjuntival y la tinción corneal, por lo tanto, estos grupos fueron denominados como SOS moderado y SOS grave. Ambos grupos presentaron niveles significativamente diferentes de EGF, IFN-γ, IL-2, IL-8 / CXCL8, IL-10, IL-12, RANTES / CCL5 y MMP-9. IL-1RA, IL-2 y TNF-α fueron afectados diferencialmente por el tiempo, dependiendo del tratamiento. Entre V2-V3, hubo cambios significativos en EGF, IL-1RA, IL-2, IL-8 / CXCL8, IL-13, IP-10 / CXCL10, TNF-α y MMP-9. Los candidatos a biomarcadores más fuertes fueron IFN-γ, IL-2, IL-8, IL-12, RANTES / CCL5 y MMP9 como biomarcadores de severidad de SOS; IL-2 como biomarcador terapéutico (FML); Y EGF como biomarcadores de la actividad del SOS. Finalmente, en el estudio observacional realizado con Colonia se incluyeron 36 pacientes de SOS. Entre V1 y V2, la sintomatología de SOS disminuyó con todos los cuestionarios utilizados (OSDI, SANDE II, y ECS-Q). Algunos pacientes (5,5%) no completaron adecuadamente el cuestionario SANDE II, mientras que todos los pacientes interpretaron correctamente ECS-Q. Los pacientes que respondieron "mejor" en ECS-Q presentaron una tinción corneal significativamente menor que aquellos que respondieron "peor". Además, estos pacientes tenían una puntuación SANDE II significativamente menor que aquellos que respondieron "igual" o "peor". Por último, se observó una pobre concordancia entre OSDI y ECSQ, mientras que entre ECS-Q y SANDE II la concordancia fue moderada. Conclusión: El nuevo diseño en dos fases de ensayo clínico propuesto es útil para evaluar la eficacia de las nuevas terapias de SOS, tanto de manera tradicional como estudiando el efecto protector del tratamiento frente a un estrés desecante inflamatorio. El FML se puede utilizar como un control positivo en ensayos futuros que evalúen la efectividad de nuevas terapias para SOS usando este nuevo diseño de ensayo clínico. Las siguientes moléculas (IFN-γ, IL-2, IL-12, RANTES / CCL5 y MMP-9) permiten clasificar a los pacientes de acuerdo con su severidad de SOS. 25.
(32) PROLOGUE de una manera objetiva. Por lo tanto, estos biomarcadores también pueden ser útiles para seleccionar mejor a los pacientes diana para ensayos clínicos. IL-2 se propone como el biomarcador terapéutico más fuerte para la terapia utilizada, y podría utilizarse como variable objetiva final durante la evaluación de la efectividad terapéutica en futuros ensayos clínicos con este fármaco. EGF se propone como un biomarcador que podría proporcionar una mejor definición de la actividad del SOS. Debido a su simplicidad, el nuevo cuestionario desarrollado puede ser una herramienta útil para la evaluación de la percepción del paciente con respecto a la evolución de sus síntomas de SOS.. 26.
(33)
(34)
(35) INTRODUCTION, JUSTIFICATION, HYPOTHESIS, and OBJECTIVES. 29.
(36) CHAPTER 1. Chapter 1: Introduction, Justification, Hypothesis, and Objectives This chapter explains the concept of the Lacrimal Functional Unit (LFU) and the definition, etiology, and diagnosis of Dry Eye Disease (DED), as well as its management and treatment. Additionally, it shows the relevance and influence of the environment in DED, reviewing the concepts of outdoor and indoor environment conditions, as well as their effects on the LFU. Furthermore, the most relevant studies regarding the effect of adverse environment conditions in both experimental DED (i.e. animal models, ex vivo models and in vitro models) and clinical research are presented. Finally, knowing that DED is an inflammatory process, the impact of the disease in the expression of molecules in tears of DED patients, as well as the use of biomarkers in this pathology, are revised in the last section of this chapter.. 30.
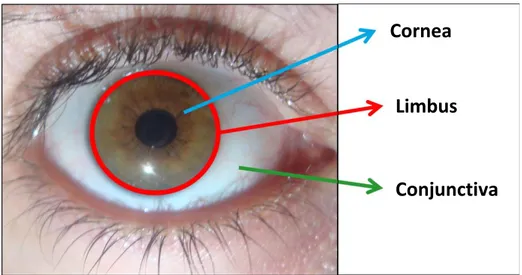
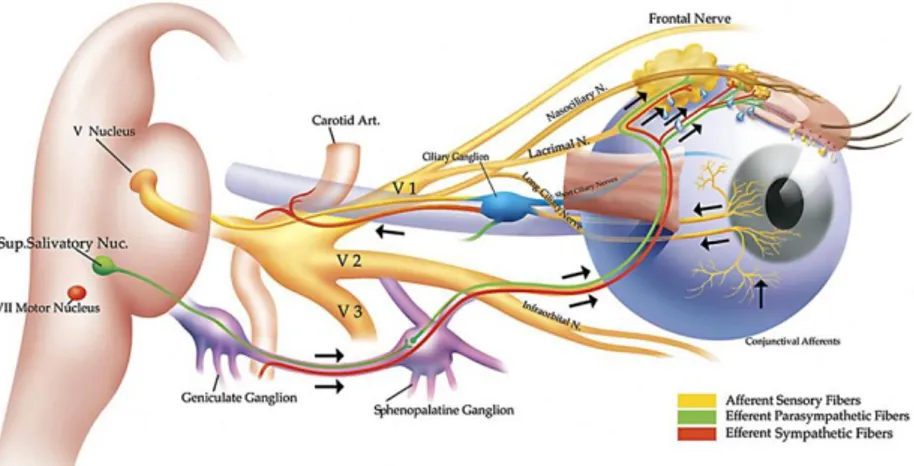
(37) CHAPTER 1. 1. Dry Eye Disease (DED) 1.1. Lacrimal Functional Unit (LFU) The ocular surface was defined by Thoft et al.1 in 1978 as an integrated unit comprising the cornea, the conjunctiva, the sclera-corneal limbus, and the overlying tear film (Figure 1). These components are interconnected through a continuous epithelium with no breaks between regions, and neuroanatomically connected with the nervous, vascular, immune, and endocrine systems.. Cornea. Limbus. Conjunctiva. Figure 1. Ocular surface. Anatomical location of the conjunctiva, limbus and cornea on the ocular surface2. The concept of LFU was introduced by Stern et al.3 in 1998, overcoming the concept of ocular surface previously explained. The LFU is composed of the cornea, conjunctiva, limbus, tear film, accessory lacrimal glands, Meibomian glands, main lacrimal gland, and the interconnecting innervation (V nerve, VII nerve, and autonomous system) that integrates the activities of each component (Figure 2).2–4 The role of the LFU is to secrete a precise tear film composition that maintains a homeostatic environment around the epithelial cells of the ocular surface.. 31.
(38) CHAPTER 1 Putting together the concept of LFU and the fact of DED as an inflammatory immune disorder, Stern et al.3 proposed that “DED is the result of a localized inflammatory response mediated by the immune system affecting the LFU”.3 Therefore, the alteration of any of the components of the LFU can alter the homeostasis of this unit as a whole. If this disturbance is not neutralized it will soon lead to DED.5. Figure 2. Lacrimal Functional Unit (LFU). From Pflugfelder SC, Beuerman RW, Stern ME, eds. Dry Eye and Ocular Surface Disorders. New York, NY: Marcel Dekker, Inc.; 2004.2. 1.2. DED Definition The definition and concept of DED have suffered multiple modifications along the years as understanding of the disease process has evolved. There are several difficulties to establish a widely-accepted definition of this pathology, mainly due to the lack of a complete understanding of all the events that contribute to the pathogenesis of the disease. Therefore, different terms have been proposed to refer to DED, like keratoconjunctivitis sicca,6 keratitis sicca,7 filamentary keratitis,8 dry eye syndrome,9 dry eye,10,11, tear deficiency,6,12 or dysfunctional tear syndrome.13 Historically, it was considered that DED was due to either insufficient production or impaired stability of tears. In 1903, the concept of tear deficiency was first proposed by O. Schirmer, who developed the Schirmer test to measure. 32.
(39) CHAPTER 1 tear production.14 In 1933, H. Sjögren used the Latin term “keratoconjunctivitis sicca” referring to the DED or dry inflammation of the cornea and conjunctiva observed in Sjögren syndrome (SS), mentioning the triad of dry eye, dry mouth and joint pain.15 For many years afterward, dry eye was considered to be equivalent to keratoconjunctivitis sicca, focusing only in the deficiency or disruption of the aqueous layer of the tear film.6 Later, in the period when the tear film structure was based in a 3-layer model, the classification of DED was based on the alteration of one or more of these layers.16 Currently, the 3-layer model has been replaced. The new model used to explain the tear film structure claims that this is composed of a mucus-aqueous gel covered by a lipid layer.17,18 This gel is secreted by the lacrimal glands and the epithelial cells and goblet cells located in the ocular surface, and is anchored to glycocalix by chemical bonds. In 1995, the National Eye Institute of the United States of America (USA) defined DED as “a disorder of the tear film due to tear deficiency or excessive tear evaporation which causes damage to the interpalpebral ocular surface and is associated with symptoms of ocular discomfort”.19 The most important contribution of this definition was to consider that DED cannot only be caused by an aqueous production deficiency, but also by an excessive evaporation of the tear film. Thus, pathologies such as Meibomian gland dysfunction (MGD) or blepharitis are directly related with some DED categories. This definition was an important step to get consensus among researches, but unfortunately, it continued focusing on tear deficiency as the most relevant factor in DED. Moreover, the concept “disease” was not included in the definition; thus, this definition could have induced the ophthalmological community to understand that DED was not a disease, but just a nuisance. On the other hand, the attempt to generate a global definition induced several problems. The assumption that the damage of the ocular surface was only interpalpebral, or the idea that DED necessarily entails the presence of symptoms, are examples of these problems.. 33.
(40) CHAPTER 1 Some years later, in 2006, after a Delphi panel approach “dysfunctional tear syndrome” was proposed as a new term to define the disease, concluding that treatment strategies should rely on symptoms and signs rather than tests.13 This panel defined the clinical signs to be considered in assessing the severity of dysfunctional tear syndrome, upon which a severity-based treatment algorithm was suggested.13 A bigger step in the definition of DED was given in 2007, when the first International Dry Eye Workshop (DEWS) defined this pathology as “a multifactorial disease of the tears and ocular surface that results in symptoms of discomfort,20,21 visual disturbance,22–25 and tear film instability,26,27 with potential damage to the ocular surface. It is accompanied by increased osmolarity of the tear film28–31 and inflammation32–34 of the ocular surface”.35 The new definition emphasized symptoms and global mechanisms, and recognized the multifactorial nature of DED. Moreover, inflammation and osmolarity were highlighted as potential risk factors for DED. According to this definition, symptoms of dry eye (including visual disturbances) should be present for the diagnosis of DED. In addition, the report states that to definitively confirm this diagnosis is necessary to observe a reduction of tear volume and the presence of ocular surface damage, observed by vital dyes. A second International DEWS is working since May 2015 and will generate a report by 2017, which will revise the definition and diagnostic guidelines for DED. Unfortunately, this second DEWS will be missing the input of important experts in the field who profoundly disagree with DEWS policies.. 1.3. DED Classification The DEWS committee proposed in 2007 a new DED classification35 based on both the “triple classification” generated from reports presented at the 14th Congress of the European Society of Ophthalmology36,37 and the report of the Delphi panel.13 From the “triple classification”,37 published in 2005, the DEWS committee took many conceptual aspects from the classification criteria based on three separate schemes; one based on etiopathogenesis, one based on the glands. 34.
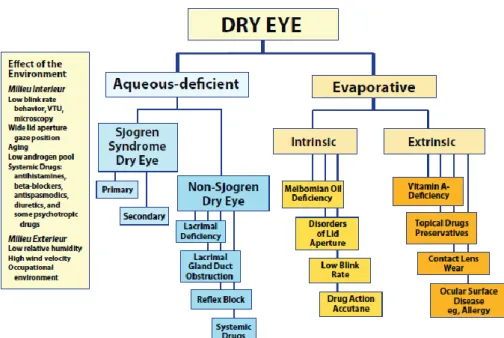
(41) CHAPTER 1 and tissues targeted in DED, and one based on disease severity. From the Delphi Panel13 the committee adopted a severity grading scheme (Table 1). Table 1. Dry eye disease (DED) severity grading scheme. Modified from: The definition and classification of dry eye disease: report of the Definition and Classification Subcommittee of the International Dry Eye WorkShop (2007).35 DED severity level. 1. 2. 3. 4. +. ++. +++. +++ / D. Episodic. Both. Frequent/Constant. Constant. Yes. Both. No. No. -/E. E. C or chronic. C/D. Annoying and/or activity limiting. Annoying and/or activity limiting. Discomfort: - Severity - Frequency - Environmental stress needing?. Visual symptoms. Conjunctival injection. -/+. -/+. -/+. + / ++. Corneal staining. -/+. Variable. Marked central. N/A. -/+. + debris, ↓meniscus. Filamentary keratitis, mucus clumping, ↑ tear debris. Filamentary keratitis, mucus clumping, ↑ tear debris, ulceration. Lid/Meibomian glands. MGD (E). MGD (E). MGD (F). Trichiasis, keratinization, symblepharon. Tear film break-up time. Variable. ≤ 10. ≤5. Immediate. Schirmer score (mm/5 min). Variable. ≤ 10. ≤5. ≤2. Corneal/tear signs. - = Not present; + = Mild; ++ = Moderate; +++ = Severe; D = Disabling; E = Episodic; F =Frequent; C =Constant; MGD = Meibomian gland dysfunction. According to the etiopathogenic classification proposed by the DEWS report (Figure 3), the major classes of DED are aqueous-deficient DED and evaporative DED.35 It is important to recognize that both types of DED may coexist. In both cases, there is an alteration of the quality and/or the composition of the tear film, which leads to a reduction of the tear stability and an increase of its osmolarity.. 35.
(42) CHAPTER 1 Aqueous-deficient DED implies that the pathology is due to a failure in the lacrimal tear secretion.38,39 This category of DED has been sub-divided in two subclasses, SS and non-SS-DED. In the first case, the lacrimal and salivary glands are targeted by an autoimmune systemic process. These structures are infiltrated by activated T-cells, which cause acinar and ductular cell death and hyposecretion of tears and saliva. In the second case, there are no systemic autoimmune features. The non-SS-DED can be caused by several circumstances: deficiencies in the main lacrimal gland or the secondary lacrimal glands, obstruction of the lacrimal gland ducts or hyposecretion of reflex tears, all caused by multiple reasons. Evaporative DED is due to an excessive water loss in the tear film from the exposed ocular surface in the presence of normal tear secretion. Two subcategories have been described to distinguish those causes that are dependent on intrinsic conditions, due to intrinsic disease affecting lid structures or dynamics of the lids and ocular surface (e.g. MGD, low blink rate, etc.) from those that arise from extrinsic influences, where ocular surface disease occurs due to some extrinsic exposure (e.g. contact lens wear, allergic conjunctivitis, etc.).35. 36.
(43) CHAPTER 1. Figure 3. Major etiological causes of DED. From The definition and classification of dry eye disease: report of the Definition and Classification Subcommittee of the International Dry Eye WorkShop (2007).35. Additionally, DED can be categorized as episodic or chronic. Episodic DED occurs when environmental or visual tasks with reduced blinking overwhelm the stability of the tear and produce symptomatic dry eye. Chronic DED, although aggravated by the same environmental conditions, persists continuously with symptoms and possible damage to the ocular surface.40. 1.4. DED Epidemiology DED is one of the most common ocular morbidities, affecting between 5.5% and 35% of the population.41–44 The large differences observed in the prevalence of DED are due to variations in studied populations, geographical differences, differences in the diagnosis methodology, and even variations in the definition of the disease. Twenty-five percent of patients who visit ophthalmic clinics report symptoms of dry eye, making it a growing public health problem and one of the most common condition seen by eye care practitioners.45 There are big differences between countries in the prevalence of DED. For example, while the. 37.
(44) CHAPTER 1 prevalence of DED in Australia is approximately 7.4%,46 in Taiwan the prevalence increases to 33.7%;47 but is common to find intermediate values of prevalence of DED, as the 25% reported in Canada48 or the 33% observed in Japan.49 In 2009 Viso et al.50 reported a 11% prevalence of DED in Spain, observing that DED was more frequent in women than in men (11.9% and 9.0%, respectively). Regarding the prevalence of DED in Valladolid, city where this Thesis has been developed, Fuentes-Páez et al.51 observed a higher prevalence than in the study of Viso et al., reporting a prevalence of 24.2%, with values of 27.6% and 19,6% in women and men, respectively. It is important to mention that the prevalence and incidence of DED may be under-reported, as patients may fail to recognize the symptoms of DED or do not report the problem to a physician. In any case, the combined data from large population-based epidemiological studies indicates that DED is significantly most common in women that in men.41,42 Finally, it has been reported that this condition presents an increased prevalence in patients with autoimmune diseases,52 which affect approximately 8% of the population, of whom 78% are women.53 DED prevalence is also increased in postmenopausal women54 and elderly people.43,47 This disease represents a big burden in public healthcare, owing to the impact of DED on quality of life of patients by affecting visual-related tasks, social and physical functioning, and workplace productivity.55–57 It is estimated that patients with moderate-to-severe DED have a quality of life similar to patients with moderate-to-severe angina or who undergo hospital dialysis.58,59 As previously explained, several etiopathogenic mechanisms usually interact to generate changes and anomalies in the LFU, eventually leading to tear film instability and ocular surface damage. Around 10% of patients with DED have a solely aqueous-deficient disorder. Hyper-evaporative disorders (mostly caused by dysfunction of the Meibomian glands) and mixed hyper-evaporative/aqueousdeficient forms account for more than 80% of cases.60. 38.
(45) CHAPTER 1 It is fully accepted that DED is a multifactorial disease. For this reason, there are several risk factors for this condition.61 Some of the most relevant are summarized in Table 2.35,62 The prevalence of DED is on the rise because of the global increase in elderly population, and due to the increase incidence of some of the risk factors associated to the disease. Table 2. Major risk factors for dry eye disease (DED). Modified from The definition and classification of dry eye disease: report of the Definition and Classification Subcommittee of the International Dry Eye WorkShop (2007).35 High level of evidence. Moderate level of evidence. Low level of evidence. Age Medications such as tricyclic Smoking antidepressants, selective Female sex Hispanic ethnicity serotonin inhibitors, Postmenopausal estrogen Anticholinergic drugs such as diuretics, beta blockers therapy anxiolytics, antipsychotics Diabetes mellitus Antihistamines Alcohol HIV/HTLV1 infection Collagen vascular disease Menopause Corneal refractive surgery Systemic chemotherapy Botulinum toxin injection Cataract surgery Irradiation Acne Keratoplasty Hematopoietic stem cell Gout Isotretinoin transplantation Oral contraceptives Low air humidity Vitamin A deficiency Pregnancy Sarcoidosis Hepatitis C Ovarian dysfunction Androgen insufficiency HIV = Human immunodeficiency virus; HTLV1 = human T cell leukemia virus type 1.. 1.5. DED Diagnosis A correct diagnosis of DED is necessary to distinguish it from other conditions such as infections or allergies, which can present similar clinical signs. This is not an easy task due to several factors previously explained.63 An incorrect diagnosis of the pathology can lead to the use of treatments that worsen DED. The DEWS report described the ocular surface and tear parameters to consider when diagnosing DED.64 Traditionally, combinations of diagnostic tests have been used to assess symptoms and clinical signs.64,65 This is necessary because the poor repeatability of many of the current diagnostic tests, as well as the low sensitivity and specificity of these tests. The DEWS committee published a diagnostic guideline35 suggesting the following sequence of diagnosis tests:. 39.
(46) CHAPTER 1 a) Patient history/symptoms questionnaires. b) Tear film break-up time (TBUT). c) Ocular surface staining with fluorescein/Lissamine green. d) Schirmer test with or without anesthesia. e) Examination of the eyelid margins and Meibomian glands. Following, some of the most relevant tests for DED diagnosis are detailed.. 1.5.1. Symptoms Evaluation Questionnaires are tools commonly used for the diagnosis of DED. These tools evaluate different aspects of DED symptomatology, including severity, effect on daily activities, quality of life, etc. By themselves, questionnaires are not a good method to establish the origin of eye problems, because the same symptoms can be caused by a variety of disorders of the ocular surface or the tear film.66 Moreover, it is incorrect to assume that symptoms are the main feature of DED, because there is large evidence of the lack of correlation between signs and symptoms in this pathology.67–70 There are more than 18 questionnaires that have been used in randomized clinical trials, epidemiologic studies or prospective randomized studies (Table 3). Data from clinical trials show that the results from the tests currently available for the diagnosis of DED do not always correlate well with patient-reported symptoms, especially in mild-to-moderate disease.69,71 In addition, low correlations have been found between different objective tests.. Table 3. Most used symptom-based questionnaires for dry eye disease (DED) diagnosis. Questionnaire Questionnaire Summary. Year. McMonnies72,73. 14 items focusing on risk factors for DED; screening. 1986. CANDEES48. 13 items estimating the prevalence of symptoms in epidemiological studies. 1997. 6 standardized items relating signs and symptoms. 1997. Salisbury68,74. of dry eye in the elderly. 40.
(47) CHAPTER 1 DEEP75. 19 items; screening. 1998. NEI-VFQ76,77. 25 items: 2 ocular pain subscale questions. 1998. Melbourne Visual Impairment Project46. Self-reported symptoms elicited by intervieweradministered questionnaire. 1998. Japanese Dry Questionnaire49. 30 items relating to symptoms and knowledge DED. Eye. Awareness. 1999. OSDI78. 12 items (0-4) assessing a range of ocular surface symptoms, their severity and impact on visual function in a one-week recall period. 2000. Bjerrum Questionnaire79. 3-part questionnaire which includes an ocular part with 14 questions. 1996. DEQ20,80. 23 main questions on prevalence, frequency, diurnal severity, etc.. 2002. Women´s Health Study Questionnaire54. 3 questions from 14-item original questionnaire. 2003. Sicca Symptoms Inventory81. Inventory of both symptoms and signs of Sjögren’s syndrome. 2003. SPEED82. 8 questions about severity (0-4) and frequency (0-3) of symptoms. 2005. SANDE83. Evaluation of intensity and frequency of dryness in a 100mm-horizontal VAS. 2007. OCI84. 12 items measuring ocular surface irritation. 2007. SESoD85. 3-item questionnaire to evaluate patient’s perception of ocular discomfort related to dryness. 2008. DEQ-586. Subset of DEQ items that discriminate across selfassessed severity and various diagnoses of dry eye. 2010. IDEEL87. 57 questions evaluating dry eye symptom bother, impact on daily life and treatment satisfaction. 2011. DEQS88. 15 items; an overall summary scale and 2 multi-item subscales: impact on daily life and bothersome ocular symptoms. 2013. CANDEES = Canadian Dry Eye Epidemiology Study; DED = Dry Eye Disease; DEEP = Dry Eye Epidemiology Projects; DEQ = Dry Eye Questionnaire; DEQS=Dry Eye Related Quality of Live; IDEEL = Impact of Dry Eye on Everyday Life; NEI-VFQ = National Eye Institute-Visual Function Questionnaire; OSDI = Ocular Surface Disease Index; SANDE = Symptom Assessment in Dry Eye; SESoD = Subjective Evaluation of Symptom of Dryness; SPEED = Standard Patient Evaluation of Eye Dryness questionnaire; VAS=Visual Analogue Scale.. 41.
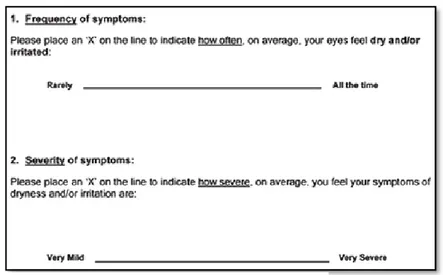
(48) CHAPTER 1 Currently, OSDI78 and SANDE83 questionnaires are two of the tools most frequently used in DED studies and clinical trials to evaluate symptoms. Furthermore, OSDI questionnaire has undergone psychometric testing and has been accepted by the US FDA for its use in clinical trials.78,89 This tool, introduced in 1997 by the Outcomes Research Group (Allergan Inc., Irvine, CA), consists of 12 items that assess symptoms and functional limitations over the preceding week. Each item has the same five-category Likert-type response option, and each of the three subscales has its own question type. Final OSDI scores range from 0 to 100. SANDE I (Figure 4) comprises of two questions that quantify both severity and frequency of DED-related symptoms using two VASs. The one used for the measurement of symptoms frequency ranges from “rarely” to “all of the time” (left and right extremes of the VAS, respectively), while the one used to measure symptoms severity ranges from “very mild” to “very severe” (left and right extremes of the VAS, respectively). Due to its design, this tool evaluates symptoms in a particular moment. On the other hand, SANDE II (Figure 5) is a tool designed to evaluate changes of symptoms. It consists of a VAS scale with a mark in the middle of the line representing “no changes” in relation to the previous visit. Patients are asked to place a mark in the line indicating how severe/frequent the symptoms of dryness and irritation are now compared to the last visit. Marks on. Figure 4. Symptoms assessment in dry eye (SANDE) I.. 42.
(49) CHAPTER 1 the left side of the middle point indicate a decrease of frequency/severity while marks on the right side indicate an increase. The farer from the middle, the higher the change is.. Figure 5. Symptoms assessment in dry eye (SANDE) II.. Additionally, reviewing the latest clinical trials and studies in the field of DED it is possible to observe that VAS has been used in an isolated way in most of them, encouraging patients to evaluate the intensity of a specific symptom or group of symptoms in the VAS scale (Figure 6).. Figure 6. Visual Analogue Scale (VAS).. It is paradoxical to observe that VAS is widely used, in spite of the existence of much more complex tools for symptoms evaluation. This fact may result from the lack of consensus on the appropriateness of the existing questionnaires, or from the attempt to simplify the evaluation of symptoms as much as possible. The problem associated with the use of VAS is that patients usually do not remember their previous answer, so it is not possible to evaluate the changes in symptoms between two independent measures.. 43.
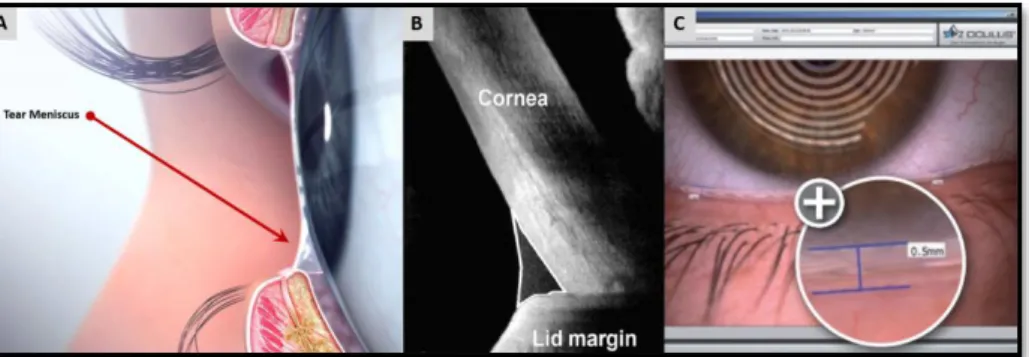
(50) CHAPTER 1. 1.5.2. Tear Flow Evaluation This group includes all the tests used to evaluate the volume, secretion and drainage of the tear film. Tear film meniscus: Tear meniscus refers to the tears accumulated at the junction of the bulbar conjunctiva and inferior lid margins (Figure 7). It contains 75-90% of tear volume; thus, the evaluation of the tear film meniscus, that can be performed by different methods, is a non-invasive technique that provides information about the amount of tears present on the eye.90 Tear meniscus characteristics such as height, width, radius of curvature, and cross sectional area have been reported to be useful in the diagnosis of DED. According to Lamberts et al.,67 the tear meniscus height is normal when its value is between 0.1 and 0.3 mm, being associated with DED values below 0.1 mm.91 There are studies that claim for this test has big diagnostic capacity (92% sensitivity, 90% specificity) taking a cut-off point of 0.164 mm.92 However, the evaluation of this test is subjected to variability; thus, the range of normality depends on the technique used to perform the measurement.93 The simplest technique to evaluate the tear meniscus height is using a sliplamp equipped with a graded ocular, but is important to mention that an excessive or prolonged use of illumination should be avoided to prevent reflex tearing. The second technique is to compare the tear meniscus height with the illuminated slit width by setting the slit horizontally in alignment with the lower lid margin, altering the slit width until it appears to match the height of the tear prism.94 More complex techniques to the measure of the tear meniscus have been described, as the specular or reflective meniscometry,95 the use of magnified optical sections of the tear meniscus and its analysis by specific software,96 the use of optical coherence tomography (OCT),97,98 or the utilization of new tools such as the Keratograph.99 Moreover, video-meniscometry has been also described.76 This technique allows the recording of images of the tear meniscus and analyse the changes produced along time, or during the development of other tests.100. 44.
(51) CHAPTER 1 However, the Fourier Domain-OCT technique provides the best reproducibility results.101 Not only the objective parameters of tear meniscus are useful. The observation of the meniscus profile is also extremely helpful. A regular tear meniscus is typically observed in a healthy eye while a meniscus with a scalloped edge is often associated with a dry eye.. Figure 7. Anatomical location of the tear meniscus (A) and two evaluation methods, Optical coherence tomography (OCT) (B) and Oculus Pentacam®. Modified from www.peterivins.co.uk.. Tear Film Secretion: Schirmer test, described by Otto Schirmer in 1903,14 continues being nowadays the main technique used to measure this parameter and it is considered one of the main ophthalmological tests for the diagnosis of DED.64 There are some variations of this test, such as the Jones basal secretion test and the Schirmer II. In the traditional version of the Schirmer test (Schirmer I), a filter paper strip (35 × 5 mm) is placed in the conjunctival sac of the temporal third of the lower eyelid and after 5 minutes, with the patient's eyes closed, the wetting of the strip is measured. Schirmer test evaluates the total amount of secretion (basal and reflex), because the strip insertion itself can cause reflex tearing. For this technique, the cut-off value varies between 5 and 15 mm, depending on the authors.102,103 It has been reported that using 5 mm as the cut-off criterion, the sensitivity and specificity of the test were 47.2% and 100%, respectively.14 If the same technique is performed after the instillation of topical anesthesia the test is renamed as Schirmer II test.104 In this case, the cut-off value is usually 5. 45.
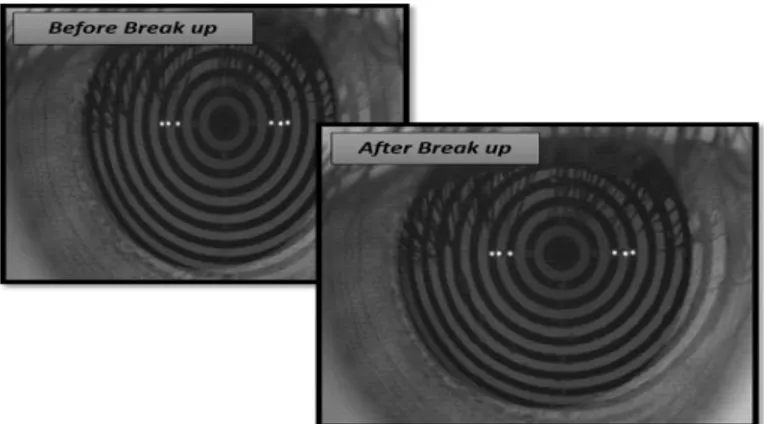
(52) CHAPTER 1 mm, and provides a sensitivity of 60.9% in groups of patients with SS-DED, and 37.5% in groups of patients with other DED etiology; its specificity is 83.6%. Test results are about 40% lower than in Schirmer I, because theoretically this test measures only the basal secretion, without reflex tearing. This variant is also subjected to marked inter- and intra-individual fluctuations. Jones basal test is performed after the instillation of topical anesthesia and with stimulation of the nasal mucosa, which causes reflex tear secretion. The reading is performed after 5 minutes and the cut-off value in this case is 15 mm.105,106 All the modalities of the Schirmer test should be done with the eyes-closed to prevent the interference of environmental factors.107 Tear Film Stability: As previously explained, tear hypo-secretion, as well as its hyper-evaporation, can alter the structure of the tear film. TBUT evaluates the stability of the tear film. This method was described by Norm;108 it is determined after the instillation of unpreserved fluorescein drops. After a complete blink, the time to the first break-up of the tear film is measured using a slit-lamp with a cobalt blue filter. To reduce the variability of the test it is recommended to perform three measures, taking as final value its average. The normal range lies between 20 and 30 seconds; values below 10 seconds are considered abnormal. Taking this value as a cut-off value the test presented good sensitivity (77.8%) but low specificity (38.9%).109 For this reason, 7 mm has been selected as cut-off point by some authors.110,111 The great disadvantage of this technique is that the instillation of the fluorescein causes tear film instability. It has been proposed to instil a controlled amount of fluorescein to reduce as much as possible tear disruption, thus obtaining more repeatable results.112 To avoid the disadvantages related to the instillation of fluorescein, Mengher et al.113 described the non-invasive break-up time (NIBUT). It consists on the projection of an image on the surface of the cornea and the measurement of the time between a complete blink and the first deformation of the image (Figure 8). The cut-off value for a normal NIBUT range between 10 and 15 seconds.114 Using. 46.
(53) CHAPTER 1 10 seconds as cut-off value this test presented a 82% of sensitivity and a 86% of specificity for diagnosis of DED.. 113According. to Wang et al.,115 using a more. restrictive cut-off value (5 seconds) the test presented better values of sensitivity and specificity (95.9% and 90.8%, respectively). In any case, some authors consider that the interpretation of the results obtained with these methods is very limited, because its poor reproducibility and its variability.112 Finally, NIBUT can be automatically measured by a software that performs an automatized analysis of 10-seconds videokeratoscopic sequence (Tear Stability Analysis System).116 This technique reaches a specificity similar to that of BUT, but with a sensitivity of 97.5% for the diagnosis of DED.117. Figure 8. Tear stability measured with Non-Invasive Break-Up Time (NIBUT). Provided by IOBA.. 1.5.3. Tear Osmolarity Evaluation Osmolarity is defined as the quantity of dissolved solutes per volume unit of solvent. The measurement of tear film osmolarity is an indirect indicator of tear dynamics. If there is a high tear evaporation, or a low tear secretion, high osmolarity values will be found, due to the reduction in the solvent quantity; on the other hand, the osmolarity will decrease if there is a high tear secretion or a decrease in tear drain.118 Currently, there is a portable osmometer suitable for tear osmolarity analysis in routine clinical practice. The TearLab™ osmometer automatically collects by. 47.
(54) CHAPTER 1 microcapillarity a small tear sample from the lower tear meniscus and analyzes the osmolarity directly by measuring the impedance of the sample.119 The range for normal tear osmolarity is between 300 and 310 mOsm/L.28 Values above 312 mOsm/L can be compatible with the diagnosis of DED,120 although Tomlinson et al.28 established a value of 315.6 mOsm/L as cut-off point between healthy subjects and DED patients. Using 312 mOsm/L as a cut-off value several authors obtained different sensitivities and specificities of the test, due to the differences in the studied groups (Table 4). Because of the paucity of data and partially conflicting results, this technique is not part of the standard diagnostic repertoire yet. Table 4. Sensitivity and specificity of osmolarity as a diagnostic test using 312 mOsm/L as cut-off value. Author. Sensitivity (%). Specificity (%). Farris et al.121. 95. 94. Tomlinson et al.122. 66. 84. Gilbard et al.120. 94.7. 93.7. 1.5.4. Ocular Surface Evaluation The ocular surface is commonly examined using the slit-lamp and vital dyes. The usual dyes in clinical practice are fluorescein, Rose Bengal and Lissamine green. Fluorescein is the first-choice dye for DED diagnosis.123 It is a hydro-soluble colorant that stains both the tear film and epithelial erosions in the conjunctiva and cornea.124 To evaluate fluorescein staining, 2μL of 2% fluorescein should be instilled. The evaluation should be performed 2 minutes after the instillation using the slit-lamp and a cobalt blue filter. The contrast of the image can be improved by placing a yellow filter in front of the observation system.125 Rose Bengal stains those areas of the cornea or the conjunctiva that present a lack of membrane-associated mucins.126 This test presents poor sensitivity and specificity.68 Also, it is toxic to the corneal epithelium, producing. 48.
Figure
+7
Documento similar
Los datos procedentes de un análisis intermedio en un ensayo fase II (AIO KRK 0604) controlado, multicéntrico y aleatorizado apoyan el uso de capecitabina a la dosis inicial de
En un ensayo de seguridad y eficacia de 3 semanas, a dosis fijas, aleatorizado y controlado con placebo en pacientes pediátricos de 10 a 17 años con trastorno bipolar I, el
En un ensayo de doble-ciego con controles placebo diseñado para evaluar la eficacia y la seguridad de riluzol en pacientes japoneses, se eligieron al azar 204
En un ensayo clínico multicéntrico, doble ciego, controlado (CNA30024), 654 pacientes infectados por el VIH, no tratados previamente con tratamiento antirretroviral, fueron
Se trata de un ensayo fase III, abierto, multicéntrico, aleatorizado (2:1), de olaparib frente a quimioterapia (capecitabina, vinorelbina o eribulina; a elección
En otro ensayo controlado con comparador activo, doble-ciego, aleatorizado, en pacientes con AR tratados con Enbrel en monoterapia (25 mg dos veces por semana), metotrexato
En Handbook of Attachment: Theory, Research and Clinical Applications, ed..
L a investigación de la farmacología clínica de las drogas comprende el estudio de su farmacodinamia (mecanismo de acción, efectos farmacológicos, adversos y terapéuticos) y de
