Author’s version
STIFFNESS OF COLD ASPHALT
MIXTURES WITH RECYCLED
AGGREGATES FROM
CONSTRUCTION AND DEMOLITION
WASTE
B. GÓMEZ-MEIJIDE, I. PÉREZ, G. AIREY and N. THOM
1 STIFFNESS OF COLD ASPHALT MIXTURES WITH RECYCLED AGGREGATES
FROM CONSTRUCTION AND DEMOLITION WASTE
B. Gómez-Meijide
a,*, I. Pérez
a, G. Airey
band N. Thom
ba
Universidade da Coruña. E.T.S.I. Caminos, Canales y Puertos, Campus de Elviña s/n, 15071. A Coruña, Spain
b
Nottingham Transportation Engineering Centre [NTEC], Department of Civil Engineering, University of Nottingham, Nottingham, UK, NG7 2RD
*Corresponding author. Tel.: +34-981167000. Fax: +34-981167170
E-mail addresses: [email protected] (B. Gómez Meijide), [email protected] (I. Pérez), [email protected]. (G. Airey), [email protected] (N. Thom)
Abstract:
The stiffness of cold asphalt mixtures (CAM)1 with 100% recycled construction and
demolition waste aggregates (CDWA)2 was studied from three different points of view: the
indirect tensile stiffness modulus (ITSM)3, the dynamic modulus at different temperatures and
frequencies and the correlation between them. It was found that CAM with CDWA frequently
achieved higher stiffness than control mixes using natural aggregate (NA)4, but that they
required significantly higher bitumen and water contents. They were less temperature
susceptible, therefore potentially more fatigue resistant, but more complicated to design.
Finally, a clear dependency on the compaction process (static and gyratory) was also found.
Keywords: Construction and Demolition Waste, cold asphalt mixture, stiffness, dynamic modulus, master curves
CDWA – Construction and Demolition Waste Aggregates
3
ITSM – Indirect Tensile Stiffness Modulus
2 once compacted, weak early life strength and long curing times required to achieve an optimal
performance, they have been traditionally considered inferior to hot mix asphalt (HMA)5 over
recent decades [1]. Thus, the use of CAM is still restricted in many cases to surface treatment
and reinstatement work on low trafficked roads and walkways, being less commonly found in
structural layers [2-5].
On the other hand, wide research is being carried out nowadays in order to minimize these
mechanical disadvantages, for instance, by modifying the emulsified asphalt binders or
incorporating a certain amount of cement into the mixture [6-9]. Thus, these mixtures are
regaining their importance within the asphalt world market, having currently reached annual
production levels of 1.5 million tones in France or 2 million tones in Turkey, for example [10].
Besides, there are numerous properties that make them more suitable than HMA under certain
circumstances. For instance, they have lower energy consumption, reduced ecological impact,
less occupational hazards for operators, lower economic costs, and a reduced tendency to
cracking thanks to their flexibility. Furthermore, they are storable at ambient temperature prior
to use, which makes them especially suitable for low/medium traffic local roads, often located
far from manufacturing plants.
In order to improve the ecological and environmental aspects of CAM, numerous researchers
have lately been studying the use and incorporation of waste and by-product materials such as
steel slag, crushed glass and used cylinder oil [11, 12]. According to Al-Busaltan et al. (2012)
[13] four main benefits can theoretically be achieved when utilizing by-product materials in
CAM: absorption of trapped water via the hydration process, improvement in mixture
mechanical properties, cost effectiveness and the ecological benefit factor.
Following this trend and based on the extensive, growing and successful research on HMA
with recycled aggregates from waste materials [14-22], which reinforces this new approach in
pavement engineering, CAM with recycled construction and demolition waste aggregates
3 (CDWA)2 was studied in terms of stiffness, arguably the key property behind other related
phenomena, such as the fatigue cracking or the appearance of permanent deformation under
different load and environmental conditions. In this regard, this paper continues a research
already described in previous publications [23, 24], by analyzing the stiffness of these mixtures
using different measures, such as Indirect Tensile Stiffness Modulus (ITSM)3 and Dynamic
Modulus |E*|, the latter being tested according to a new proposed protocol which allows a better
correlation between the two moduli.
From previous research, the results of ITSM obtained for specimens containing 100% of
CDWA and 100% of natural aggregate (NA)4 and compacted with static uniaxial pressure have
already been published [23, 24]. The aim of this paper, on the other hand, is to compare these
results with those obtained from a series of new specimens of the same mixes, but compacted by
using a gyratory compactor, which nowadays is one of the most common compaction methods
for cylindrical specimens. Thus, the influence of the compaction system on the stiffness could
be assessed. Additionally, these latter samples were used to determine the dynamic modulus and
to model the stiffness behavior by means of master curves.
2. Materials
For this investigation the same aggregate gradation was batched for all the samples. This
gradation was based on the recommendations given by the Spanish Technical Association of
Bituminous Emulsions (ATEB) [25] for GE1 grave-emulsions but slightly modified with less
fine particles in order to keep it within the recommended upper and lower limits after
compaction. As can be seen in Figure 1, the gradation of the construction and demolition waste
aggregates (hereafter CDWA) tended to get modified during mixing and compaction, increasing
the amount of fine and medium sized particles.
The CDWA used for this research was a 100% recycled aggregate, whose composition is
4 aggregates. To a lesser extent, it includes a certain amount of impurities, such as ceramics,
metal pieces, gypsum, plastics or glass. Some of these required the use of an X-ray
diffractogram in order to truly define their source. A natural aggregate (NA) was also used to
give a control mix, subjected to the same tests, comparing the results with the ones obtained for
mixes with 100% of CDWA. In this case, the chosen NA was a hornfels, a metamorphic
siliceous aggregate extracted from a natural stone quarry. The different properties of both
natural and recycled aggregates can be seen in Table 2, notably the low specific gravity and
high water absorption of CDWA which will clearly affect the mechanical and rheological
properties of the bituminous mixtures made from it.
Finally, the binder used was a cationic bitumen emulsion (60% bitumen content) with 100
pen. grade base bitumen.
Table 1. Components of recycled aggregate (% of total dry weight)
Material
Ceramics and masonry materials 3.7% 4.1%
Concrete with metal pieces 1.121% < 0.001% Concrete with textile fibers 0.146% 0.042%
Plaster/gypsum 0.103% 0.012%
Other materials (metal, paper, plastic, glass) < 0.1% 0.1%
Table 2. Characterization of recycled and natural aggregates
Property Recycled
Los Angeles coefficient (UNE EN 1097-2 [29]) 38 14
Bulk specific gravity (UNE EN 1097-6 [30]) 2.64 t/m3 2.78 t/m3
Dry specific gravity (UNE EN 1097-6 [30]) 2.23 t/m3 2.74 t/m3
SSD specific gravity (UNE EN 1097-6 [30]) 2.39 t/m3 2.75 t/m3
5
Figure 1. Aggregate gradation of CDWA before and after compaction compared with ATEB recommendations
3. Laboratory testing program
3.1 Specimen production
The aim of the authors was not simply to produce samples with optimum water and bitumen
contents and to test them in different ways, but to produce samples with different water and
bitumen contents in order to assess how the stiffness is affected by both parameters. Therefore,
none of the recognized mix design methods, such as the Modified Hveem method, the Marshall
Method or empirical formulae [31], was used for this paper. As mentioned, the samples were
produced by varying the bitumen content while fixing the water content and vice versa, and
manufacturing specimens containing 100% CDWA and others containing 100% NA. As such,
the variations in properties due to either the water or bitumen content, as well as aggregate
source, should be clear and easily understood, and optimal values will be real and not simple
estimations. Hereafter, when the results are referenced to a certain bitumen and/or water content
6 during the mixing process (as a percentage of the weight of dry aggregate). As will be seen, this
content is quite different from that present inside the samples after the compaction and curing
processes. Similarly the bitumen content, when nothing else is specified, will mean the residual
bitumen content present in the samples after the compaction and curing processes. Similarly the
bitumen content, when nothing else is specified, will mean the residual bitumen content present
in the samples after the compaction and curing processes.
The initial water and bitumen contents were chosen from those used in previous research in
which many contents were tested to determine the optima relating to different mechanical
properties [23, 24]. In this research just the most significant contents (near and far from the
optima) were taken in order to determine the trends in the stiffness results.
In order to assess if the compaction method can affect the stiffness of CAM, the results
obtained for specimens compacted with a static press, and whose results have been previously
published [23, 24], were taken as a reference. These cylindrical samples had been compacted by
the application of a static axial pressure of 21 MPa applied for 2 min after a 1-min preload at 1
MPa, according to Spanish specific standards for CAM, such as the Compressive Strength test
(NLT-161) and Immersion-Compression test (NLT-162) [32].
For this research, a new series of cylindrical samples (3 for each water-bitumen content)
were produced by the application of 250 revolutions of a gyratory compactor, set at 600 kPa
axial pressure and an angle of gyration of 1.25º in order to compare how the compaction method
affects the stiffness of the mixes. The high number of gyrations was needed in order to obtain
values of specific gravity and voids content as close as possible to the ones that had been
obtained by the static compaction. A further increase in the number of gyrations was rejected so
as not to modify the aggregate gradation, especially in the case of samples with 100% CDWA.
The values of specific gravity and voids content were calculated by using the formulae given by
7 These new samples compacted with the gyratory compactor were used to test the stiffness of
the mixes in terms of dynamic modulus, giving master curves, but since they are
non-destructive, ITSM tests on the same samples could be done prior to dynamic modulus testing.
In both cases, the aggregates were washed, dried and batched according to the specified
gradation and mixed in a vertical mixer with 10 g pre-wetting water for 30 sec in order to avoid
the loss of fine particles, while keeping a good homogeneity in the mixture. This pre-wetting
water content was also important to avoid the balling of the binder with the fines portion of the
aggregate and thus unsatisfactory coating [23]. Afterwards, the bitumen emulsion and remaining
water were added and mixed for 90 sec, until a satisfactory coating was achieved and the
compaction process was implemented. After compaction, the samples were subjected to a 3-day
curing period in an oven at 60ºC, according to the ATEB recommendations [25].
3.2 Indirect tensile stiffness modulus (ITSM)
The ITSM test was carried out following EN 12697-26, Annex C. Therefore, 5
semi-sinusoidal impulses with a total duration of 3 sec, consisting of a rise time of 124 ms and a
visco-elastic deformation recovery, were conducted in a regime of deformation control (5 µm).
Three specimens were tested per bitumen/water content and a Poisson’s ratio of 0.35 was
assumed. The modulus was calculated as follows for each pulse:
ITSM=F(ν+0.27)/(z·h) (1)
where ITSM is the indirect tensile stiffness modulus (MPa), F represents the peak value of
the applied vertical load (N), z is the amplitude of the horizontal deformation obtained during
the load cycle (mm), h is the mean height of the cylindrical specimen (mm) and ν is Poisson’s
ratio. The final value for each water and bitumen content was calculated as the average value of
8 To evaluate the thermal sensitivity of the mixtures, indirect tensile stiffness modulus (ITSM)
tests were conducted at three different temperatures. The mixes compacted with the gyratory
compactor were tested at 2ºC, 20ºC and 40ºC, obtaining results over a wide range of
temperatures. A minimum temperature of 2ºC instead of 0ºC was selected to avoid the possible
freezing of internal mixing water. The ITSM results already published for mixes compacted
with a static press had been tested at 2ºC, 10ºC and 20ºC. As can be seen, in this case, a wider
range of temperatures was selected for the new series of specimens compacted with the gyratory
compactor. This way, two temperatures are still comparable to the other samples (2ºC and 20ºC)
and the effect of a temperature as high as 40ºC could also be assessed.
3.3 Dynamic modulus and master curves
Besides the ITSM, the stiffness of CAM with CDWA and NA was studied in terms of
Dynamic Modulus |E*|. The dynamic modulus is defined as the absolute value of the complex
modulus, which relates stress to strain for linear viscoelastic materials subjected to continuously
applied sinusoidal loading in the frequency domain. Being σ = σ0 sin(ωt), the sinusoidal stress
(at any given time, t, and angular load frequency, ω) and ε = ε0sin(ωt-φ), the sinusoidal strain,
the complex modulus can be defined as the ratio of the amplitude of the sinusoidal stress (σ0)
and the amplitude of the sinusoidal strain (ε0), at the same time and frequency [33, 34]:
|E*|= σ0/ε0 (2)
In order to get a reliable correlation between ITSM and dynamic modulus, the original
AASHTO Standard TP 62-07 was adapted by placing the specimens and loads in the same way
as for the ITSM test. This means that the cylindrical specimens were placed on their edge and
the dynamic loads were applied diametrically. Therefore, the indirect tensile dynamic modulus,
denoted here after by |ITE*|, is calculated, analogously to equation 6, although this time the
vertical load is a continuous sinusoidal wave, with no rest periods between pulses and applied at
9
|ITE*|=F(ν+0.27)/(z·h) (3)
where again, F is the peak value of the applied vertical load (N) at a certain frequency, z is
the amplitude of the measured horizontal deformation obtained during the load cycle at a certain
temperature (mm), h is the mean height of the cylindrical specimen (mm) and ν is Poisson’s
ratio.
Table 3. Test sequences according to AASHTO Standard TP 62-07
Sequence Cycles Frequency
Following, from this point on, the AASHTO Standard TP 62-07, preconditioning cycles and
6 different loading sequences were applied as presented in Table 3. A 2-minutes rest period was
used between each sequence to allow some specimen recovery before applying the new loading
at a lower frequency. For each sequence, the value of |ITE*| was taken as the average value of
the last 5 cycles. The whole process was repeated at 3 different temperatures: 2ºC, 20ºC and
40ºC. Testing began at the lowest temperature and proceeded to a higher temperature in order to
minimize potential damage to the specimens. In the same way, the testing began with the
highest frequency of loading and proceeded to a lower frequency, for each of the given
temperatures. The applied load was selected in order to keep the strain magnitude between 50
µε and 150 µε, as recommended by the Standard.
Using the principle of time-temperature superposition, the master curves [35] can be
constructed by fixing a reference temperature (in this case 20ºC) and shifting the data with
respect to time until the curves merge into a single smooth function. The amount of shifting at
each temperature required to form the master curve describes the temperature dependency of the
material. In general, the master modulus curve can be mathematically modeled by a sigmoidal
10
log|𝐸∗| = 𝛿 + 𝛼
1+𝑒𝛽+𝛾(log 𝑡𝑟) (4)
Where tr is the reduced time of loading at the reference temperature; δ is the minimum value
of E*; the sum δ + α is the maximum value of E* and the parameters β and γ describe the shape
of the sigmoidal function. Data shifting is made by using a shift factor, whose form for a certain
temperature of interest (T) is:
a(T)=t/tr (5)
where t is the time of loading at the desired temperature and tr is the reduced time of loading
at the reference temperature. Using Excel’s Optimization Solver function, all model parameters
(α, β, δ, γ) were obtained by minimizing the sum of the squares of the errors of the Sigmoidal
model with respect to the real |ITE*| values obtained in the laboratory. For precision, the
following second order polynomial relationship was used to mathematically obtain the shift
factor for a temperature of interest and to solve the parameters a, b and c together with those
mentioned previously:
Log a(Ti) = a·Ti 2
+ b·Ti + c (6)
In order to minimize the damage to the specimens and to obtain the best correlation possible
between ITSM and Dynamic Modulus, both tests were conducted one after the other before
raising the temperature to the next level. Furthermore, the ITSM test was carried out first for
each temperature, since it involves fewer load cycles. This way, both tests were performed with
the same samples for each bitumen and water content, thus keeping the uncertainty lower than
by producing different samples (one for each test) and ensuring that the correlation is almost
perfect.
4. Results
11 The values of specific gravities, void contents and water contents obtained for the specimens
made with the gyratory compactor and both sources of aggregate are shown in Table 4 while the
values obtained with static compaction are presented in Table 5. The results are referenced to
mixes with different bitumen and water contents during the mixing process.
Table 4. Volumetric properties of samples compacted with gyratory compactor
%
compactor. When compacted with the static press the density of CDWA specimens was 17.5%
lower and the voids content 24% greater, giving a more pronounced effect in this case. In
mixing process and, unless stated otherwise, the bitumen content quoted will also be the initial
12 gyratory compactor lost water easily during the curing process. Furthermore, the specific gravity
tended to decrease when the compaction was carried out with the gyratory compactor, while the
voids content tended to be greater, which indicates that the compaction was not as efficient with
the gyratory compactor as with the static press. It is true that the static press was much more
energetic but the number of cycles of the gyratory compactor could not be set beyond 250
revolutions in order to maintain the selected gradation within the limits. All this will clearly
affect the mechanical and rheological properties of the mixes.
Table 5. Volumetric properties of samples compacted with static press
%
The results of ITSM right after the 3-days curing time are shown in Table 6 for samples with
different bitumen/water contents, sources of aggregate and compacted with static and gyratory
compaction processes.
As can be seen, the results depend on the compaction process. Thus, the ITSM obtained for
specimens with static press compaction tend to be higher than those made with the gyratory
compactor at any temperature, which was expected since, as described above, the compaction is
more powerful. For example, at 20ºC, the peak ITSM values obtained for mixes with CDWA
13 same trend was found: 2537 MPa and 2124 MPa respectively. At 2ºC, the same effect is seen
for mixes with NA, where the values were 11096 MPa against 9854 MPa, although for mixes
with CDWA, and only in this case, a surprisingly high value of 7854 MPa was obtained for a set
of gyratory compacted specimens. With this exception, the static press values were higher than
those for the gyratory compactor.
Table 6. ITSM (MPa) obtained for samples compacted with static press at 2ºC, 10ºC and 20ºC and gyratory compactor at 2ºC, 20ºC and 40ºC
%
The optimal bitumen and water contents are not clear in CAM with CDWA and compacted
with the static press. As can be seen, at 2ºC, the peak ITSM value (7611 MPa) is given by 7%
bitumen and 33% water. At 10ºC (5778 MPa) the optimal water content is 9% and at 20ºC
(3515 MPa) the optimal contents are 6% bitumen and 9% water. So it seems that the optimal
water and bitumen contents tend to decrease when the test temperature is higher. In fact, in [23]
these optimal contents were 7% bitumen and 30% water at 2ºC and 5% bitumen and 15% water
at 20ºC, which confirms this trend. This can be explained taking into account that the bitumen at
high temperatures loses much of its stiffness, becoming a soft element in the mix. Therefore, the
greater the bitumen content, the softer the mix at high temperatures. Anyway, if a single set of
optima is needed, 7% bitumen and 9% water content could be chosen as a compromise solution
14 In contrast, the mixes compacted with gyratory compaction showed clear optimal bitumen and
water contents of 7% and 21% respectively at all temperatures.
With NA, as reported in [23] the optimal contents are 4% bitumen and 3% water at any
temperature when the mixes were compacted with the static press, while for mixes compacted
with the gyratory compactor the optima are 4% bitumen and 9% water.
As can be seen, CDWA mixes need a higher bitumen content in order to reach their optima,
which partially reduces the environmental benefits of using a recycled aggregate instead of a
natural aggregate. However, the density of 4%-bitumen-content NA mixes is around 22%
higher than that of 7%-bitumen-content CDWA mixes. This means that for a certain length of
road, the mass of NA, which should be used is 22% higher than that of CDWA. Thus, the
increase in bitumen content per unit volume is not 75% (from 4% to 7%) but just 40%.
Furthermore, and as mentioned above, other beneficial aspects, such as the reduction of natural
stone quarrying, waste landfills and disposals, as well as economic issues, such as the reduction
of raw materials costs, must be taken into account.
In general, mixes compacted with the gyratory compactor need more water during the
mixing process than those compacted with the static press. This makes perfect sense since mixes
compacted with the static press retain more water inside after the compaction and curing
processes. The high absorption of CDWA can cause premature breaking of the asphalt emulsion
if the water content is too low during the mixing process, but too much water may result in
inefficient compaction. For this reason, it is beneficial that mixes admit more water during the
mixing process (reaching high values, such as the 21% or 33% tested), but mixes compacted
with the static press reach the upper limit earlier and therefore this water content must be
reduced.
In addition, another peculiar trend already observed in [23] could be confirmed: while at low
temperature the mixes with NA were stiffer, when the temperature increased, this trend was
15 temperatures as mixes with NA which makes them more thermally stable. It may therefore be
that incorporating CDWA into CAM may help to avoid fatigue cracking at low temperature and
permanent deformation at high temperature, although these assertions have yet to be studied.
4.3 Dynamic modulus and master curves
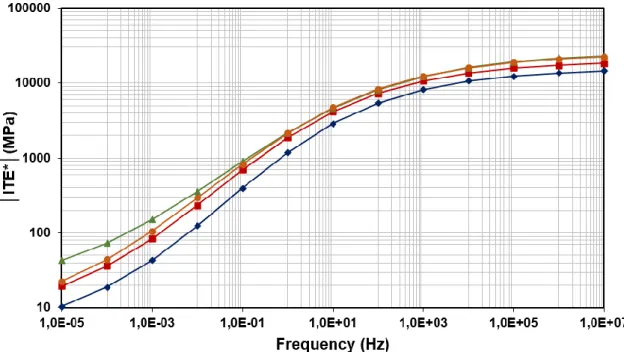
The results of |ITE*| obtained for the mixes compacted with the gyratory compactor at
different testing frequencies and temperatures are shown, graphically, in Figures 2 and 3. With
these results, and by using a shift factor to shift the data with respect to time for a reference
temperature of 20ºC, the master curves were plotted as shown in Figures 4 to 7. The model
parameters (α, β, δ, γ) and the shift factors are presented in Table 7.
In the first place, seeing the results of samples with 100% CDWA (Figure 2), it can be
noticed that there are significant differences in master curves with variation of bitumen content
(Figure 4), but almost no difference with variation of water content (Figure 5). At low
temperatures (right part of the master curves) the optimal bitumen content is 7%, while at high
temperatures (left part) the optimal bitumen content is 5%, and the mixes become less stiff as
the bitumen content increases.
For the case of CAM with NA, the master curves vary again more with the changes in
bitumen content (Figure 6), although this time, greater variations also appear with changes in
water content (Figure 7). Moreover, an optimal bitumen content of 4% is clear for the whole
range of frequencies and temperatures. When it comes to water content, the smallest of the three
contents tested (3%) was the optimum and adding more water progressively produced softer
mixes.
By comparing the two mixes in a general way, it can be seen how the master curves obtained
for mixes with CDWA (Figures 4 and 5) have a lower slope than those obtained with NA mixes
(Figures 6 and 7). What this means is that CAM with NA is stiffer at low temperatures and
softer at high temperatures than mixes with CDWA. This greater dependency on temperature of
16 CAM with CDWA (Table 7). Therefore, CAM made with CDWA is more stable with
17
Figure 2. |ITE*| values obtained for mixes with 100% of CDWA at different testing
18
Figure 3. |ITE*| values obtained for mixes with 100% of NA at different testing frequencies
19
Figure 4. Mater curves obtained for mixes with 100% of CDWA for a fixed water (9%)
content and different bitumen contents
Figure 5. Mater curves obtained for mixes with 100% of CDWA for a fixed bitumen (7%)
20
Figure 6. Mater curves obtained for mixes with 100% of NA for a fixed water (3%) content
and different bitumen contents
Figure 7. Mater curves obtained for mixes with 100% of NA for a fixed bitumen (4%) content
21
Table 7. Master curves model parameters (α, β, δ, γ) and shift factors Log a(T) at different temperatures for mixes with CDWA and NA
%
It is notable that practically all the results for |ITE*| confirm the conclusions already derived
from the ITSM tests. Taking this as proof of a correlation between the two parameters, the
Stiffness Correlation Factor was defined as follows:
SCF = |ITE*| / ITSM (7)
For each of the 6 water/bitumen combinations for samples compacted with the gyratory
compactor and for each of the 3 test temperatures (2ºC, 20ºC and 40ºC), 7 values were obtained:
on the one hand the ITSM and on the other hand the |ITE*| at 6 different frequencies (25 Hz, 10
Hz, 5 Hz, 1 Hz, 0.5 Hz and 0.1 Hz). With the aim of finding which of these frequencies
produced values of |ITE*| closest to ITSM, the results were plotted together as shown in Figures
8 and 9. There, each line is a different combination of the same ITSM and the |ITE*| at one
specific frequency. The diagonal line would correspond to a perfect correlation 1:1, i.e. where
22 In these figures, it can be seen how the higher load frequencies of 25 Hz, 10 Hz and 5 Hz
produce high and similar correlations (SCF in the order of 1.3 – 1.5), medium frequencies (1 Hz
and 0.5 Hz) produce SCF close to 1.0 and the lower frequency of 0.1 Hz produces SCF close to
0.6 – 0.7. For mixes with 100% NA, the best correlation (SCF=1) is the one obtained at 0.5 Hz,
while for mixes with CDWA, it is between 0.5 and 1 Hz. This trend contrasts with the 5 Hz
suggested by other publications [36] for hot mix asphalt although in that case the tests had been
carried out with cylindrical specimens under axial dynamic loads. This means that in this case,
the SCF is larger than the one obtained in [36] or, to put it another way, either |ITE*| tends to be
extraordinarily high or ITSM tends to be extraordinarily low. One possible explanation is that,
since the dynamic modulus test involves a continuous load wave, while the ITSM involves a
23
Figure 8. Correlation between |ITE*|and ITSM at different test frequencies for cold asphalt
24
Figure 9. Correlation between |ITE*|and ITSM at different test frequencies for cold asphalt
mixes with 100% of NA
5. Conclusions
It is already clear that incorporating CDWA to CAM may make the material more
ecologically sustainable although the increased binder demand has to be borne in mind. The
proposed CAM-CDWA mix can be well-suited for low/medium-strength application in which
case the weaker physical qualities of CDWA are not relevant. Furthermore, the CAM-CDWA
mixtures entrain higher air voids, and this can translate into advantage favorable to porous
asphalt mixtures. However, based on this paper, and from the point of view of stiffness, other
advantages were found. Thus, the main conclusions can be listed as follows:
1. The incorporation of CDWA to CAM gives a lower specific gravity and greater voids
25 the voids content tends to reduce. With the increase of water content during the
mixing process, these trends are not clear.
2. After the compaction process, the mixtures with 100% CDWA contained around 3
times the amount of water inside compared to mixtures with NA. After curing, mixes
with CDWA still had a greater amount of water inside, although this value fell, in
general, below 2%. All these considerations will affect the mechanical properties of
CAM with CDWA, as well as the curing process.
3. CAM with CDWA requires higher bitumen contents to reach peak ITSM and |ITE*|
values due to higher aggregate absorption. The high absorption of CDWA can also
cause premature setting of the asphalt emulsion if the water content is too low during
the mixing process. Thus large amounts of water are needed during the mixing process
even though after compaction and curing the remaining water content was less than
2%.
4. In general, the stiffness of CAM depends much more on bitumen content than on
water content during the mixing process. Thus, the master curves obtained by varying
the water content were practically identical, although some differences were found in
ITSM.
temperatures. This makes mixes with CDWA more complicated to design.
6. Mixes with NA were stiffer at low temperatures and softer at high temperatures than
26 temperature changes, and therefore, it may potentially help CAM to avoid fatigue
cracking at low temperatures and excessive permanent deformation at high
temperatures.
7. Practically the same conclusions were extracted from the study of both ITSM and
|ITE*|, which clearly proves the existence of a close relationship between the two
moduli. By plotting together the results of both tests, it was found that the load
frequency of |ITE*| which produces the closest values to ITSM is 0.5 Hz for mixes
with NA and between 0.5 and 1 for mixes with CDWA. This behavior observed with
CAM contrasts with other experience developed with hot mix asphalt.
8. Finally, a dependency on the compaction process was also found. When comparing the
results obtained from mixes compacted in a gyratory compactor, with those compacted
with a static press, it could be seen that specific gravities were lower while voids
contents were higher. However, this seems to help the water to get out of the sample
during the compaction and curing processes. In the same way, the stiffness of mixes
compacted with the gyratory compactor could not reach the values that had been
obtained with the static press. Moreover, the optimum bitumen contents were the same
with both compaction methods, but the optimum amount of mixing water was slightly
greater when the mix was compacted with the gyratory compactor, for mixes with
both natural and recycled aggregates.
The authors consider that, due to the observed dependency of the results on aggregate type,
preparation protocols, compaction instruments, etc. a translation of laboratory findings to real
applications should be an important and necessary (downstream) challenge. Thus, these
conclusions, together with those extracted from other publications mentioned, must be
considered as an encouraging starting point for the understanding of CAM with CDWA.
27 The authors would like to acknowledge the funding of the project BIA2010-17751 and the
scholarship FPI (ref. BES-2011-044377) from the Spanish Ministry of Economy and
Competitiveness. Furthermore, the whole research gathered in this paper was carried out during
a research stay by the author Breixo Gómez Meijide at the Nottingham Transportation
Engineering Centre (The University of Nottingham, UK). This research stay was also funded by
a scholarship from the Spanish Ministry of Economy and Competitiveness (ref.
EEBB-I-14-07956). Finally, the authors wish to express their sincere gratitude to the GESTAN Group for
the CDWA and to ECOASFALT for the bitumen emulsion that were generously donated for the
present research.
References
[1] Thanaya INA, Zoorob SE, Forth JP. A laboratory study on cold-mix, cold lay emulsion
mixtures. Proc Inst Civ Eng 2009;Transport 162:47-55
[2] Nageim Al H, Al-Busaltan SF, Atherton W, Sharples G. A comparative study for improving
the mechanical properties of cold bituminous emulsion mixtures with cement and waste
materials. Constr Build Mater 2012;36:743-8
[3] Read J, Whiteoak D. The shell bitumen handbook. London: Thomas Telford Publishing;
2003.
[4] Highway Authority and Utility Committee (HAUC). Specification for the reinstatement of
opening in highways, new roads and street works. In: Act 1991. London, UK: HMSO;
1992
[5] James A. Overview of asphalt emulsions. Asphalt emulsion technology, Transportation
Research Circular Number E-C102. Washington DC (USA): Transportation Research
Board; 2006
[6] Oruc S, Celik F, Akpinar MV. Effect of Cement on Emulsified Asphalt Mixtures. J Mater
Eng Perform 2007;16:578-583
[7] Thanaya INA. Evaluating and improving the performance of cold asphalt emulsion mixes.
28 [8] Rutherforda T, Wangb Z, Shua X, Huanga B, Clarkec D. Laboratory investigation into
mechanical properties of cement emulsified asphalt mortar. Constr Build Mater
2014;65:76-83
[9] Chávez-Valencia LE, Alonso E, Manzano A, Pérez J, Contreras ME, Signoret C. Improving
the compressive strengths of cold-mix asphalt using asphalt emulsion modified by
polyvinyl acetate. Constr Build Mater 2007;21:583-589
[10] European Asphalt Pavement Association (EAPA). Asphalt in figures. EAPA; 2012
[11] Thanaya I. Improving the performance of cold bituminous emulsion mixtures incorporating
waste materials. PhD thesis. The University of Leeds (UK); 2003
[12] Borhan, MN, Suja F, Ismail, A, Rahmat, RAOK. Used cylinder oil modified cold-mix
asphalt concrete. J Appl Sci 2007;7:3485-91
[13] Al-Busaltan S, Nageim H, Atherton W, Sharples G. Green bituminous asphalt relevant for
highway and airfield pavement. Constr Build Mater 2012;31:243-50
[14] Mills-Beale J, You Z. The mechanical properties of asphalt mixtures with Recycled
Concrete Aggregates. Constr Build Mater 2010;24:230-5
[15] Pérez I, Gallego J, Toledano M, Taibo J. Asphalt mixtures with construction and
demolition debris. Proc Inst Civ Eng. Transport November 2010;163:165-74
[16] Shen DH, Du JC. Application of gray relational analysis to evaluate HMA with reclaimed
building materials. J Mater Civ Eng. 2005:17:400-6.
[17] Paranavithana S, Mohajerani A. Effects of recycled concrete aggregates on properties of
asphalt concrete. Resour Conserv Recycl 2006;48:1-12
[18] Wong YD, Sun DD, Lai D. Value-added utilization of recycled concrete in hot-mix
asphalt. Waste Manag 2007;27:294-301
[19] Chen MZ, Lin JT, Wu SP. Potential of recycled fine aggregates powder as filler in asphalt
mixture. Constr Build Mater 2011;25:3909-14
[20] Pasetto M, Baldo N. Mix design and performance analysis of asphalt concretes with
29 [21] Wu S, Zhu J, Zhong J, Wang D. Experimental investigation on related properties of asphalt
mastic containing recycled red brick powder. Constr Build Mater 2011;25:2883-7
[22] Akbulut H, Gürer C. Use of aggregates produced from marble quarry waste in asphalt
pavements. Build Environ 2007;42:1921-39
[23] Gómez-Meijide B, Pérez I. Effects of the use of construction and demolition waste
aggregates in cold asphalt mixtures. Constr Build Mater 2014;51:267-77
[24] Gómez-Meijide B, Pérez I. A proposed methodology for the global study of the mechanical
properties of cold asphalt mixtures. Mater Des 2014;57:520-7
[25] Technical Association of Bituminous Emulsions (ATEB). Gravel-emulsion specifications.
ATEB (consulted on-line in http://ateb.es/images/pdf/PLI_GRAVA.pdf last time on
04/08/2014)
[26] AENOR. Asociación Española de Normalización y Certificación. UNE EN 933-3. Ensayos
para determinar las propiedades geométricas de los áridos. Parte 3: Determinación de la
forma de las partículas. Índice de lajas. Madrid (Spain); 2012
[27] AENOR. Asociación Española de Normalización y Certificación. UNE EN 933-5. Ensayos
para determinar las propiedades geométricas de los áridos. Parte 5: Determinación del
porcentaje de caras de fractura de las partículas de árido grueso. Madrid (Spain); 1999
[28] AENOR. Asociación Española de Normalización y Certificación. UNE EN 933-8. Ensayos
para determinar las propiedades geométricas de los áridos. Parte 8: Evaluación de los finos.
Ensayo del equivalente de arena. Madrid (Spain); 2000
[29] AENOR. Asociación Española de Normalización y Certificación. UNE EN 1097-2.
Ensayos para determinar las propiedades mecánicas y físicas de los áridos. Parte 2:
Métodos para la determinación de la resistencia a la fragmentación. Madrid (Spain); 2010
[30] AENOR. Asociación Española de Normalización y Certificación. UNE EN 1097-6.
Ensayos para determinar las propiedades mecánicas y físicas de los áridos. Parte 6:
Determinación de la densidad de partículas y la absorción de agua. Madrid (Spain); 2006
[31] Asphalt Institute. Asphalt Cold Mix Manual. Manual Series No. 14 (MS.14). 3rd ed.
30 [32] Ministerio de Obras Públicas y Transportes. Normas NLT. Ensayos de carreteras.
Dirección General de Carreteras. 2nd ed. Madrid (Spain): 2002.
[33] Witczak MW, Bari J. Development of a master curve (E*) database for lime modified
asphaltic mixtures. Research Project. Arizona State University (USA); 2004
[34] Lee H, Kim Y, Han B. Laboratory performance evaluation of CIR-emulsion and its
comparison against CIR-foam test results from phase II. Final Report TR-578 Phase III.
The University of Iowa (USA); 2009
[35] National Center for Asphalt Technology at Auburn University (NCAT). Hot Mix Asphalt
Materials, Mixture Design and Construction. 3rd ed. Lanham, Maryland; 2009
[36] Ping XV, Xiao Y. Empirical correlation of indirect tension resilient modulus and complex
modulus test results for asphalt concrete mixtures. Road Mater Pavement Des