P
rograma de doctorado en
I
nformática
TESIS DOCTORAL:
R
obust and affordable localization and
mapping for 3
D
reconstruction
.
A
pplication to architecture and
construction
Presentada porFrancisco Javier Delgado del Hoyo
para optar al grado de
Doctor por la Universidad de Valladolid
Dirigida por:
For the things we have to learn before we can do them, we learn by doing them.
A B S T R A C T
Three-dimensional reconstruction is the process of estimating the unknown depth of the points in a scene. There are several approaches to solve this problem. For example, depth can be retrieved using active sensing (e. g., laser scans) or passive sensing (e. g., digital images). The former provides more ex-pensive, accurate and clean measurements, whereas the latter provides mul-tiple affordable noisy measurements. Both of them can capture the color of the point according to the radiance perceived by the sensor. Hence, the funda-mental differences between active and passive sensing concern the acquisition cost of the device and the accuracy of the delivered measurements.
Recent advances in passive sensing technologies have presented them as a compelling alternative to active sensing. Digital cameras are ubiquitous nowa-days thanks to the popularization of smartphones. However, conventional3D
reconstruction is still not feasible on such devices due to the high computa-tional demand of resources. The scientific community has stepped into this possibility with outstanding contributions in the last five years. Our research aims at joining to this effort, advancing in robust solutions that operate in most devices and scenes. At the same time, a good accuracy is advisable, especially in sequences recorded without challenging conditions.
Affordable and ubiquitous technologies for3D reconstruction pave the way
for wider adoption of 3D digitalization. Three-dimensional reconstruction
al-lows users to digitize buildings and other environments that serve as a source of documentation in more advanced applications. This sort of documentation is highly demanded by the Architecture Engineering and Construction (AEC) industry to keep track of the construction progress or to save the state of the building before a refurbishment. In addition, information from traditional2D
images can be augmented with the associated3D model.
Passive devices capture information about their environment and repre-sent it with images. Image-based 3D reconstruction estimates the depth of
any point based on its projection on multiple images. When this estimation is repeated for a large number of corresponding points in images, a point cloud of the scene is generated. In these devices, algorithms must deal with the un-certainty introduced by a large number of noisy measurements. Fortunately, such problems have been investigated by the robotics community in Simulta-neous Localization and Mapping (SLAM), which comprises the algorithms for tracking the camera pose at the same time that the map of the scene is being reconstructed. In this sense, SLAM can be perceived as a natural extension of
3D reconstruction when applied to robot navigation.
Our aim is to provide an accurate3D reconstruction with color point clouds
of the scene from an off-the-shelf single-lens camera moving around the scene. In order to achieve this goal, we have developed KN-SLAM, a SLAM system that takes advantage of the contributions introduced by Oriented FAST and Rotated BRIEF (ORB)-SLAM [88]. The system follows a sparse indirect ap-proach, guided by the ORB features detected on each frame. This is the most suitable approach for commodity cameras since their rolling shutter
duces photometric artifacts that difficult the tracking of the pixels. The track-ing, mapptrack-ing, loop detection and relocalization stages of the SLAM pipeline rely on the quality of such features. More concretely, our contributions are the following:
• an adaptive bootstrapping procedure that takes into account the number of failures;
• an exhaustive, non-greedy, 2D-3D guided matching algorithm that
en-sures correspondences with a minimum distance between descriptors;
• a constrained connectivity graph where each keyframe is linked to its K-best keyframes to keep the minimum number of edges but preserve the accuracy; and
• a loop detection procedure based on smart thresholds selected accord-ing to the results achieved in previous optimizations.
We have conducted an exhaustive evaluation of KN-SLAM in47sequences belonging to four heterogeneous datasets. The file formats and ground truths provided by these sequences have been normalized so that they can be com-pared following the same methodology. Several metrics have been considered to assess the performance, accuracy, and robustness of the trajectories esti-mated by KN-SLAM and ORB-SLAM. Our experimental results determine that, despite the high performance achieved by ORB-SLAM, KN-SLAM is able to improve the accuracy and robustness in more than half of the sequences, although it depends on the challenges introduced by such sequences. To gain more insight, we have carried out a further analysis of the results taking into account such challenges. We have assessed nine challenging characteristics for each sequence with a value on a five-level scale. This characterization has been combined with a class label for training a SVM classifier. This label cor-responds to the system that achieves a lower Absolute Trajectory Error (ATE) (KN-SLAM or ORB-SLAM). The coefficients of the trained classifier let us an-alyze what characteristics of the scene make KN-SLAM more suitable than ORB-SLAM. From this analysis, we have determined that KN-SLAM reduces the ATE in sequences with a good balance between rotations and translations, visual loops and poor illumination conditions. We conclude that the restricted connectivity of the graph harms the accuracy of the tracking when the cam-era is performing violent movements like pure rotations, but it helps to reach lower ATE when loops are closed and the drift is still tolerable.
The output of a SLAM system is usually discrete (i. e., it is a point cloud in-stead of a triangulated3D mesh). The mesh can be achieved by an additional 3D reconstruction stage, which is based on the volumetric fusion of multiple
partial meshes. Different systems in different application domains can include the information provided by the reconstructed mesh in certain functionalities. One of the sectors more interested in 3D reconstruction and digitalization is
the AEC industry. For example, fast and cheap3D models can be applied to
track the state of a construction w. r. t. the prior design. In addition, the sector is slowly transitioning from a CAD-based methodology to the Building In-formation Modelling (BIM) methodology, in which stakeholders collaborate
around a shared model of the building. This model includes both the geom-etry and the semantics of the structural parts and the constructive processes of the building.
Despite the benefits of BIM for the AEC industry, its adoption is being quite lazy. In most cases, it is imposed by the customer of the project. Given our deep knowledge of the sector and the suggestions received from several BIM stakeholders, we aim at fostering the adoption of the BIM methodology with an easy-to-use cross-platform system called3D-SIMOS. More specifically, our
goal is to reduce the gap and pitfalls found at moving from CAD to BIM in the design phase. We address the challenge by providing AEC stakeholders with a solution to manage constructive processes over the structure of the building represented by a 3D mesh. Moreover, 3D-SIMOS does not only
al-low stakeholders to create, simulate, track and monitor the advances of the construction but also to visualize information about the building (e. g., to showcase the building to an interested customer).
Advanced Visualization techniques have been applied to design smart in-terfaces over a cross-platform implementation that exploits the WebGL API of modern web browsers. Any project in3D-SIMOS is generated from standard
CAD 3D model and planning where the tasks and resources are arranged.
Information from both schemas is integrated into the framework proposed by the Industry Foundation Classes (IFC) using a customized alignment between IFC, MPP and COLLADA.
Furthermore, we have proposed an explicit symbolic representation to in-clude dynamics of constructive processed over static representations of the building like IFC. This representation is based on an expandable dual graph that encodes the interconnected spaces of the building. In this graph, we have defined a computational framework for the functionals that evaluates the dy-namic attributes of constructive processes. The evolution of such attributes in time describes a flow, which can be visualized with different types of fields.
This system has been evaluated by combining qualitative and quantitative aspects extracted from interviews with experts of the AEC industry and our experimental results. We have concluded that 3D-SIMOS can promote the
adoption of the BIM methodology by stakeholders that are still not accus-tomed to applying it in their current workflow. In addition, the system oper-ates with good performance on middle-end smartphones and desktops, and it is also easy-to-use. However, some of the stakeholders have noted that the rendering quality of the visualization may not be compelling for showcasing the building to possible customers since computer-generated images are fre-quently accepted for this task. Besides, the oversimplification of the available functionalities makes the system naive from the perspective of a professional user that would require to integrate more powerful tools with3D-SIMOS.
For-tunately, the system was designed with extensibility in mind so the required effort to aggregate new functionalities would be minimal thanks to the under-lying BIM model.
R E S U M E N
La reconstrucción tridimensional consiste en ser capaz de estimar la profun-didad o tercera dimensión de un punto de la escena. Este problema puede ser abordado con diferentes dispositivos y algoritmos. Por ejemplo, los dispositi-vos actidispositi-vos (e. g., escáner láser) se caracterizan por emitir una señal (normal-mente un haz lumínico) que rebota en el objeto y retorna al dispositivo. El tiempo de retorno es proporcional a la profundidad del punto. Por otro lado los dispositivos pasivos (e. g., una cámara digital) simplemente capturan la in-formación del entorno. Los primeros se caracterizan por ser más caros, pero proporcionan información precisa y densa. Los segundos son mucho más ase-quibles y proporcionan mucha más información, pero con mucho más ruido e incertidumbre. Obviamente los algoritmos que se utilizan en cada caso son radicalmente distintos.
Las cámaras digitales están integradas en multitud de dispositivos en la ac-tualidad, lo que las convierte en candidatas a multitud de aplicaciones. Una de ellas es la reconstrucción 3D. Sin embargo los algoritmos que se vienen
aplicando los últimos diez años no pueden implantarse sin más sobre dispo-sitivos con tan escasos recursos. Desde la aparición de KinectFusion, muchas han sido las aportaciones para intentar conseguir resultados similares a un escáner pero con dispositivos mucho más asequibles. Sin embargo los requisi-tos hardware siguen siendo muy alrequisi-tos y los resultados obtenidos sin cámaras RGB-D no tienen la misma calidad visual. Existen multitud de aproximacio-nes distintas en la literatura en función del hardware, del tipo de cámara y de los resultados esperados. Nuestro objetivo es profundizar en este sentido para el caso de una cámara convencional con una sola lente, tratando de ob-tener una solución precisa y robusta al mismo tiempo en diferentes tipos de escenas.
La simplificación y abaratamiento de las tecnologías de reconstrucción3D
hace más accesibles sus resultados en diferentes aplicaciones. La digitaliza-ción de edificios y entornos3D es de suma utilidad para generar
documenta-ción3D con múltiples fines en diferentes industrias. Por ejemplo, en la
indus-tria AEC se utiliza para seguir la evolución de la construcción de un edificio o para capturar el estado actual antes de una rehabilitación. Además un modelo
3D proporciona información suplementaria que se puede superponer sobre la
imagen2D convencional.
La reconstrucción3D en imágenes está basada en las proyecciones de un
punto en el espacio sobre múltiples imágenes. Dicho procedimiento puede repetirse en múltiples puntos correspondientes de imágenes relacionadas pa-ra obtener una nubes de puntos. El principal problema pa-radica en manejar la incertidumbre y el ruido cuando se utilizan dispositivos de baja calidad. Afortunadamente estos problemas han sido estudiados por la comunidad en Robótica en la línea de investigación conocida como Simultaneous Localiza-tion and Mapping (SLAM). Estos algoritmos permiten seguir la posición de la cámara al mismo tiempo que se reconstruye el mapa de la escena, lo cual encaja perfectamente con nuestro objetivo principal: obtener una
ción3D precisa en color de una escena arbitraria y la trayectoria de la cámara
que la recorre usando una cámara simple, de bajo coste y con una sola lente. Para conseguir nuestros objetivos hemos desarrollado KN-SLAM, un sis-tema SLAM basado en las contribuciones desarrolladas por ORB-SLAM. La estrategia seguida es indirecta y dispersa, guiada por las características ORB detectadas en cada nuevo frame. Esta estrategia es la que mejor se adapta a cámaras de baja calidad debido a los artefactos creados por el rolling shutter. Las principales etapas de la tubería de procesamiento dependen de la cali-dad de las características detectadas: seguimiento, mapeado, relocalización y detección de lazos. Más concretamente, nuestras contribuciones podrían resu-mirse en:
• un procedimiento automático de arranque que se adapta al número de fallos en los primeros intentos;
• una búsqueda exhaustiva y no avara de correspondencias entre puntos
3D y 2D que garantice que los pares resultantes son realmente los más
cercanos;
• un grafo de conectividad entre keyframes en el que el número de veci-nos depende del número de observaciones representadas y está limitado a lasKmejores;
• un procedimiento de detección de lazos que aplique umbrales variables en los procedimientos de filtrado de candidatos con RANSAC y las op-timizaciones.
Para evaluar los resultados hemos utilizado un total de 47 secuencias de 4 conjuntos muy diferentes. Estas secuencias han sido normalizadas con el
mismo formato y convenciones para representar el fondo de verdad. Esto per-mite evaluar todas las secuencias utilizando la misma metodología y agilizar la evaluación de nuevas secuencias. Aunque hemos hemos evaluado diferen-tes aspectos, nos hemos centrado en la precisión y la robustez en la trayectoria de la cámara. Nuestros experimentos han demostrado que KN-SLAM mejora los resultados de ORB-SLAM en más de la mitad de las secuencias.
Sin embargo hemos detectado que los resultados varían ligeramente depen-diendo de los retos que presenta cada una de las secuencias. Hemos profun-dizado en este análisis a través de una caracterización de las secuencias en términos de sus retos característicos. Para ello hemos evaluado nueve caracte-rísticas en una escala Likert de 5niveles. Esta caracterización ha sido
combi-nada con una categorización binaria de las secuencias según KN-SLAM haya obtenido una trayectoria más precisa o no. Estos datos son utilizados para entrenar un clasificador SVM con un kernel lineal que simplifica su interpre-tación geométrica. Los valores absolutos de los coeficientes del clasificador son proporcionales a la importancia que cada característica tiene a la hora de obtener mejores resultados y el signo indica si favorece a ORB-SLAM o KN-SLAM.
De nuestro análisis se desprende que KN-SLAM obtiene mejores resultados en secuencias donde la cámara realiza movimientos translacionales y rotacio-nales a partes iguales, tiene algún lazo visual y presenta algunos tramos de
baja iluminación. Podemos concluir que limitar la conectividad del grafo daña la precisión de la trayectoria cuando la cámara realiza movimientos bruscos, tiene relocalizaciones o rotaciones puras. Por otro lado, ayuda a obtener me-jores resultados cuando en la optimización de los lazos siempre que la deriva acumulada no sea excesivamente alta.
La salida proporcionada por SLAM es normalmente discreta, i. e., es una nube de puntos y no una malla con textura. Para conseguir esta malla es necesario incluir en la tubería una etapa adicional de reconstrucción3D que se
basa normalmente en integrar todas las mallas parcialmente reconstruidas en una parrilla volumétrica. La información3D es aplicable en muchos dominios
para sus tareas convencionales. Este es el caso de la arquitectura, ingeniería y construcción (AEC), que demandan digitalización3D para la mayoría de sus
tareas cotidianas. Por ejemplo, para seguir los avances de una construcción podrían reconstruir el resultado una vez obtenido y compararlo con el diseño.
Por otro lado, la industria AEC está evolucionando progresivamente desde el tradicional diseño asistido por ordenador (CAD) hacia una nueva meto-dología basada en el modelado de información del edificio (BIM). En esta nueva metodología las partes involucradas en el diseño, construcción y fun-cionamiento del edificio colaborar alrededor de un modelo compartido. Este modelo incluye tanto información semántica como geométrica del modelo.
A pesar de las grandes ventajas que propone esta metodología, su penetra-ción está siendo más lenta de lo previsto debido principalmente a la comple-jidad del nuevo modelo. En la mayoría de casos es un requisito impuesto por el cliente del proyecto. Gracias a nuestras buenas relaciones con los agentes en la industria AEC hemos podido recoger sus sugerencias con el objetivo de desarrollar una aplicación (3D-SIMOS) que ilustre las ventajas del uso de
BIM. Esta aplicación es sencilla de usar y entender, y es multi-dispositivo. Con ella pretendemos reducir la brecha y los obstáculos iniciales que encuen-tran muchos agentes cuando empiezan a utilizar la metodología BIM. Más concretamente la aplicación permite visualización avanzada de proyectos a partir de una planificación de obra y un modelo CAD 3D. Cualquier agente
puede crear, simular, seguir y monitorizar los avances del proyecto, además de inspeccionar el modelo3D y las tareas planificadas. Por ejemplo, el mismo
proyecto puede ser usado para determinar el estado actual de la construcción y para mostrar el edificio diseñado a posibles clientes.
El soporte multi-plataforma está basado en WebGL, un API que proporcio-nan los navegadores web para obtener acceso a la aceleración por hardware de la GPU. Los proyectos se crean reutilizando artefactos generados en la meto-dología CAD como una planificación en MPP y un modelo3D en COLLADA.
Esta información es integrada en el estándar IFC mediante un alineamiento manual de conceptos que se muestra como una contribución adicional. Ade-más, hemos propuesto un nuevo marco de trabajo para BIM dinámico basado en una representación simbólica en forma de un grafo dual expansible que recoge tanto aspectos estructurales del edificio como de los procesos que se desarrollan en sus espacios. Estos procesos se representan mediante funciona-les que evalúan atributos representabfunciona-les mediante diferentes tipos de campos. Esta segunda parte de nuestra investigación ha sido evaluada combinando aspectos cualitativos (e. g., facilidad de uso) y cuantitativos (e. g., rendimiento)
extraídos de entrevistas con expertos y de nuestros resultados experimenta-les. Hemos concluido que3D-SIMOS ayuda a entender mejor las ventajas de
la metodología BIM, especialmente para aquellos agentes que no la conocen debido a su facilidad de uso y sencillez práctica. La aplicación funciona co-rrectamente en dispositivos móviles de gama media y equipos de escritorio. Sin embargo algunos agentes han indicado en su evaluación que el modelo3D
visualizado carece de la suficiente calidad para mostrar el edificio a posibles clientes. Esta diferencia se aprecia debido a que se comparan los resultados con las imágenes generadas por computador que se utilizan habitualmente en las promociones. También han hecho notar que las simplificación de las funcionalidades en3D-SIMOS podría resultar excesiva desde el punto de
vis-ta de un profesional. En estos casos el sistema está preparado para extender sus funcionalidades bajo el paraguas del modelo BIM subyacente.
P U B L I C AT I O N S
The results obtained from our research are disseminated across different lications. This page provides a complete list of the papers and scientific pub-lications produced by the author of this thesis that are directly related to the contents of the document. In some cases, they are in preparation (i. e., they have not been published yet) because they contain the latest results of our research. Most ideas and figures are included in the following publications:
[1] Francisco Delgado and Javier Finat. “Complete endomorphisms in
Computer Vision.” In: Submitted to the International Journal of Mathe-matical Imaging and Vision (Under revision)(2018).
[2] Francisco Delgado and Javier Finat. “Dynamic Building Information
Modelling with digital cameras.” In:Proceedings of the1st Ibero-American Congress of Smart Cities (ICSC-CITIES2018). Springer,2018.url:http:
//www.icsc-cities2018.com/EN_index.html.
[3] Francisco Delgado, Javier Finat, and Belén Palop. “Accurate and robust
monocular SLAM in natural sequences.” In:In preparation(2018).
[4] Francisco Delgado, Javier Finat, and Belén Palop. “Robust
mathemati-cal modelling for motion from video sequences with a hand-held cam-era.” In: Proceedings of the 7th Iberoamerican Congress on Geometry, Jan-uary 22nd-26th, Valladolid, Spain. University of Valladolid, 2018. url:
http://iberoamericangeometry2018.uva.es.
[5] Francisco Delgado, M. Mercedes Martinez-Gonzalez, and Javier Finat.
“An evaluation of ontology matching techniques on geospatial ontolo-gies.” In: International Journal of Geographical Information Science 27.12
(2013). (JCR, Q1), pp.2279–2301.doi:10.1080/13658816.2013.812215.
[6] Francisco Delgado et al. “Towards a client-oriented integration of
con-struction processes and building GIS systems.” In:Computers in Indus-try73(2015). (JCR, Q2), pp.51–68.
[7] Jose Luis Martínez et al. “Augmented reality to preserve hidden
ves-tiges in historical cities. A case study.” In: The International Archives of Photogrammetry, Remote Sensing and Spatial Information Sciences 40.5
(2015), p.61.
We have seen that computer programming is an art, because it applies accumulated knowledge to the world, because it requires skill and ingenuity, and especially because it produces objects of beauty.
— Donald E. Knuth[69]
A C K N O W L E D G M E N T S
This work has been funded by a scholarship granted by University of Val-ladolid and Santander Bank.
I would like to express my special appreciation and thanks to my advisor Professor Dra. Belén Palop del Río, you have been tremendous mentors to me. I would like to thank you for encouraging my research and for allowing me to grow as a research scientist. Special thanks also to Dr. Javier Finat Codes for providing me the mathematical background required to understand the basics behind Simultaneous Localization and Mapping and to support me daily at work. Your advice and support have been priceless. You have provided me with brilliant ideas, comments, and suggestions. And thanks also to my fellow Ph. D. students at the University of Valladolid, and especially to Beatriz, who has encouraged me in the most difficult moments.
Thank you very much to every single person that made me feel at home during my research stay at Polytechnic University of Catalonia, especially to Dr. Pere Brunet.
Last, but not least, special thanks to my family. Words cannot express how grateful I am to my mother and sister for all of the sacrifices that they have made on my behalf over this period. I would also like to thank my friends for their advice and revisions in the writing process, which prompted me to strive towards my goal. Finally, I would like to express appreciation to my dearest friend Elena who always supports me in the moments when there was no one to answer my queries.
My special gratitude to anyone who has contributed to make this thesis a reality. You are so many that there is not enough space in this document to name you all.
C O N T E N T S
1 i n t r o d u c t i o n 1
1.1 The research framework 3
1.2 Objectives 7
1.3 Outline 8
2 b a c k g r o u n d 10
2.1 Notation 10
2.2 Optimization framework 11
2.3 Simultaneous Localization and Mapping 19
2.4 ORB-SLAM 32
2.5 K-Nearest Neighbors 44
2.6 Surface reconstruction 46
2.7 Building Information Modelling 49
3 a c c u r at e a n d r o b u s t s l a m 60
3.1 Contributions 61
3.2 Methodology 74
3.3 Experimental results 92
3.4 Conclusions 113
4 b u i l d i n g i n f o r m at i o n m o d e l l i n g 119
4.1 Contributions 120
4.2 Methodology 138
4.3 Experimental results 141
4.4 Conclusions 148
5 c o n c l u s i o n s 153
5.1 Discussion 154
5.2 Future work 156
i a p p e n d i x
a a p p e n d i x 159
a.1 Homographies and fundamental matrices 159
a.2 Sequence characteristics 161
a.3 Percentage of Tracked Trajectory 164
a.4 Absolute Trajectory Error 167
b i b l i o g r a p h y 170
L I S T O F F I G U R E S
Figure1.1 Our research framework 4 Figure2.1 Notation 12
Figure2.2 Probabilistic mapping framework 18 Figure2.3 Rolling shutter in cameras 22
Figure2.4 The connectivity graph 24
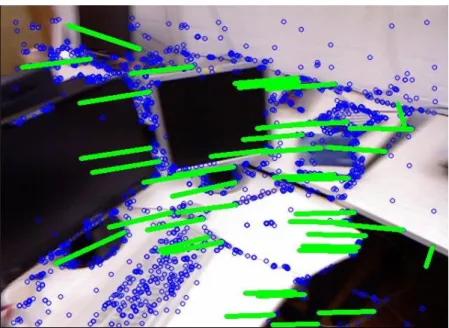
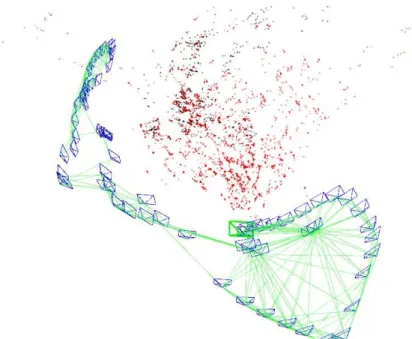
Figure2.5 KDP-SLAM in large indoor environments 26 Figure2.6 Automatic bootstrapping of a sequence 35 Figure2.7 2D-3Dmatching for tracking the camera pose 38
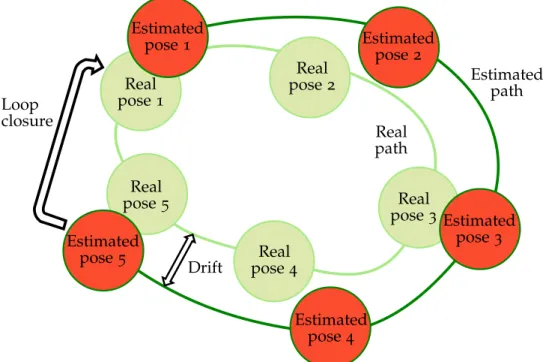
Figure2.8 Generated map of a sequence in the TUM RGB-D dataset 40 Figure2.9 Trajectory of a sequence before and after a loop
clo-sure 42
Figure2.10 Relocalization after camera occlusion 44
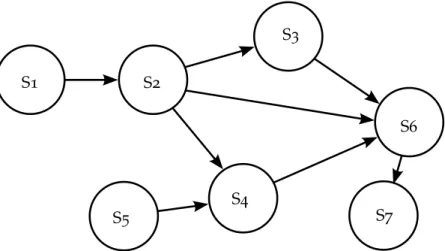
Figure2.11 Volumetric grid for fusing several noisy meshes 46 Figure2.12 Hole filling and noise reduction in3Dmeshes 48 Figure2.13 Example of building infography 50
Figure2.14 Example of directed acyclic graph 56 Figure2.15 Visualization of airflow 57
Figure3.1 Neighbors in a3DDelaunay triangulation 69 Figure3.2 A frame of a sequence in KITTI dataset 76
Figure3.3 A frame of a sequence in TUM RGB-D dataset 77 Figure3.4 A fFrame of a sequence in EuRoC dataset 79 Figure3.5 A frame of a sequence in the ICL-NUIM dataset 80 Figure3.6 Comparison of a trajectory tracked by ORB-SLAM and
KN-SLAM 96
Figure3.7 The false positive loop detected by KN-SLAM in
icl/of_-kt1 97
Figure3.8 Comparison of the ATE achieved by KN-SLAM and
ORB-SLAM in the TUM RGB-D, EuRoC and ICL-NUIM datasets 98
Figure3.9 Comparison of the ATE achieved by KN-SLAM and
ORB-SLAM in the KITTI datasets 99
Figure3.10 Coefficients of the SVM classifier for different
penal-ties 108
Figure3.11 Evolution of the accuracy and the margin of the linear
SVM classifier 108
Figure3.12 Sparse point cloud of the sequencetum/fr2_desk 116 Figure4.1 A cubical complex 123
Figure4.2 The2Dsimplex can be converted to a unit square through
expansions. 124
Figure4.3 The3Dsimplex (a tetrahedron) can be converted to the
unit cubeC3 in two steps. 125
Figure4.4 Alignment of COLLADA and MPP schemas with the
IFC 129
Figure4.5 Binding of tasks and3Dmodel in3D-SIMOS 133
Figure4.6 Task binding to3Dgeometries in3D-SIMOS 134 Figure4.7 Deployment of the components of3D-SIMOS 135 Figure4.8 The real and computer-generated pictures of the
Falling-water house 139
Figure4.9 Main elements of the3D-SIMOS’s GUI 142
Figure4.10 Example of task disable in the Fallingwater use case 143 Figure4.11 Example of highlighted material on task selection 144 Figure4.12 Dialog with the user’s preferences in3D-SIMOS 144 Figure4.13 Computer-generated image of the Fallingwater house 146 Figure4.14 A frame of the simulation of the construction 147
Figure4.15 Comparison of3D-SIMOS in the same web browser on
a mobile or a desktop environment 148
L I S T O F TA B L E S
Table3.1 Traits of datasets 75
Table3.2 Times per frame for different image resolutions 94 Table3.3 Mean number of keyframes 102
Table3.4 Mean number of edges 102
Table3.5 Mean Absolute Trajectory Rotational Error 103 Table3.6 Coefficients assigned to the characteristics of the
se-quences using different linear models 109 Table3.7 Mean memory footprint of KN-SLAM 117 Table4.1 Framerates of simulation in3D-SIMOS 147
Table A.1 Characterization of the sequences with SVM weight < 0 162
Table A.2 Characterization of the sequences with SVM weight > 0 163
Table A.3 PTT in the KITTI dataset 164
Table A.4 PTT in the TUM RGB-D dataset 165 Table A.5 PTT in the EuRoC dataset 166 Table A.6 PTT in the ICL-NUIM dataset 166
Table A.7 ATE in the sequence of the KITTI dataset 167 Table A.8 ATE in the sequence of the TUM RGB-D dataset 168 Table A.9 ATE in the sequence of the EuRoC dataset 169 Table A.10 ATE in the sequence of the ICL-NUIM dataset 169
A C R O N Y M S
ADE Application Domain Extension (p.52)
AEC Architecture Engineering and Construction (pp.iv–vii, ix, 2, 3, 5–9, 48–50, 52, 54, 56, 118–121, 129, 131, 137, 139,141,143,145,148–150,152–155)
API Application Programming Interface (pp.vi,ix,53,137, 146,151)
AR Augmented Reality (pp.5,46,49,118,154)
ARM Advanced RISC Machine (p.5)
ASL Autonomous Systems Lab (p.87)
ATE Absolute Trajectory Error (pp.v,xiii–xv,31,88,89,91, 92,95,97,99–101,103,104,108,110,114,115,118,161,
167,168,167,169,167)
ATRE Absolute Trajectory Rotational Error (pp.xv,89,103)
BA Bundle Adjustment (pp.16, 17, 20, 21, 23, 32, 33, 36, 38–40,42,43,61,82,110,111,118)
BIM Building Information Modelling (pp.v,vi,ix,xiii,2,5– 10, 49, 48–50, 49–51, 50, 52–59, 119–121, 128, 129, 131,
132,148–150,152–156)
CAD Computed-Aided Design (pp.v, vi, ix, 8, 50, 52, 119, 120,128,129,131–133,138,139,141,148–150,153,155)
CAGR Compound Annual Growth Rate (p.3)
CAM Computer-Aided Manufacturing (p.49)
CDF Cumulative Distribution Function (p.67)
CityGML City Geography Markup Language (pp.51,52,58,121, 138)
CMOS Complementary Metal–Oxide–Semiconductor (pp.5, 21)
CNN Convolutional Neural Network (pp.29–31)
COLLADA COLLAborative Design Activity (pp.vi, ix, xiv, 53, 128–130,132,133,136,137,149,150,153)
CPU Central Processing Unit (pp.4,5, 19, 25,28,46–48,97, 117,141)
CRF Camera Response Function (pp.30,79)
CRS Coordinate Reference System (p.51)
CRUD Create, Read, Update and Delete (pp.136,137)
a c r o n y m s xvii
CSS Cascading Style Sheets (p.137)
DLT Direct Linear Transform (p.34)
DoF Degrees of Freedom (pp.18,25,36,41,43,77,89)
DOM Document Object Model (p.137)
EKF Extended Kalman Filter (p.28)
EuRoC European Robotics Challenges (pp.xiv,xv, 74, 77,78, 81, 84, 85, 87, 91, 93, 95, 100, 102, 101–103, 112, 164,
167)
FAST Features from Accelerated Segment Test (pp.28,36)
FOV Field of View (pp.5,24,78,82)
FPS Frames Per Second (pp.6,25,28,30,48,74,76,78,141, 142,146,149,151)
GCC GNU Compiler Collection (p.93)
GIS Geographic Information System (pp.51,52,58,121)
GLSL OpenGL Shading Language (p.151)
glTF GL Transmission Format (p.53)
GPS Global Positioning System (pp.18,19,75)
GPU Graphics Processing Unit (pp.ix, 24, 25,29,30, 46,47, 53,146,151)
GUI Graphical User Interface (pp.xv, 33,61,116, 131, 135– 137,140,142,150,151)
HTML Hypertext Markup Language (pp.137,146)
ICL-NUIM Imperial College London and National University of
Ireland Maynooth (pp.xiv,xv,74,78,79,81,84,87,92, 93,95,97,100–103,114,164,167)
IDF Inverse Document Frequency (p.62)
IFC Industry Foundation Classes (pp.vi,ix,xiv,49,52,120, 121,128–130,138,139,145,148–150,152–154)
IMU Inertial Measurement Unit (pp.19,20,77,78,81,95)
iSAM Incremental Smoothing and Mapping (p.25)
JSON JavaScript Object Notation (pp.136,137)
JVM Java Virtual Machine (p.137)
KITTI KITTI Vision Benchmark Suite (pp.xiv, xv, 76, 86,97, 99,101–103,164,167)
KMS Knowledge Management Systems (pp.5,154)
KNN K-Nearest Neighbors (pp.44,45,60)
LASSO Least Absolute Shrinkage and Selection Operator
(p.107)
LIDAR Light Detection and Ranging (p.75)
LM Levenberg-Marquardt (pp.13,16,42,73)
LoD Level of Detail (pp.122,157)
a c r o n y m s xviii
MAP Maximum A Posteriori probability (p.30)
MAV Micro Aerial Vehicle (pp.28,74,77,78,81,85,95)
MLE Maximum Likelihood Estimation (p.11)
MLP Multilayer Perceptron (p.109)
MPP Microsoft Project Plan (pp.vi,ix,xiv,128–130,132,133, 136,149,150,153)
MST Minimum Spanning Tree (p.122)
MVC Model-View-Controller (p.135)
MVD Maximum Vertex Degree (pp.67,68)
MVS Multiple View Stereo (pp.2,6,19)
NID Normalized Information Distance (p.25)
NLLS Non Linear Least Squares (pp.16,102)
ODIN Indegree Number (p.45)
OpenGL Open Graphics Library (pp.25,116)
ORB Oriented FAST and Rotated BRIEF (pp.iv,v,viii,xiv,
8,17, 25,27,28, 31–37,42, 43,60–66, 68,71,73, 79,80,
84,85,88,92,94,95,97,99–104,108,110–117,153,154,
159,161,164,167)
OS Operating System (p.93)
PBR Physically Based Rendering (pp.53,145,152)
PL Piecewise Linear (pp.46, 55, 58, 69–71, 121, 123, 126, 127,152,160)
PNG Portable Network Graphics (pp.75,86)
PnP Perspective-n-Point (pp.43,83,95,100,112)
PS Piecewise Smooth (pp.121,126)
PTAM Parallel Tracking and Mapping (pp.27,36)
PTT Percentage of Tracked Trajectory (pp.xiii, xv, 88, 92, 94,95,101,114,115,164,165,164,166,164)
RAM Random Access Memory (pp.93,141)
RANSAC Random Sample Consensus (pp.viii,34,41,43,48,61, 72,92,112)
REST REpresentational State Transfer (pp.135,136)
RFE Recursive Feature Elimination (p.107)
RGB-D RGB and Depth (pp.vii,1, 6, 25, 26, 29, 46, 47,60,78, 86)
RMSE Root Mean Squared Error (pp.88,89,91,167)
ROS Robot Operating System (p.93)
SCAD Smoothly Clipped Absolute Deviation (p.107)
SfM Structure from Motion (pp.2,6,16,19,31)
SIFT Scale-Invariant Feature Transform (pp.27,29)
a c r o n y m s xix
SLAM Simultaneous Localization and Mapping (pp.iv,v,vii– ix,xi,xii,xiv,xv,2–9,16–21,23–32,34–37,42,43,45,46, 59–66, 68, 71, 73–89, 91–95, 97, 99–102, 101–103, 102–
104,108,110–118,152–154,156,159,161,164,167)
SLERP Spherical Linear intERPolation (pp.54,55,138,145)
SNR Signal-to-Noise Ratio (pp.21,24)
SSE Streaming Simple Instruction Multiple Data (SIMD)
Extensions (p.93)
SVD Singular Value Decomposition (p.36)
SVM Support Vector Machine (pp.v, viii, xiv, xv, 85, 105– 109,113,114,161)
SVO Semi-direct Visual Odometry (p.28)
TF Term Frequency (p.62)
TFIDF Term Frequency - Inverse Document Frequency (p.62)
ToF Time of Flight (pp.1,30,86)
TUM RGB-D Technical University of Munich RGB-D (pp.xiv,xv,30, 34, 37, 39, 44, 74,76–78, 81, 86,87, 92–94, 97,99, 101–
103,110,113,164,167)
TV Total Variation (pp.30,47)
UAV Unmanned Aerial Vehicle (p.18)
UML Unified Modeling Language (pp.52,134)
VO Visual Odometry (pp.2,19,20,27,28,31,36,47,74–77, 79,81,82,154)
VR Virtual Reality (pp.46,49,118,154)
1
I N T R O D U C T I O N
Information Systems have greatly evolved since the beginning of Computa-tion. Computer Science is relatively young when it is compared to other dis-ciplines, such as Mathematics and Physics. Nevertheless, nowadays most of the business models of innovative companies are powered by some kind of underlying technology and computation model. Moreover, the biggest com-panies in the world are technology-related (e. g., Apple, Google, Amazon or Microsoft). These companies also invest a huge amount of resources in re-search and development activities that contribute to the improvement of the computation systems they use in their business.
The advances introduced in computing systems have motivated the devel-opment of new applications that were unimaginable before. The more com-puting power, the higher the application requirements to understand, model and solve complex problems. This power improvement allows us to tackle new problems. Most of them have been introduced by the broad variety of devices able to perceive or “sense” the environment, commonly known as sensors.
The information captured by these sensors is powering a lot of new applica-tions to multimedia and digitalization. Modeling, reality understanding and interaction are involved in both areas. These applications are of interest for di-verse sectors, such as entertainment, architecture, civil engineering, medicine or tourism, e.g.. The huge amount of information provided by sensors has led to the emerging of new disciplines like big data or deep learning.
Digital cameras are among these sensors since they capture the light emit-ted or reflecemit-ted by the objects in the scene. A matrix of pixels represents this information with functions defined on pixels whose number depends on the resolution of the camera. Since a camera only receives information about the environment without emitting any signal, they are considered passive sensors. Laser scanners and Time of Flight (ToF) cameras are examples of active sen-sors that transmit and receive a light signal to measure distances according to the time the signal takes to return to the device.
In this work, we have focused on digital cameras understood from a Com-puter Vision approach. We have dived into the process of capturing and mod-eling the environment using fundamental concepts of photogrammetry. This technique estimates the depth of a 3Dpoint based on its corresponding pro-jections on multiple images. The distance between two propro-jections is called parallax. Images can be captured by multiple cameras or by placing a single camera at different locations at different times. In this way, it is plausible to estimate the depth of one point in a scene from a single camera if this camera travels around the scene. The recovering of the third dimension of this point is the key for3Dreconstruction. Furthermore, each camera can contain one or more lenses (e. g., binocular cameras or RGB-D cameras). Hence, the selected approach to tackle the problem must always consider the type of camera and the sensors it includes.
i n t r o d u c t i o n 2
The3Dreconstruction problem has been tackled from different approaches. They have evolved along the last 30 years from the very basic perspective
2.5D models to the real-time dense 3D reconstructions that we can achieve nowadays. However, most of them are based on specific sensors, which are usually expensive or only affordable for custom-tailored applications. In other cases, the algorithms require a powerful parallel computer architecture to run properly in real-time. Obviously, these requirements depend on the desired degree of accuracy and completeness for the reconstruction, or on that the desired artifact is a pure cloud or a triangulated mesh.
While the state of the art has advanced in high-performance high-quality reconstruction (e. g., Multiple View Stereo (MVS) and Structure from Motion (SfM) in COLMAP [112]), new low-cost hardware setups have appeared in the recent years associated with mobility and the Internet of Things. These new setups do not provide the same computing power as their traditional alternatives but they are still able to reconstruct scenes with enough level of detail to serve for several different purposes and applications. Algorithms and systems have evolved to support these new computing architectures.
The Robotics community is accustomed to operating in hardware environ-ments with limited resources. There are two approaches coming from this community that can be applied to a low-cost reconstruction system. One of them is Visual Odometry (VO), which is the process of determining the po-sition and orientation of a robot in a local environment by analyzing the im-ages captured by the camera. The other concept is Simultaneous Localization and Mapping (SLAM). SLAM consists in the concurrent construction of a model of the scene (the map) in a global environment at the same time that the camera pose is estimated. Both concepts are related since SLAM can be understood as an improvement over VO or VO can be understood as part of SLAM (more details in Section 2.3.1). The Robotics and Computer Vision communities have made astonishing progress over the last 30 years in both
areas, enabling large-scale real-world applications and witnessing a steady transition of this technology to industry.
Our aim is to contribute to the widespread adoption of3Dreconstruction, i. e., to put 3D digitalization within reach of any user with low-cost com-modity cameras such as webcams or smartphones. To achieve this goal, our research is focused on the investigation of affordable SLAM algorithms to generate3Dinformation in devices with limited resources. This research has been addressed without a specific application in mind inChapter3. Later,3D models can be incorporated in applications particularly tailored for a particu-lar purpose, e. g., the building industry or, more generally, the AEC industry.
The building industry is progressively transitioning from the traditional manufacturing processes to more industrialized processes aided by technol-ogy. An important piece of this technology is the Building Information Mod-elling (BIM). Actually, BIM proposes a completely different methodology to integrate all the information about the building in a single framework. Every agent linked to the building in one of its stages across its lifespan produces and consumes this information.
1.1 t h e r e s e a r c h f r a m e w o r k 3
is the complexity of the model. The other problem concerns the cumbersome task of annotating geometry with semantics like the construction phases of a building. The second part of our research is committed to addressing both issues. Once the model is properly tagged, enriched applications can use the information to provide valuable insights. One of these insights is the moni-toring of the construction progress that will let the manager detect offsets in time and space. The model also enables a simulation of the evolution in con-struction processes. The elements of the building affected by the concon-struction activities can be inspected individually by the user. This application of 3D reconstruction to these tasks will be studied inChapter4.
The research in these fields is motivated by the growing interest in the worldwide industry for this kind of technologies. There are two powerful applications to hold this demand steady in the long-term: the necessity of in-telligent computing systems able to understand what they are doing, and the digitalization of the environment. They have motivated an equally important growth in the research of new algorithms and technologies for 3D digital-ization, autonomous navigation, and augmented/virtual reality. In fact, the development of three-dimensional applications for the industry has grown exponentially in the last decade and this pace is expected to continue. The average Compound Annual Growth Rate (CAGR) estimated for the next five years is currently around20%.
The remainder of this chapter is devoted to framing our work in a specific niche inside a wider field of research. It is structured as follows: Section1.1 proposes the general framework to place the reader in the context of this research and highlights our contributions;Section1.2includes the main goals pursued with our contributions.
1.1 t h e r e s e a r c h f r a m e w o r k
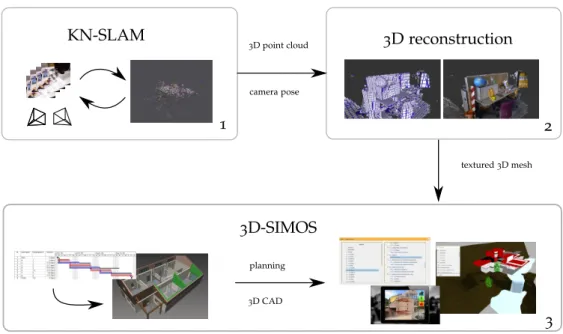
This section is intended to supply the reader a broader view of the framework in which our research can be described. The conceptual pipeline of this frame-work is depicted in Figure 1.1. In this pipeline we have distinguished three main components, with our contributions focused on the components one and three. On the one hand, the components in the upper half of Figure1.1 are application-agnostic, i. e., they can be applied to different purposes in mul-tiple contexts. On the other hand, the component in the lower half is entirely devoted to solving problems for the AEC industry.
The pipeline begins with a sequence of pictures captured by a simple, low-cost camera. These pictures can be analyzed and processed to provide the location of the observer and a map of the scene. This problem is tackled by a general-purpose SLAM system that we call KN-SLAM. The resulting sparse map can be converted into a textured3Dmesh by a3Dreconstruction algorithm, represented as the second component of the pipeline. The textured 3Dmesh can be of use in several settings and applications. In particular, we aim at a solution for construction managers in the AEC industry that we call 3D-SIMOS. This solution is represented by the third component of the
1.1 t h e r e s e a r c h f r a m e w o r k 4
KN-SLAM
1
3D reconstruction
3D-SIMOS
planning
3D CAD
2
3
camera pose 3D point cloud
textured3D mesh
Figure 1.1: The three components of the framework of our research. Our
contri-butions are focused on the component one (KN-SLAM) and three (3
D-SIMOS).
In the first component, we aim at advancing in the state of the art of low-cost, accurate SLAM. Three-dimensional reconstruction and digitalization is a fast growing industry with many applications. However, there are significant barriers that limit a wide adoption. One of the biggest challenges is to reduce these barriers, allowing SLAM to run to its best in devices with a limited amount of resources. This research has been addressed from a basic point of view in Chapter 3, i. e., without considering the particular interest of any industry.
It is also important to note that besides the ground truth of the sequences, our research must also be compared with the up-to-date state of the art. Thus, we shall start by defining the operating conditions of our system in a quantita-tive and closed way that allows us to choose the best approaches to compare KN-SLAM.
Despite most SLAM approaches share the same theoretical background, they exhibit subtle differences depending on the operating conditions. These conditions include the number of cameras, the type of lens, the shutter of the camera, the Central Processing Unit (CPU) architecture or even the com-piler. Recording conditions of the sequence are also considered since they affect the accuracy and performance of SLAM. For instance, short sequences with strong camera rotations have different requirements than long sequences where the camera describes a straight trajectory. The kind and the number of lenses are the most significant conditions to pick a specific SLAM strategy. The presence of additional sensors would also require modifications in the algorithms. By taking this into account, we shall constrain ourselves to the following operating conditions:
1.1 t h e r e s e a r c h f r a m e w o r k 5
• Color information provided by the sensor should be included in the points of the map.
• The Field of View (FOV) of the lens is between 60°-70°, i. e., we do not consider fish-eye lenses.
• The sensor area is below5 mm2.
• The sensor uses Complementary Metal–Oxide–Semiconductor (CMOS) technology.
• The camera may be equipped with a rolling shutter device, although global shutter is also supported.
• The system exploits parallelism up to CPU level, taking advantage of state-of-the-art CPU architectures with multiple core and SIMD instruc-tions available both in Advanced RISC Machine (ARM) and x86
archi-tectures.
• The sequences are sufficiently large to have a significant impact on the drift along the trajectory.
The goal of KN-SLAM is to accurately track the camera pose while a sparse 3Dmap is being reconstructed in the background. The3Dmap is represented by a sparse point cloud, normally not suitable for applications that require textured 3Dmeshes. However, these meshes can be generated by the 3D re-construction component from the output of KN-SLAM, which comprised the poses of the keyframes and a sparse point cloud. The task is usually executed off-line to take advantage of the optimization procedures in the estimated tra-jectory. In this way, the accuracy of the camera poses and the map points is maximized, as in e. g., [89]. Resulting models are composed of a mesh and a texture, which feed3D-SIMOS. State-of-the-art approaches for implementing
this component are reviewed inSection2.6.
Once the3Dinformation has been properly captured and modeled, it can be used in very different contexts. The third component, called3D-SIMOS, has
been designed with this goal in mind. Instead of dealing with a broad range of situations, it exploits our expert knowledge in a particular field where our research group has made numerous contributions over the last years: AEC. We have provided constructors with solutions based on a mix of Computer Vision, Computer Graphics and Knowledge Management Systems (KMS) in-spired by the BIM methodology. Our contributions regarding this BIM-based tool are introduced inChapter4.
In this context,3D-SIMOS links3Dmodels to the planning of the
construc-tion so it can be interpreted as a4Dmodel. Three-dimensional building mod-els are organized in several layers, with multiple meshes per layer. These meshes are linked to stages of the planning, following a BIM-like methodol-ogy. This association allows the user to trace the advances in the planning of the building project along its construction. Furthermore, the meshes of the model can be compared to the meshes provided by the second compo-nent. This comparison between the 3D capture and the expected 4D mesh
1.1 t h e r e s e a r c h f r a m e w o r k 6
is located and the mesh is reconstructed using KN-SLAM, to let 3D-SIMOS
integrate this information with the scheduled state of the construction. The visualization can be implemented in an application that allows the user to inspect the building interactively. Moreover, the associations between meshes and stages can be exploited for simulating the evolution of the con-struction process. The designed and captured models are useful to estimate deviations in the execution of the project. What is more, this information is available for accurate reporting about the performance of the construction process after it finishes. This also enables the monitoring of the construction processes.
Stakeholders involved in the AEC industry have outlined a collection of demands in the BIM methodology. We have verified such demands in our interviews with involved enterprises that are interested in 3D-SIMOS. The
following requirements have been addressed by3D-SIMOS:
• The geometric information of the building is associated with semantic information concerning the planning.
• The information must be modeled following a BIM methodology.
• The planning is provided by a.mlp file. A specific thesaurus limits the
different stages and activities available for the planning. The models are imported using the COLLADA format where the system recognizes layers, geometric groups, and objects.
• Associations between geometries and stages of the planning are per-formed interactively.
• The building can be visualized and inspected in a three-dimensional viewport.
• The stages of the construction can be selected and enabled. Changes in their state are synchronized bidirectionally with the geometry.
• The navigation controls allow the user to translate, rotate and scale the model.
• The evolution of the construction process can be simulated with a pro-gressive display of the geometries associated with the construction stages.
• The tool must be accessible as a web application from any device, any-time, any place.
1.2 o b j e c t i v e s 7
operate in real-time. Although some approaches can even work with differ-ent types of lenses in the camera (monocular, stereo and RGB-D), we have decided to stay focused only on low-cost alternatives using only monocular cameras with poor lens specifications. It has been the specific combination of requirements what has led to the choice of monocular visual SLAM.
There are more suitable approaches if we focus only on achieving a high-quality reconstruction especially-suited for BIM. However, we decide to put our efforts on a small niche within the huge field of research on three-dimensional reconstruction. This field is still growing fast due to the increasing indus-trial demand of these solutions, and nowadays many enterprises offer a wide range of devices and methods to generate accurate and low-cost 3Dmodels. Then, we think that our results can be of use in different application domains like BIM, where spatial information captured with other strategies can be also integrated to enhance the resulting system.
1.2 o b j e c t i v e s
With respect to the reconstruction of the scene, we develop in this work a monocular SLAM implementation that supports the requirements stated above. In particular, we aim at reaching good levels of accuracy and robust-ness that can improve today’s systems. Our closest neighbor concerning sparse indirect SLAM approaches, as we will see in the literature review in Sec-tion2.3, is the one designed by Mur-Artal, Montiel, and Tardos [88]. Therefore, we will establish our goals by taking this system as a reference and describe our challenges with respect to its performance. Our goals are multiple, rang-ing from the bootstrapprang-ing of the system to the map reconstruction. More concretely, the following goals are pursued:
• Reduce the booting times of the system.
• Increase the number of tracked frames of the trajectory.
• Bootstrap the system as soon as possible.
• Develop a smarter adaptive strategy for visual loop detection in the set of candidate keyframes.
• Reduce the trajectory error in sequences recorded in natural conditions, i. e., those sequences recorded naturally by a hand-held camera.
• Deal with more diversity of scenes including, but not only, structured scenes where the material of the object uses a high-frequency texture.
• Achieve a colored sparse three-dimensional map when possible, i. e., when the input images are not represented in grey scale.
• Lower the computing requirements and the memory footprint of the system.
In 3D-SIMOS, we aim at implementing these requirements with the
1.3 o u t l i n e 8
From our collaboration with the stakeholders in the AEC industry, they have recognized an excessive level of sophistication in BIM to accomplish even the most simple tasks. This is one of the main barriers for the adoption of BIM. From now on, our main goal is to provide a simple solution that demonstrates the benefits of BIM. More specifically, the solution should focus on planning and monitoring the advances in the construction of the building. In addition,
3D-SIMOS must be able to:
• Enrich a CAD model with semantic information.
• Simplify the creation of the BIM model from conventional information sources, i. e., from file formats used by the AEC industry in the last decade.
• Develop a light-weight application, able to operate on different web browsers and platforms (both mobile and desktop computation envi-ronment).
• The simulation process must run smoothly in desktop platforms and run at least in mobile environments.
• Render appealing three-dimensional models, visually enhanced by tex-tures linked to the materials of the meshes.
• Support different types of building models, such as heritage, residential, offices, and industrial facilities.
1.3 o u t l i n e
This document has been organized into five chapters. Current chapter has been devoted to introducing the motivation and scope of our research. We have described the overall framework in which our contributions can be ar-ranged. It involves the three principal concepts to understand the rest of the document: Simultaneous Localization and Mapping, 3D reconstruction and Building Information Modelling.
We have included the background and state of the art inChapter 2. This chapter describes the mathematical concepts and models behind the areas introduced in Chapter 1. There exist several approaches to SLAM and 3D reconstruction; they are reviewed in this chapter by including specific alter-natives in the literature too. A special section is devoted to explaining the SLAM pipeline implemented by ORB-SLAM, our inspiration and reference implementation for this work. The last section describes advanced visualiza-tion and BIM in the context of the AEC industry.
1.3 o u t l i n e 9
of each sequence. The conclusions are summarized in theSection3.4, followed by a review of the compliance with our initial goals.
InChapter4, we detail the contributions proposed to foster the adoption of the BIM methodology in the AEC industry, including a thorough description of 3D-SIMOS in Section4.1. Our proposal for a common framework toward dynamic BIM is included here too. The experimental methodology is based on the experimental evaluation of several aspects by means of interviews to ex-perts and direct observation. They are defined inSection4.2. Results achieved for the evaluated aspects are analyzed inSection3.3, and finally, conclusions are highlighted inSection4.4.
2
B A C K G R O U N D
Our research has been developed in a field that combines concepts from Robotics, Computer Vision, and Computer Graphics. Most of the mathemati-cal background originates from Algebraic Geometry, as a natural extension of the Projective Geometry, and the Lie Group theory, which provides the struc-tural link between static aspects (relative to the scene) and kinematic aspects (relative to the motion). The bible to understand the geometrical principles is Multiple View Geometry [53]. The other important reference to understand the second part of our research in regard to applications to structures urban environments is [32]. This book introduces a practical approach to BIM from the perspective of different stakeholders.
Most of the concepts are included in this chapter to allow the reader to un-derstand the rest of the contents of this thesis. However, we make reference to the original publication due to space limitations. We will refer to the concepts and notation introduced in this section when appropriate.
2.1 n o tat i o n
This section defines the notation that will be used throughout the rest of the document. Variables highlighted in bold represent multidimensional arrays whereas non-bold variables are scalars in the field of the real numbersR. Fig-ure2.1illustrates the concepts represented by each variable over an example trajectory of just three keyframes.
The image of the frame received at timekis denoted withIk :Ω⊂R2 7→R, where Ω is the image domain and I(u) is the light intensity perceived by the camera sensor at pixel coordinates uk = (u,v)T ∈ Ω. Each 3D point
pk = [x,y,z]T ∈ S of the visible scene surface S ⊂ R3 maps to the image coordinatesukthrough the camera projection model (e. g., the pinhole model) π:R3 7→R2:
uk :=π(pk), (2.1)
where k denotes the frame in which the coordinates ofp are represented.
The projection function π is determined by the intrinsic camera parameters obtained from calibration. In the common pinhole camera projection model these parameters are the focal length f = [fu,fv]T and the principal point
c= [cu,cv]T, so that the functionπcan be expressed as a linear system
" u
v #
:= "
fxxk/zk+cu fyyk/zk+cv
#
(2.2)
2.2 o p t i m i z at i o n f r a m e w o r k 11
The 3D point p ∈ R3 corresponding to an image coordinate u can be re-covered, given the inverse projection functionπ−1 :R2 7→ R3 and the depth du ∈R:
p=π−1(u,du) , (2.3)
whereR⊂Ωis the domain for which the depth is known.
The camera pose (position and orientation) at the frame k is represented by the rigid-body transformation Tk,w ∈ SE(3), where SE(3) is the Special Euclidean Lie group. This group is the semidirect productSO(3)nR3 of the Special Orthogonal group SO(3) and Translations group R3. It maps a 3D pointpwin world coordinates into the coordinates of framek:
pk=Tk,w·pw, (2.4)
where the application ofTk,w can be viewed as a composition of a rotation and a translation as
pk=Rk,wpw+tk,w. (2.5)
The relative transformation between two consecutive frames at timesk−1 andkis computed as
Tk,k−1 =Tk,w·Tk−−11,w (2.6)
where Tk−−11,w = Tw,k−1. A minimal parametrization for T consist of a
vector ξ = (ω,υ)T ∈ R6, ω,υ ∈ R3, which is isomorphic with the Lie
algebra se(3) representing the tangent space to SE(3) at the identity. Each element of the algebra ξcan be mapped to the corresponding element of the
groupSE(3)by the exponential map [83]:
T :=exp(ξ) (2.7)
In a similar way, the inverse operation is locally represented byξ =log(T), which allows to move from the group to the algebra.
Each map point p ∈ S is observed from a subset of keyframes Ki ∈ K where πk , k ∈ Ki projects p inside the image boundaries. For the sake of simplicity we will denote the transformation matrixTk,w asTk and the map points pi,w as pi, which are always represented in world coordinates w. r. t. the first keyframe of the scene.
2.2 o p t i m i z at i o n f r a m e w o r k
The core of the optimization problem is to compute an estimator X∗ based
2.2 o p t i m i z at i o n f r a m e w o r k 12
Ik−1
p1
p2
p3
u1,k
u1,k−1
u2,k−1
u3,k−1
Tk,k−1
Ik+1
Tk+1,k
u3,k+1
u2,k+1
u1,k+1
u3,k
u2,k Ik Ck−1
Ck
Ck+1
Figure 2.1: Notation represented over a classical keyframe-based trajectory. For
clar-ity the trajectory only include three keyframes and three map points but it is easy to generalize the example forNkeyframes andMmap points.
measurements Y to unveil the hidden model parameters X (i. e., the map
points and the camera poses). From an abstract point of view, the Maximum Likelihood Estimation (MLE) maximizes the probability of obtaining the ac-tual measurementsY, i. e.,
X∗ =arg max X
P(Y|X).
The optimization procedure to compute the estimator depends on the prob-ability distribution of the measurements. This section aims at providing the fundamentals of algorithms for optimizing jointly the points and the poses of the system. A non-linear optimization framework is used over the elements of the Lie algebra of the group of rigid body transformations (SE(3)). This framework can also be extended to other groups likeSim(3)to optimize the pose graph. Next, the procedure for estimating the Jacobian of the camera motion using the classic interaction matrix in Robotics is explained.
2.2.1 Least squares and Gauss-Newton optimization
2.2 o p t i m i z at i o n f r a m e w o r k 13
The Gauss-Newton method, an approximation of the Newton method, is commonly used for non-linear least squares minimization. It iteratively up-dates an initial estimate of the parameter vectorpby the rule
p(i+1)=p(i)+δ. (2.8)
The update vectorδis solved at each step by the normal equation
(JpTΛfJp)δ= −JpTΛfr (2.9)
where Jp = ∂rp is the Jacobian of the residual error r = f−fˆ(p) of the estimated parameters p of the model, and Λf =
P−1
f is the information
ma-trixor the inverse of themeasurement covariance matrix Pf for the likelihood
distribution.
Gauss-Newton optimization approaches to the minimum at a quadratic rate of convergence, but gradient descent behaves much better far from the min-imum with a higher convergence speed. This behavior is taken into account by the Levenberg-Marquardt (LM) algorithm, in which the normal equation is altered as
(JpTΛfJp+λI)δ= −JpTΛfr (2.10)
whereλ is a non-negative damping parameter updated at each iterationi that rotates the update vectorΛtowards the direction of the steepest descent.
Hence, LM behaves as Gauss-Newton if λ → 0, whereas it behaves as a gra-dient descent when λ → inf. LM only updatesp(i+1) if the residual error is
significantly reduced. In such caseλis decreased as the estimation pis close
to the solution; otherwise λ is increased to perform a gradient descent step since the estimation is still far from the minimum.
In Gaussian optimization frameworks, it is convenient to model feature coordinates with the inverse depth (u,v,ρ)T. This feature maps to the Eu-clidean point x = 1ρ(u,v,1)T. Inverse depth allows the system to deal with uncertainty over a broad range of depths even for far-away points with little parallax during camera motion. It also enables efficient and accurate represen-tation of depth during bootstrapping, where the equations have a high degree of linearity (see [18]).
2.2.2 Optimizing Rigid Body Transformations
2.2 o p t i m i z at i o n f r a m e w o r k 14
confidence. In addition, it is feasible to swap between the representation of an element in the algebra and the group. We choose the most convenient rep-resentation according to the requirements of the problem we are addressing.
Lie Representation
The optimization of transformation matrices can be simplified if they are parametrized such that singularities are avoided. The group of rotations itself poses issues in angle interpolation since it is only locally Euclidean. How-ever, transformations modelled using a Lie group/algebra avoid this problem and preserve the quadratic convergence rate of the Newton optimization. A transformation matrixT ∈Rn is expressed as an(n+1)×(n+1)matrix:
T = "
R t
1 #
, R∈SO(n), t∈Rn, (2.11)
beingSO(n) the Special Orthogonal Lie group, which is interpreted as the group of rotation matrices if n = 2 or n = 3. Rigid body transformations given by “rotations” and translations form a smooth manifold too, and there-fore a Lie group — the Special Euclidean groupSE(n). Its corresponding Lie algebrase(n)- the tangent space ofSE(n)at the identity - provides a minimal representation of a rigid body transformation.
The algebra elements inR3are(ω,υ)∈R6, whereω∈R3 is the axis-angle representation of rotations, andυ ∈R3is the rotated translation vectort. The elements of the algebra se(3) are converted into elements of the groupSE(3) using the application of the exponential map
expSE(3)(ω,υ) = "
expSO(3)(ω) Vυ
1 # = " R t 1 #
(2.12)
where theexpSO(3) can be computed using the Rodrigues formula [20] as
expSO(3)(ω) =I+ sin(θ)
θ (ω)×+
1−cos(θ) θ2 (ω)
2
× (2.13)
and the translation vectorVυ as
Vυ=I+
1−cos(θ)
θ2 (ω)×+
θ−sin(θ) θ3 (ω)
2
× (2.14)
being θ = ||ω||2 and (v)× the application that maps a vector to its
skew-symmetric matrix, which is defined as
(v)×=
0 −z y
z 0 −x
−y x 0
2.2 o p t i m i z at i o n f r a m e w o r k 15
Finally, the optimization will be performed in the vector space isomorphic to the tangent spaceg = TeG, where the incremental updateξlives. Then, it is converted back into a manifolds ofSE(3)following Equation2.8.
The Jacobian of a rigid transformation can be expressed using a row decom-position of the rotation matrixR:= [r1,r2,r3]T
∂T
∂ξ =
expSE(3)(ξ)T
∂ξ
ξ=0 =
−(r1)× 3×3 −(r2)× 3×3 −(r3)× 3×3 −(t)× I3×3
(2.16)
Jacobian Estimation
The kinematic differential relation between the motion of a point in the scene
p = [x,y,z]T and its projection u = [u,v]T on the image plane, where u := π(p)according to the definition ofπprovided inSection2.1, can be modelled by the Jacobian of the perspective projection matrix as
" ˙ u ˙ v # = " fu
z 0 −
u z 0 fv
z − v z # ˙ x ˙ y ˙ z
=J1(u,v) ˙ x ˙ y ˙ z
(2.17)
Indeed, the velocity of the fixed scene point p is a composition of the
ro-tational and translational movements of the camera, which are defined by its angular velocityω∈R3 and its linear velocityυ∈R3
˙ x ˙ y ˙ z = −υ−ω× x y z
(2.18)
which can be compactly expressed in matrix form using the skew-symmetric form of the[x,y,z]T vector as
˙ x ˙ y ˙ z =
0 −z y −1 0 0
z 0 −x 0 −1 0
−y x 0 0 0 −1
" ω υ #
=J2(x,y,z) "
ω
υ
#
(2.19)
Both matrices can be combined in a single compact Jacobian matrix
" ˙ u ˙ v #
=J1J2 "
ω
υ
#
=Jp(u,v,z) "
ω
υ
#

![Figure 2.5: Example of dense planar reconstruction in large indoor environments with loops (extracted from [ 60 ]).](https://thumb-us.123doks.com/thumbv2/123dok_es/5511962.728858/45.892.244.679.91.513/figure-example-dense-planar-reconstruction-indoor-environments-extracted.webp)