THESIS WORK
Master of Science in Energy and Environment
Instituto Tecnológico de Buenos Aires - Karlsruhe Institute of Technology
GEOTHERMAL ENERGY IN
SANTIAGO DEL ESTERO, ARGENTINA:
A FEASIBILITY STUDY OF POWER GENERATION FROM
MEDIUM ENTHALPY THERMAL SOURCES
Zeno Farina
Environmental Engineer (ITBA)
Tutor
Lic. Alejandro Conde Serra (SEGEMAR)
Dr. Dietmar Kuhn (KIT/IKET)
Examiners
Prof. Geol. Silvia Barredo (ITBA)
Dra. Ing. Cecilia Smoglie (ITBA)
Table of Contents
Abstract ... 1
Resumen ... 2
Summary ... 3
Aims and objective ... 4
1 Introduction ... 5
1.1 Concepts of geothermal energy ... 5
1.2 Medium-enthalpy geothermal energy and “binary” systems ... 6
1.3 Analysis of working fluids in ORC power plants and choice of fluid... 8
1.3.1 Thermodynamic considerations ... 8
1.3.2 Environmental considerations ... 10
1.3.3 Legislative considerations – the Montreal Protocol ... 11
1.4 Power generation with medium-enthalpy geothermal energy: cases around the world ... 12
1.4.1 Chena, Alaska, USA ... 12
1.4.2 Simbach – Braunau, Germany ... 13
1.4.3 Denizli, Turkey ... 13
1.4.4 TAD’s Geothermal Plant, Nevada, USA... 13
1.4.5 Beppu, Japan ... 13
1.4.6 Matsunoyama, Japan ... 14
1.4.7 Lompio, Indonesia - study case ... 14
1.4.8 Winton, Australia ... 14
2 Study of low enthalpy power generation at Rio Hondo ... 15
2.1 Characterization of the local thermal water resource ... 15
3 Commercial evaluation ... 18
3.1 Selected companies ... 19
3.2 Scenario A: hot source at 75°C ... 21
3.2.1 Electratherm – POWER+Generator ... 21
3.3 Scenario B: hot source at 85°C ... 25
3.4.3 Zuccato – ULH and ULH+ ... 39
3.4.4 Review of the 95°C scenario working conditions ... 39
3.5 Cost of the considered products ... 40
4 Economic evaluation ... 41
4.1 The “RenovAr” Program: Argentina’s incentive scheme ... 42
4.2 Description of costs and incomes ... 43
4.3 Evaluated scenarios ... 45
4.4 Calculation of the Internal Rates of Return ... 46
4.5 Results ... 47
5 Conclusions ... 55
Appendix 1: operation and maintenance procedures... 57
Appendix 2: calculation of Internal Rates of Return ... 59
List of Figures
Figure 28: Enogia’s ENO-LT 100 kW possible working conditions as simulated by GeSi with hot source at 95°C
... 36
Figure 29: Running conditions of the 180 kW configuration of the ENO-LT product with 95°C inlet ... 37
Figure 30: Enogia’s ENO-LT 180 kW possible working conditions as simulated by GeSi with hot source at 95°C ... 38
Figure 31: Working conditions of the evaluated ORC systems at 95°C hot-source temperature ... 40
Figure 32: Electricity price for industries in European countries in the years 2014–2016 (Eurostat, 2017) .. 41
Figure 33: Investment costa s a function of installed capacity (Tocci et al., 2017) ... 42
Figure 34: Calculation of estimated CAPEX (USD) ... 50
Figure 35: Calculation of estimated OPEX (USD/year) ... 50
Figure 36: Estimated produced energy (kWh/year) ... 50
Figure 37: Working conditions of the evaluated ORC systems at 95°C hot-source temperature (Duplicate from Chapter 3.4.4) ... 50
Figure 38: Payback time of each ORC system for each scenario ... 51
Figure 39: Price of sold electricity of each ORC system for each scenario ... 51
Figure 40: Internal Rate of Return of each ORC system for each scenario ... 51
Figure 41: Irradiation in Termas de Río Hondo ... 53
Figure 42: Yearly wind conditions in Termas de Río Hondo ... 54
Figure 43: Standard operating conditions of a 50 kW nominal power wind turbine ... 54
List of Tables
Table 1: Most used refrigerant fluids in low temperature applications and some of their properties (Macchi and Astolfi, 2016) ... 11Table 2: Safety information levels of chemical elements ... 11
Table 3: Characteristics of the POWER+Generator by ElectraTherm ... 21
Table 4: Characteristics of the ENO-LT series by Enogia ... 27
Table 5: Running conditions of the 100 kW configuration of the ENO-LT product with 85°C inlet ... 28
Table 6: Running conditions of the 180 kW configuration of the ENO-LT product with 85°C inlet ... 30
Table 7: Running conditions of the 100 kW configuration of the ENO-LT product with 95°C inlet ... 35
Table 8: Running conditions of the 180 kW configuration of the ENO-LT product with 95°C inlet ... 37
Table 9: Characteristics of the ULH and ULH+ series by Zuccato ... 39
Table 10: Assumed prices of electricity according to various scenarios ... 44
Table 11: Calculation of estimated CAPEX (USD) ... 47
Table 12: Calculation of estimated OPEX (USD/year) ... 47
Table 13: Calculation of estimated energy production ... 48
Table 14: Scenario 1 – Self-consumption of the produced energy ... 48
Table 15: Scenario 2 – Energy produced is completely sold to the National Grid according to the RenovAr program ... 48
Table 16: Scenario 3 – The LCOE is calculated as a way to participate in the MATER program ... 49
Table 17: Scenario 4 – The price of the sold energy is calculated to guarantee a payback period of 4 years 49 Table 18: Comparison with a photovoltaic plant ... 53
Declaration of Authorship
I declare that I have developed and written the enclosed Master Thesis completely by myself and have not used sources or means without declaration in the text. Any thought from others or literal quotations are clearly marked. The Master Thesis was not used in the same or in a similar version to achieve an academic grading or is being published elsewhere.
Buenos Aires, 13th of August 2018
____________________________________
Abstract
The Organic Rankine Cycle technology is a reliable way to convert heat into electricity, especially when free heat is available in form of renewable energy (biomass, geothermal, solar) or as exhaust heat from industries. In the present study the attention has been paid on the application of an ORC unit for the production of electric energy in Termas de Río Hondo, north-west Argentina, making use of an existing medium-temperature geothermal source. Earlier explorations of this area have assured a hot source of about 80-90°C at 900 m of depth, thanks to a fractured saturated sedimentary basin of more than 6000 m of depth. Commercial and economic evaluations have been carried out to analyse the ORC units that are available in the market that can work with such low temperature. Three companies have been selected as potential providers of a unit to be installed in Termas de Río Hondo. The potential energy production from these units is calculated and various economic scenarios are evaluated to function as a reference to potential strategic decisions. The units’ gross power output ranges from 30 to 300 kWe, with a required hot water flow rate between 10 and 57 l/s, and a cold water flow rate between 15 and 155 l/s. The economic analysis is based on the calculation of their payback period, sale price of produced energy and Internal Rate of Return. In general, it is found that larger units are more profitable, in the face of their higher initial cost.
Resumen
Summary
The present study focuses on the use of medium-temperature geothermal sources, available in Río Hondo, Province of Santiago del Estero, north-west Argentina, to operate an Organic Rankine Cycle (ORC) plant to provide energy for residential uses. In the period 1920-1950, the Argentine Geological Survey (SEGEMAR) investigated the area by boring exploration wells up to 910 m deep. At this depth they obtained outflow water at 80°C with a flow rate of about 27 l/s. Later geothermal explorations allowed the estimation of a fractured saturated sedimentary basin, at a depth of more than 6000 m, which most probably hosts an important hydrothermal reservoir of which just a surface outcropping spot is known. Since the source temperature strongly varies with the extraction depth, three scenarios have been studied, for sources at respectively 75, 85 and 95°C. The necessary water for the ORC cooling system is also available at the place of interest.
ORC systems designed on a tailor-made basis are optimal but of high cost. Therefore, a commercial investigation was carried out to look for commercially available standard ORC units around the world. Three companies have been selected as possible providers: ElectraTherm from the USA, Enogia from France and Zuccato from Italy. Other companies have not shown interest in this project or have chosen different strategies. ElectraTherm is the only company with products suitable to exploit sources at 77°C or more, while Enogia and Zuccato require a minimum of 85°C and 95°C, respectively. The products and prices of these companies and all other associated costs were considered to calculate the ORC plant economic feasibility.
Aims and objective
The integration of available energy resources and energy conversion methods favours the development of research activities in various fields. Geothermal sources are found in Las Termas de Río Hondo, one of the most visited balneotherapy destinations of Argentina. Some hot springs with temperatures over 30°C have made the town a popular spa resort for argentines. It is estimated that water at 75 - 95°C can be accessed through the realisation of wells. The town, with 44000 inhabitants, is located on the banks of the river Dulce, near an artificial lake called Río Hondo, which could provide abundant cold water for the refrigeration system of any ORC plant. The ORC is a binary cycle, with a primary circuit for the working fluid operating a turbine and a secondary circuit for the geothermal water as heat source. There are several possible working fluids, but just a few are suitable to work at low temperatures and are environmental friendly as required by recent legislative actions around the world.
With this in mind, the objective of this Thesis work is to analyse the technical and economic feasibility of installing an ORC plant in Las Termas del Rio Hondo, with geothermal water at 75-95°C as hot source and the river or lake water at 15-25°C as cold source. In each case, the analysis includes the calculus of the required flow-rates from the heat and the cold sources. Different commercially available plants are studied, by carrying out a technical analysis and a commercial/economic evaluation. The technical analysis considers ORC systems offered in the market, way of functioning, advantages and disadvantages. It is worth to mark that ORC plants tailored-made depend on many local conditions, therefore it would be unrealistic to say that there are two exactly equal projects around the world. Companies provide some standard installations that are then customized according to the needs of clients and site. Because of the significant price difference between fully tailored and standard projects, this study only consider standard solutions.
1
Introduction
1.1
Concepts of geothermal energy
Geothermal energy is the energy contained as heat inside the Earth’s interior. The origin of this heat is linked with the internal structure of our planet and its physic-chemical processes. Mainly, this heat derives from the continuous decay of radionuclides, chiefly isotopes of uranium (238U and 235U), potassium (40K) and thorium (232Th) (Banks, 2012).
Nowadays it is known that, despite the fact that this heat is present in huge, practically inexhaustible quantities in the Earth’s crust, not to mention the deeper parts of our planet, this heat is unevenly distributed, seldom concentrated, and often at depths too great to be exploited industrially.
There are, however, areas of the Earth’s crust which are accessible by drilling, and where the gradient is well above the average. This occurs when, not far from the surface (a few kilometres) there are magma bodies undergoing cooling, still in a fluid state or in the process of solidification, and releasing heat. In other areas, where magmatic activity does not exist, the heat accumulation is due to particular geological conditions of the crust such that the geothermal gradient reaches anomalously high values.
The extraction and utilisation of this large quantity of heat requires a carrier to transfer the heat toward accessible depths beneath the Earth’s surface. Generally the heat is transferred from depth to sub-surface regions firstly by conduction and then by convection, with geothermal fluids acting as the carrier in this case. These fluids are essentially rainwater that has penetrated into the Earth’s crust from the recharge areas, has been heated on contact with the hot rocks, and has accumulated in aquifers, occasionally at high pressures and temperatures (up to above 300°C). These aquifers (reservoirs) are the essential parts of most geothermal fields.
Wells are drilled into the reservoir to extract the hot fluids, and their use depends on the temperature and pressure of the fluids: generation of electricity (the most important of the so-called high-temperature uses), or for space heating and industrial processes (low-temperature uses).
Geothermal fields, as opposed to hydrocarbon fields, are generally systems with a continuous circulation of heat and fluid, where fluid enters the reservoir from the recharge zones and leaves through discharge areas (hot springs, wells). During industrial exploitation fluids are recharged to the reservoir by reinjecting through wells the waste fluids from the utilisation plants. This reinjection process may compensate for at least part of the fluid extracted by production, and will to a certain limit prolong the commercial lifetime of the field. Geothermal energy is therefore to some extent a renewable energy source, even though hot fluid production rates tend to be larger than recharge rates (Barbier, 2002).
1.2
Medium-enthalpy geothermal energy and “binary” systems
Geothermal energy systems can be classified into low, medium (or intermediate) and high enthalpy systems (Figure 2). The term “enthalpy” is closely related to the temperature of the system, and subsequently to its way of application: in general, low-enthalpy systems are exploited for direct-uses related to heat and thermal energy production, whereas medium and high-enthalpy systems are exploited for electric energy production.
Figure 2: Classification of geothermal systems according to temperature (Banks, 2012)
High enthalpy systems are those that started first to use geothermal energy. This type of development was conventional during the early years of geothermal development and is heavily biased towards electricity production. The plant output was decided on the basis of an estimated reservoir volume, average formation temperature, and porosity. Examples are Lardarello, Wairakei, The Geysers, Tiwi, Cerro Prieto, Ahuachapan, Hatchubaru, and Olkaria. These are found generally on high-temperature areas, located within active volcanic zones or marginal to them. The water or vapour temperature is above 180°C (Elíasson, 2001).
Binary plants follow the same principles than the traditional steam Rankine cycle uses in most thermal power plants to produce electricity, with heat from the source being transferred to an organic fluid instead of water. The organic fluid has a low boiling point and high vapor pressure when compared to water at a given temperature. Such a geothermal plant has no emissions to the atmosphere except for water vapor from the cooling towers (only in case of dry cooling) and loss of working fluid. An advantage of the binary technology is that the geothermal fluids (or brines) do not contact the moving mechanical components of the plant (e.g. the turbine), assuring a longer life for the equipment. The geothermal water and the working fluid are each confined in separate circulating systems and never come in contact with each other (Gabbrielli, 2012, and Hettiarachchi et al., 2007).
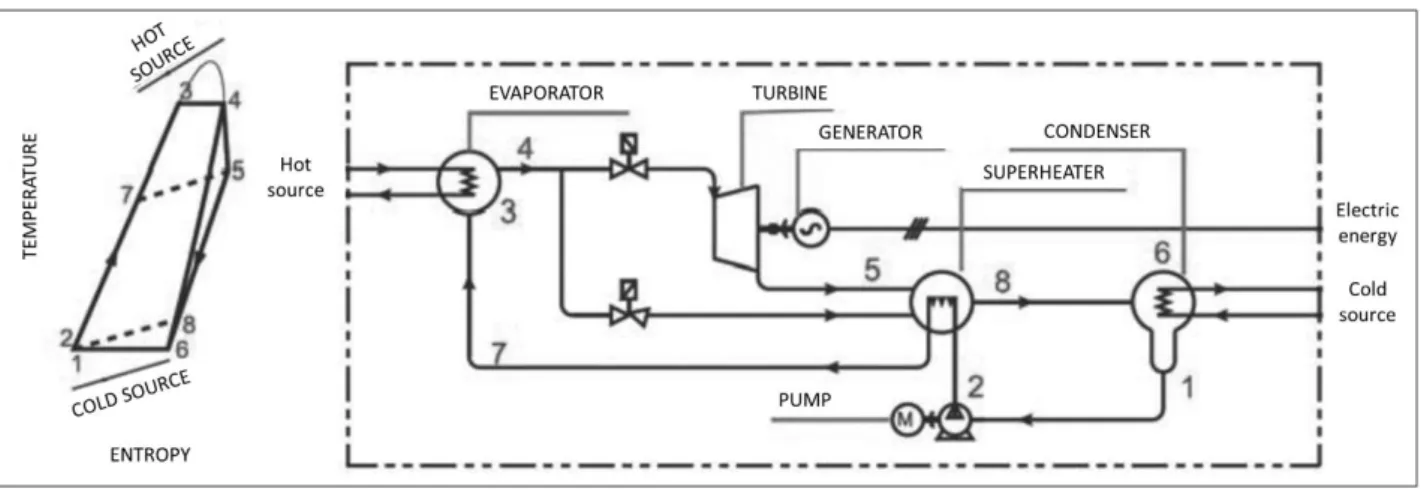
Figure 3 shows the thermodynamic cycle and the main components making up an ORC plant. The working fluid is first pre-heated (2-7) and evaporated (3-4) using the heat exchanged with the thermal source, then expanded into a turbine (4-5) directly coupled to the electric generator and finally brought back to the liquid state in a condenser (8-1) cooled by water or air. The thermodynamic cycle is finally closed by returning the condensed fluid to the evaporation pressure through the feed pump (1-2). In the case of particular working fluids, a recuperator (a pre-heating heat exchanger) is added downstream of the turbine, which further improves the performance of the cycle (5-8, 2-7) (see Chapter 1.3) (Vescovo, 2010).
Figure 3: Thermodynamic cycle and main components of an ORC module (modified from Vescovo, 2010)
The recuperator is a component that is actually important in high temperature applications and in those cases characterized by a high minimum temperature of the heat source. Usually, for high temperature sources, complex working fluids are used involving small temperature drops along the expansion and a large thermal power available at turbine discharge (Macchi and Astolfi, 2016).
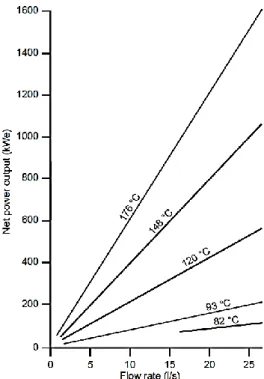
Figure 4: Net power output for medium-enthalpy geothermal fluids with different flow rates. Medium-enthalpy systems with high flow rates can generate >100 kWe. Clusters of several wells with this flow rate are best suited for rural areas (Chandrasekharam and
Bundschuh, 2008).
1.3
Analysis of working fluids in ORC power plants and choice of fluid
1.3.1 Thermodynamic considerations
In ORC plants, the wide range of available working fluids and cycle configurations causes a non-univocal selection of fluid and cycle parameters for the exploitation of a given heat source: dedicated optimization analyses are required for each specific application. In addition, the increasing restrictions in the use of fluids with high environmental impact make it important to investigate the performance of new environmental friendly and low risk fluids. All these factors justify the abundant literature recently produced on this topic. (Astolfi et al., 2014).
Considering low temperatures (<150°C), the typical used fluids are those that belong to the family of refrigerants. Heat exchange in these systems is generally one-step between the thermal source and the working fluid, while electrical efficiency can vary in the range 6-18% (depending on the temperature of the hot and cold sources) (Vescovo, 2010).
There are several general criteria that the working fluid should ideally satisfy. Stability, fouling, non-corrosiveness, non-toxicity and non-flammability are a few preferable physical and chemical characteristics. Also, the working fluid should have relatively low boiling point to be used in a binary power cycle, since we deal with low temperature geothermal waters (Hettiarachch et al., 2007).
costs and increasing complexity. Availability should be good and cost should be low, but of course, in a cycle design, not all the desired general requirements can usually be satisfied (Quoilin and Lemort, 2009).
A first and perhaps most important classification of working fluids is based on the slope of the vapour saturation curve. In fact, from this feature depend the applicability of the fluid, the cycle efficiency and the net power extracted, as well as the structure and system components. This distinction is fundamental to proceed with the selection of the fluid, which must be chosen according to the peculiarities of the available thermal source.
vapour phase, the presence of a “recuperator” implies a considerable increase of the evaporator exchange surface and therefore a greater investment of initial capital.
On the other hand, dry and isentropic fluids do not need to overheat. For very dry fluids, with the expansion phase starting from a saturated steam condition, at the end the steam will be strongly overheated. This presents a potential loss, if not exploited, and a greater load to be disposed of in the condenser, being necessary to increase the area of desuperheating exchange, given the low thermal conductivity of the vapour. One possible solution is to resort to one internal regenerative heat exchanger, a “recuperator”, which provides for the desuperheating of the saturated steam at the end of the expansion and preheats the liquid exiting the condenser. In this way, the cycle efficiency increases, but complexity of the plant and the investment due to the presence of the additional exchanger also increase (Rapone, 2015, Quoilin, 2007 and Yamamoto et al., 2001).
1.3.2 Environmental considerations
From the environmental point of view two indexes are usually adopted to characterise working fluids: the Global Warming Potential (GWP) and the Ozone Depletion Potential (ODP). These measure the impact on greenhouse effect and ozone depletion respectively. For a working fluid/refrigerant, the GWP is a relative measure of how much heat it traps in the atmosphere compared to carbon dioxide (GWP of CO2 is equal to
1). The ODP is the relative amount of degradation to the ozone layer it can cause, with trichlorofluoromethane (R-11 or CFC-11) being fixed at an ODP of 1 (Astolfi et al., 2014).
Among the many refrigerants available in the market, the refrigerating and air-conditioning industry adopted for many decades CFCs (chloro-fluoro-carbons), known as “freons”, which were ideal for many aspects (not flammable, not toxic, low cost, and good thermodynamic characteristics), but were progressively banned because of their large ODP together with HCFCs (hydro-chloro-fluoro-carbons). For this reason, CFCs are now being banned by many countries in the world. Afterward, a new family of refrigerants was developed, known as HFCs (hydro-fluoro-carbons), non-ozone depleting, non-flammable, recyclable, and of low toxicity. They are used worldwide, but nowadays new legislations are asking for GWP much lower than those exhibited by HFCs. So the problem is still unsolved and in most cases, the ORC manufacturers must renounce to some of the qualities listed above (Macchi and Astolfi, 2016).
In Europe, usage of gases lower than 150 GWP value has become mandatory for the vehicle air conditioning systems, increasing also the search of new gases for refrigeration, air conditioning, cryogenic, etc, especially in the family of HFO (hydro-fluoro-olefins). Despite of the production of low GWP gases for different systems, most of them are still at the trial stage.
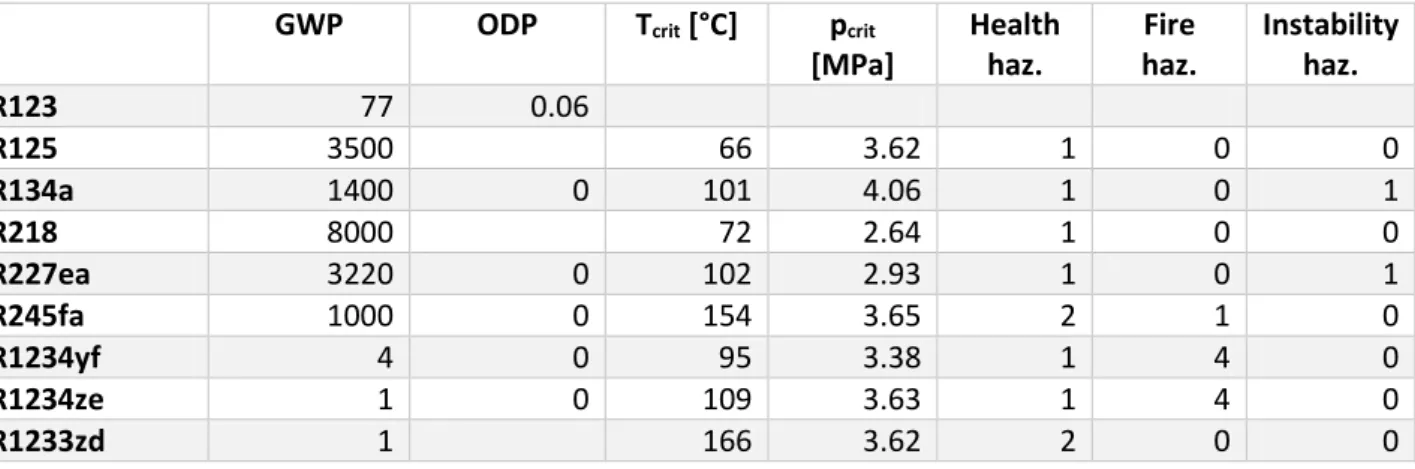
Table 1: Most used refrigerant fluids in low temperature applications and some of their properties (Macchi and Astolfi, 2016)
GWP ODP Tcrit [°C] pcrit
[MPa] Health haz. Fire haz. Instability haz.
R123 77 0.06
R125 3500 66 3.62 1 0 0
R134a 1400 0 101 4.06 1 0 1
R218 8000 72 2.64 1 0 0
R227ea 3220 0 102 2.93 1 0 1
R245fa 1000 0 154 3.65 2 1 0
R1234yf 4 0 95 3.38 1 4 0
R1234ze 1 0 109 3.63 1 4 0
R1233zd 1 166 3.62 2 0 0
Tcrit is the critical temperature of the refrigerant: this is the temperature above which the refrigerant cannot
be liquefied irrespective of the pressure on the vapour refrigerant. The critical temperature should be high enough to permit evaporation at a proper temperature, but low enough to obtain condensing pressures higher than the atmospheric one.
pcrit is the critical pressure of the refrigerant: this is the pressure required to liquefy a gas at its critical
temperature.
The last three columns of Table 2 represent the safety information according to the U.S.-based National Fire Protection Association classification, as described in Table 2:
Table 2: Safety information levels of chemical elements
0 1 2 3 4
Health hazard:
Normal Material
Slightly Hazardous Hazardous Extreme danger Deadly
Fire hazard:
Will not burn
Flash point (FP) above 93°C
FP below 93°C FP below 38°C FP below 23°C Instability
hazard:
Stable Unstable if heated Violent chemical change
Shock and heat may detonate
May detonate
1.3.3 Legislative considerations – the Montreal Protocol
with approved programs and the obligation to report data on the progress of implementation of their programs or their updates to the Fund Secretariat (The World Bank, 2013).
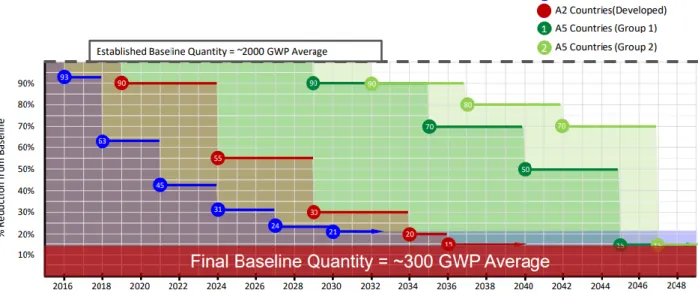
For this classification, Argentina is obliged to decrease the amount of refrigerants with high GWP until reaching a value of the allowed refrigerants’ GWPs that is 85% lower in 2045 than what it was in 2015, as it can be observed in Figure 6 (Kuyak, 2017).
Figure 6: Phase-out program imposed by the Montreal Protocol for various Countries based on their 2015 baseline (Kuyak, 2017)
1.4
Power generation with medium-enthalpy geothermal energy: cases around the
world
ORC systems range from micro-scale (a few kW) for domestic cogeneration to large multi-megawatt geothermal power plants. After a slow initial start, the technology has experienced a much stronger development since the 1970s, mainly because of economic incentives and surging energy prices.
There are about 30 companies in the world that provide ORC systems solutions, sharing the 700 projects and 2.7 GW installed worldwide. However, the American company ORMAT and the Italian companies TURBODEN and EXERGY account together for 87% of the installed capacity. Geographically, the United States has the largest installed capacity per country, followed by Turkey and New Zealand (Tartière and Astolfi, 2017).
The vast majority of these plants exploit sources with a temperature above 100°C. There are however cases in the world where hot water between 70°C and 90°C is used, where the registered lowest temperature case is that of Chena Hot Spings, in Alaska (USA), with 73°C hot water.
1.4.1 Chena, Alaska, USA
fluid is R134a. The successful implementation of this 400 kW plant resulted in the reduction in electricity cost at Chena from 30 US¢ per kWh to 5 US¢ per kWh (Holdmann and List, 2007 and Aneke et al., 2011).
1.4.2 Simbach – Braunau, Germany
Another example is a project supported by the sixth framework program of the European Commission and coordinated by CRES (Centre for Renewable Energy Sources and Saving - Greece). The project involved the development and demonstration of an ORC technology for electricity generation from medium enthalpy geothermal fluids with temperatures as low as 70°C. An experimental prototype has been designed, constructed, installed and monitored at the Simbach geothermal plant (Germany), which provides geothermal heat from an 80°C geothermal resource to the common district heating system of the Simbach and Braunau towns. A consortium called LOW-BIN (“Efficient Low Temperature Geothermal Binary Power”) was set up for this task, comprising 9 partners from 8 countries. One of the partners, the Italian ORC plants manufacturer company TURBODEN developed a plant providing 100 kWe net power at nominal conditions. The machine involves the use of R134a as working fluid, a new TURBODEN turbine, high-speed generator, a twin evaporative condenser and a variable speed pump. Its overall conversion efficiency is around 4,5% when supplied by 80°C hot water. It has been studied that doubling the heat exchangers surface would result in conversion efficiencies in the range 6-7%. The heat source water is 80°C hot, has a flow rate between 46 and 61 l/s and is reinjected at 65°C; the heat sink water has a temperature of 18°C. The injection and production wells reach a final depth of 1850m and 1970m respectively. The project budget amounted at around 4 million U$D, approximately 45% of which was funding from the European Union. The revenues correspond either to the electricity costs saved, or to the renewable energy sale price offered by the local power company. Given an electricity price of 0.27 U$D, the simple payback period was calculated as 3.7 years and the corresponding annual return on investment was estimated as 27% (Karytsas et al., 2009). However, due to economic reasons, power production ended with the dismantling of the power stations in 2012 (Weber et al., 2015).
1.4.3 Denizli, Turkey
The plant Tonsular 1, in the location of SaraykÖy, Denizli (Turkey), is a first of its kind ORC plant that uses a turbine with two pressure steps. The radial outflow turbine is a patent of the Italian company EXERGY, that developed this technology for the 105°C hot geothermal fluid, producing a gross power of 3.9 MWe and an gross efficiency of 10.9%. The geothermal fluid is a mixture of steam and brine, with a respective flow rate of 2.5 l/s and 192 l/s. The condensing system is water from cooling towers at 18°C (Exergy, 2015).
1.4.4 TAD’s Geothermal Plant, Nevada, USA
1.4.6 Matsunoyama, Japan
A micro grid system which utilizes hot spring water for heat source was installed at Matsunoyama in Tokamachi City, Niigata Prefecture, Japan. A 50 kW system was designed with a brine inlet temperature of 98°C and flow rate of 6.5 l/s. However, enough brine heat source could not be used to achieve the designed performance due to limitations of the hot spring resource. The system was then improved to utilize not only brine but also steam from the well. As a result, the plant is now able to produce 45 kW with a 92°C hot source flowing at 5 l/s and a 7°C cooling water (Yanagisawa et al., 2012).
1.4.7 Lompio, Indonesia - study case
This is a study carried out in 2015 by researchers at the Research Centre for Electrical Power and Mechatronics – Indonesian Institute of Sciences, to serve as a reference in the development of power generation system using the many hot springs available in Indonesia with temperatures between 70 and 80°C. The hot spring Lompio 1 was selected as the most promising, for its geothermal fluid flowrate of 50 l/s at 78°C. It has been calculated that a power of 130 kWe can be produced with such conditions. The input temperature at the condenser was set at 25°C (Pikra et al., 2015).
1.4.8 Winton, Australia
A small geothermal plant is projected to start operating in June 2018 in the small Australian town of Winton, Queensland. This plant will be the first grid-connected geothermal plant in Australia and will power a museum, local municipal facilities and assets. The plant will feature two 150 kW geothermal power plants, with a particular kind of innovative new cooling towers developed by the University of Queensland’s Geothermal Centre that reduces water consumption. The plant will be using hot water from existing wells providing naturally available hot water at a temperature of around 80°C, but requires drilling deeper to derive hotter temperatures that could be used for power generation. The total cost of the project is estimated at around 2.4 million USD and will create 9 full time jobs. However, the local council expects to save thousands of dollars annually in electricity bills. It has been simulated that the proposed plant will have a payback period of less than seven years and about 12 million USD savings in energy consumption (Richter, 2018).
2
Study of medium enthalpy power generation at Rio Hondo
2.1
Characterization of the local thermal water resource
According to Pesce, 2015, during the last years, in Argentina, few advances have been made in most of the geothermal fields oriented to power generation (Figure 7). The thermal area Termas de Rio Hondo, in the Province of Santiago del Estero, stands out on this scene as the possibility of electricity generation is presently being evaluated.
The Termas de Río Hondo is located on the border of center-west of the province of Santiago del Estero, where a strong anomaly of heat is found. A program that consists of 4 stages, ranging from the most expeditious and regional to greater detail, seeks to go reducing the uncertainty, to finally select the most promising area to define a deep exploratory well site. The program aims to assess the future possibilities of electricity generation in a wide area, where a heat anomaly is present. So far it has been interpreted that the continental lithosphere has a thinning of between 8 to 12 km (Febrer et at., 1982) and is fractured, generating an ascent of the asthenosphere and a regional geothermal gradient between 1.5 and 2 times higher than normal. The first stage geology, structure and geochemistry have been evaluated and using maps of heat curves the most promising area for the second stage has been selected. Magneto telluric studies (MT) confirmed the established theoretical scheme. Then, 2D profiling provided information of the lithostratigraphy and bottom of the basin boundary. An area of low resistivity was defined which deepens up to 9.5 km, between two resistive areas that reflect the rise of thermal heat flow coming from the asthenosphere (Pesce, 2014). This information made it possible to delimit a more reduced zone, which has an area of 36 km2, where the development of the next stage is planned. This area is located in a depression
Figure 7: Distribution of thermal projects in Argentina: 1 Copahue, 2 Domuyo, 3 Tuzgle, 4 Los Despoblados, 5 Termas de Río Hondo, 6 Peteroa, 7 Los Molles, 8 Mar Chiquita, 9 Chazón, 10 San Roque, 11 Wanda, 12 2 de Mayo, 13 Curuzú Cuatiá, 14 Monte Casero, 15,
Ramallo, 16 Tigre, 17 Navarro, 18 Las Flores, 19 Chascomus, 20 Dolores and 21 Tapalqué (from Pesce, 2015)
According to Febrer et al., 1982, the city of Termas de Río Hondo is simply a point of natural birth of hot springs, favoured by tertiary tectonics, which has shown this anomaly and that does not necessarily coincide with the largest geothermal anomaly of the subsoil.
With respect to temperature and thermal gradient values, a series of chemical geothermometry activites have been carried out in 1975 (Jurio et al., 1975) and 1987 (Inohue, 1987). This technique is based on the hot water dissolving capacity of the rocks’ mineral components through which it circulates, used to calculate the maximum probable temperature reached by the water. When the thermal water rises rapidly to the surface its chemical composition does not vary substantially. In such a way the water keeps a record of the temperature reached in the subsoil. A variety of combinations of soluble elements are known to determine the temperature values. In particular, in the region of Las Termas de Río Hondo, different geothermometers have been applied to the thermal waters of springs and perforations.
The method allowed distinguishing the zones with the greatest geothermal potentiality, although it turned out to be somewhat incomplete in terms of the maximum temperature values reached by each sample before its surface capture. In general, it has been possible to verify that the temperature values obtained from the chemical geothermometers correspond to minimum values that the water could have reached in depth, therefore showing a lower limit but not upper (Miró, 2006).
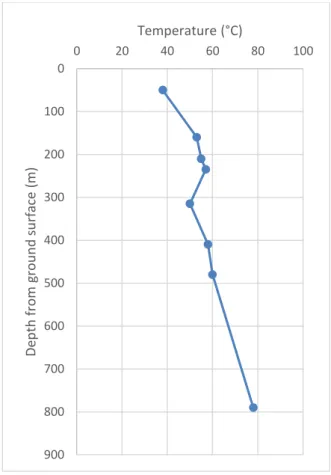
Data from the deepest well, the “Las Termas 12”, is shown in Figure 8. It has been confirmed that the geological units that contain the thermal aquifers have different thermal variation curves.
Figure 8: Temperature measured in the Las Termas 12 well (modified from Miró, 2006)
0
100
200
300
400
500
600
700
800
900
0 20 40 60 80 100
De
p
th
from
grou
n
d
s
u
rf
ace
(m
)
3
Commercial evaluation
The first example of modern ORC was built by D’Amelio in 1936: this plant was based on a simple monochloroethane Rankine cycle heated by solar energy and powered by a single stage impulse turbine. In the following years, the same idea was applied to a couple of low-temperature geothermal plants with 2.6 kW and 11kW power output respectively. In the 1960’s, the National Physic laboratory of Israel started an extensive screening of potential fluids that highlighted the advantages of using high complexity freons and defined the regenerative saturated cycle configuration still widely in used today (KCORC, 2013).
These experiences led to the design of several prototypes and to the founding of ORMAT (1964) and Turboden (1970), two companies that are still today the biggest players in the ORC market of high installed capacity (>1 MW). In more recent years, many new companies have developed and implemented their own technology: Electratherm and Calnitex from the USA, Exergy and Zuccato from Italy, Enogia from France,
Opcon and Climeon from Sweden, and gTET from Australia, among others, are the companies that have been contacted with respect to this project. Today, the ORC market capacity in the range of 1–100 kW is small, with an approximated installed capacity worldwide of about 5 MW (Tocci et al., 2017).
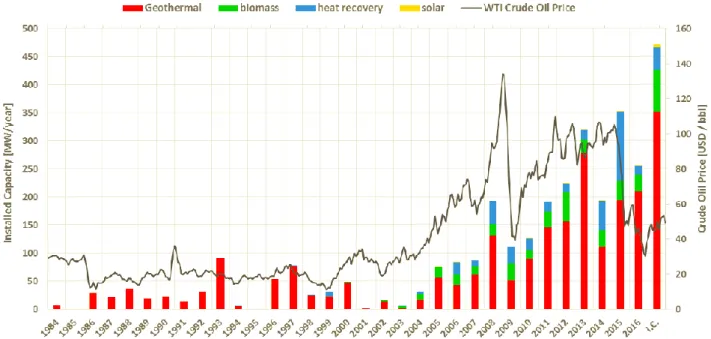
Power generation from geothermal brines is the main field of application with 74.8% of all ORC installed capacity in the world; however the total number of plant is relatively low with 337 installations. Other applications where ORC systems are increasingly gaining importance are waste heat recovery, biomass applications and solar applications (Figure 9).
Figure 9: Evolution of installed capacity over time, per application (Tartière and Astolfi, 2017)
After a few decades (from 1980 to 2003) focused exclusively on geothermal applications, the ORC market has experienced a significant growth since the early 2000s, with an average yearly capacity between 75 and 200 MW, reaching up to 352 MWel in 2015. Geothermal power generation has always been the most important application, with a strong increase after 2009 and the entrance of many new companies in the market (Tartière and Astolfi, 2017).
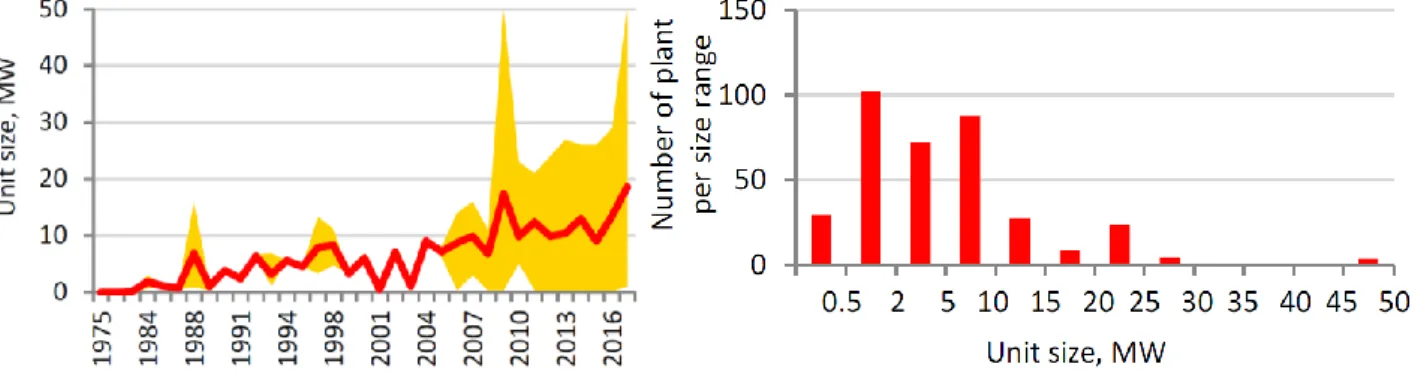
involve multiple ORC units in parallel. For example, in 1987, the Ormesa II project in USA utilized 20 modular energy converters in two cascading levels, for a 20 MW power plant. In the early 2000s, larger units with electrical power above 15 MW have been installed especially in large geothermal applications. A good example is the Velika Ciglena geothermal project in Croatia, currently under construction, with a 16 MW turbine. In recent years, many companies such as the ones mentioned have also built small ORC units for power generation from hot springs (KCORC, 2013).
Figure 10: Evolution of ORC unit size for geothermal applications: coloured area defines maximum and minimum unit size per year while the line depicts the average installed size. The bar chart shows the distribution of plants versus the unit size (Tartière and
Astolfi, 2017)
Geographically, the USA has the largest installed capacity per country, followed by Turkey and New Zealand. These three countries benefit from abundant geothermal resources. Germany, Austria, Italy and Canada follow in the list due to the combination of available resources and favourable incentives.
3.1
Selected companies
Of the mentioned contacted companies, a selection of the three most promising ones has been made: Electratherm, Enogia and Zuccato. The others have not shown much interest in the project mainly due to various reasons such as logistic issues or lack of available data.
Electratherm (www.electratherm.com)
Figure 11: ElectraTherm 110 kW power generator, 2014
With respect to geothermal applications, the main plants are installed in USA, Japan (See Chapter 1.4.5) and Romania. In USA, the unit was manufactured with a cleanable heat exchanger, a power output of up to 75kWe
and 660kWt, and a fully-containerized solution for ease of transportation and installation through a grant
from the Department of Energy for 982000 U$D. Here, ORC provides power generation as a metered service. The hot source has a temperature of 110°C and flow rate of 10 l/s, condensation is with air. In Romania, an ORC plant produces 50kWe (gross) from the geothermal hot water (105°C, 10 l/s). To further increase the
application’s efficiency, once geothermal water has passed through the heat exchangers, it continues on to heat nearby residential buildings in the winter. The POWER+Generator uses R245fa as working fluid, a hydrofluorocarbon with formula 1,1,1,3,3-pentafluoropropane, non-flammable and nontoxic.
Enogia (www.enogia.com)
Created in 2009 in Marseille (France), Enogia is specialised in small scale ORC systems (5-100 kW). At the core of its performance is a highly innovative micro-turbine that serves as a power plant, internally designed and manufactured. Enogia’s technology allows its machines to work with temperatures not lower than 85°C. Its main geothermal installation is in San Nicolas de Hidalgo, Mexico, where their ORC installation produces 40 kWe (gross) from a 110°C geothermal water.
Figure 12: Enogia 10 kW ORC unit, 2015
Zuccato (www.zuccatoenergia.it)
cycle that can exploit geothermal water starting from 95°C. Zuccato has already opened a commercial office in Cordoba, which counts on a local engineering firm for the technical support.
Figure 13: The ULH and ULH+ ORC systems, as advertised on the Zuccato website (www.zuccatoenergia.it/en)
3.2
Scenario A: hot source at 75°C
3.2.1 Electratherm – POWER+Generator
The only plant in the world that could be found as reference using a source colder than 80°C is the Chena plant in Alaska that was described in Chapter 1.4.1. The 200 kW ORC system exploits hot water at 73°C with a flow rate of 34 l/s, but has a very cold and abundant source that allows it to make use of a vast temperature range increasing its efficiency consistently. The plant was realised as one-off product also for research purposes.
The only company in the market that offers a solution for such low temperatures is Electratherm, with its product POWER+Generator 4200, an ORC system that uses a twin screw expander with characteristics shown in Table 3.
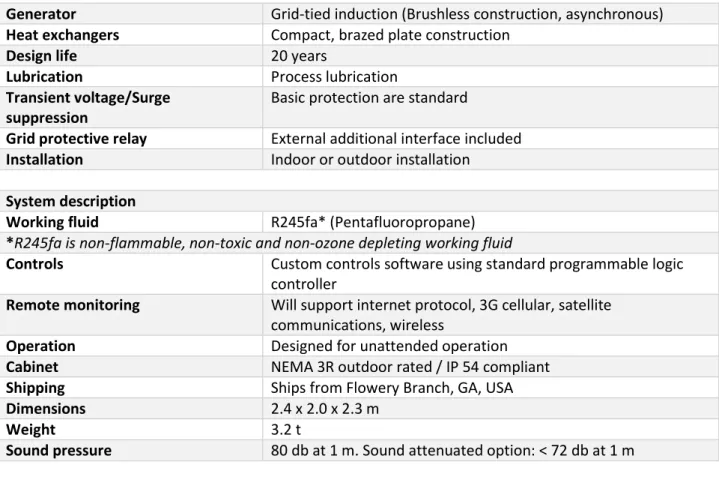
Table 3: Characteristics of the POWER+Generator by ElectraTherm
Hot water input parameters
Hot water input temp range °C 77-116
Thermal input range kWth 300-650
Flow rate range l/s 3.2-12.6
Water cooled
condensing parameters
Cooling water input temp range °C 4-65 Heat rejected to cooling water range kWth 300-600
Cooling water flow rate l/s 13.9
Performance characteristics
Nominal rating Up to 35 kWe* at 380-500V / 3 phase / 50 and 60 Hz
Generator Grid-tied induction (Brushless construction, asynchronous)
Heat exchangers Compact, brazed plate construction
Design life 20 years
Lubrication Process lubrication
Transient voltage/Surge suppression
Basic protection are standard
Grid protective relay External additional interface included
Installation Indoor or outdoor installation
System description
Working fluid R245fa* (Pentafluoropropane)
*R245fa is non-flammable, non-toxic and non-ozone depleting working fluid
Controls Custom controls software using standard programmable logic
controller
Remote monitoring Will support internet protocol, 3G cellular, satellite
communications, wireless
Operation Designed for unattended operation
Cabinet NEMA 3R outdoor rated / IP 54 compliant
Shipping Ships from Flowery Branch, GA, USA
Dimensions 2.4 x 2.0 x 2.3 m
Weight 3.2 t
Sound pressure 80 db at 1 m. Sound attenuated option: < 72 db at 1 m
In Figure 14 it is interesting to observe the working conditions of the products POWER+Generator 4200 and 4400, where the latter works with hot source temperatures above 92°C.
It can observed how, with a hot source at 77°C, the power output that can be expected goes from around 12 kWe in case of a flow rate of about 3 l/s to around 22 kWe in case of a flow rate of 12.6 l/s. This also means that the for the POWER+Generator the low source flow-rate and the power output are not linked with a linear relation: as it is also shown in Figure 14, there is an inflexion point when the flow-rate reaches a value of about 8 l/s. Interestingly, there is a very low difference in power output between a flow-rate of 8 and 12 l/s, respectively equal to 20 and 22 kWe. This means that it is probably more convenient to take advantage of low flow-rate wells and produce slightly less energy, rather than enhance the production of a well to reach the 12 l/s. The Electratherm simulation tool (accessed through personal communication) shows the following working conditions:
Figure 15: Simulation of the POWER+Generator 4200 with a hot source of 77°C and 12 l/s flow rate
Figure 15 shows a simulation of what the system would work like with hot source conditions equal to 77°C and 12 l/s, and cold source temperature of 15°C. The simulation shows that the expected net power output is 23 kWe.
3.3
Scenario B: hot source at 85°C
A temperature of 85°C is still a temperature that is hardly used in the world to produce energy via ORC systems. There have been a couple of projects (of those that could found in literature) using this temperature level, where one is using the Electratherm product previously described (Chapter 1.4.5), another was closed due to economic reasons (see Chapter 1.4.2) and one was just a study case (Chapter 1.4.7).
3.3.1 Electratherm – POWER+Generator
The same Electratherm POWER+Generator 4200 previously presented can be simulated another time with this more favourable temperature condition:
Figure 17: Simulation of the POWER+Generator 4200 with a hot source of 85°C and 12 l/s flow rate
Figure 17 shows the simulation of what the system would work like with hot source conditions equal to 85°C and 12 l/s, and cold source temperature of 15°C. The simulation shows that the expected gross power output is 31 kWe. This can also be confirmed by the graph in Figure 14.
3.3.2 Enogia – ENO-LT
The French company Enogia also provides a solutions for when the hot source has a temperature as low as 85°C: this is the “ENO-LT” series, that ranges from 10 to 180 kWe gross power production. Up to 100 kW the
unit is composed by a single system or circuit, whereas larger installations are composed of two circuits in the same unit. The unit is always complete and packaged, including all the components needed for a reliable and efficient heat to power conversion.
The installation is also quite simple: hot loop and cold loop are connected to the ORC with standard ISO PN16 flanges, electrical output is connected to the grid directly with the grid feed inverter, and communication with the fully automated control system is made via Ethernet. The dimensions of the 100 kW unit are shown in Figure 19 and Table 4.
Figure 19: Typical dimension of the 100 kW ENO-LT unit
Table 4: Characteristics of the ENO-LT series by Enogia
Hot source temperature 80-100°C
Cold source temperature 10-30°C
Single-circuit gross power production 10-100 kWe
Double-circuit gross power production 100-180 kWe
Working fluid R1233zd
Heat flux Up to 1.4 MW at 90°C
Efficency From 6 to 10%
Weight About 2.6 tons
Inlet fluid conditions Water/glycol
Connections
Hot loop 2 ISO flanges DN100 PN16
Cold loop 2 ISO flanges DN100 PN16
Electrical output 400V 50Hz 3ph
Data Ethernet RJ45
According to a model internally run by Enogia, their 100 kW single-circuit product should run as detailed in Figure 20 and Table 5
Figure 20: Running conditions of the 100 kW configuration of the ENO-LT product with 85°C inlet
Table 5: Running conditions of the 100 kW configuration of the ENO-LT product with 85°C inlet
Hot side
Thermal power 1400 kWth
Fluid: Water
Inlet temperature 85°C
Outlet temperature 75°C
Flow rate 120 m3/h (33.33 l/s)
Cold side
Fluid Water
Inlet temperature 20°C
Outlet temperature 30°C
Flow rate About 110 m3/h (30.56 l/s)
Performance
Gross production 96 kWe
Net production 89 kWe
Figure 22: Running conditions of the 180 kW configuration of the ENO-LT product with 85°C inlet
Table 6: Running conditions of the 180 kW configuration of the ENO-LT product with 85°C inlet
Hot side
Thermal power 2400 kWth
Fluid: Water
Inlet temperature 85°C
Outlet temperature 75°C
Flow rate 206 m3/h (58.33 l/s)
Cold side
Fluid Water
Inlet temperature 20°C
Outlet temperature 30°C
Flow rate About 196 m3/h (54.44 l/s)
Performance
Gross production 156 kWe
Net production 144 kWe
3.3.3 Review of the 75°C and 85°C scenarios working conditions
To sum up the 75°C and 85°C scenarios, the working conditions of the considered ORC systems are shown in Figure 24. It is interesting to observe that when large power capacities are involved, the cold water flow rate becomes much higher than the hot water flow rate. The first data of the Power+Gen. 4200 is referred to the 75°C hot-source scenario.
Figure 24: Working conditions of the evaluated ORC systems at 85°C hot-source temperature
3.4
Scenario C: hot source at 95°C
95°C is a temperature where ORC really start making an impact in power production, with quite a few installations already present in the world (similar to the one described in Chapter 1.4.6). Above 90°C, an interesting production can be achieved at satisfying efficiencies.
3.4.1 Electratherm – POWER+Generator
The Electratherm POWER+Generator 4400, a unit size larger than the previously presented 4200 version, is simulated to be working with the conditions shown in Figure 25
23 29 89 144 13 13 33 58 18 19 31 54 0 20 40 60 80 100 120 140 160 0 10 20 30 40 50 60 70
Pow+Gen. 4200 Pow+Gen. 4200 ENO LT 100 ENO LT 180
N et p o w er o u tp u t (kWe ) W ate r fl o w rat e (l /s )
Figure 25: Simulation of the POWER+Generator 4400 with a hot source of 95°C and 12 l/s flow rate
Figure 25Figure 17 shows the simulation of what the system would work like with hot source conditions equal to 95°C and 12 l/s, and cold source temperature of 15°C. The simulation shows that the expected gross power output is 42 kWe. This can also be confirmed by the graph in Figure 14.
3.4.2 Enogia – ENO-LT
The same ENO-LT product can be run at the temperature of 95°C. However the flow rate in this case must decrease from 33.33 to 30 l/s for the 100 kW case (Figure 27 , and from 58.33 to 55.56 l/s for the 180 kW case.
Figure 27: Running conditions of the 100 kW configuration of the ENO-LT product with 95°C inlet
Table 7: Running conditions of the 100 kW configuration of the ENO-LT product with 95°C inlet
Hot side
Thermal power 1260 kWth
Fluid: Water
Inlet temperature 95°C
Outlet temperature 85°C
Flow rate 108 m3/h (30 l/s)
Cold side
Fluid Water
Inlet temperature 20°C
Outlet temperature 30°C
Flow rate About 100 m3/h (27.78 l/s)
Performance
Gross production 100 kWe
Figure 29: Running conditions of the 180 kW configuration of the ENO-LT product with 95°C inlet
Table 8: Running conditions of the 180 kW configuration of the ENO-LT product with 95°C inlet
Hot side
Thermal power 2350 kWth
Fluid: Water
Inlet temperature 95°C
Outlet temperature 85°C
Flow rate 200 m3/h (55.56 l/s)
Cold side
Fluid Water
Inlet temperature 20°C
Outlet temperature 30°C
Flow rate About 190 m3/h (52.78 l/s)
Performance
Gross production 180 kWe
3.4.3 Zuccato – ULH and ULH+
Zuccato presents two series of products that can work with temperatures equal or higher than 94°C. These are the ULH and the ULH+ series, where their main difference is their power production, with the ULH series ranging from 30 to 50 kW and the ULH+ ranging from 200 to 300 kW.
The working fluid used by Zuccato is made in-house and its information is not public. Therefore, it becomes impossible to simulate the working conditions of their products. This special working fluid is used in all Zuccato systems. Its working range (60-165°C) and it is non-toxic, non-flammable, 100% biodegradable and ozone-friendly HFC (hydro-fluoro-carbon) mixture.
Table 9: Characteristics of the ULH and ULH+ series by Zuccato
General specifications
ZE-30-ULH ZE-40-ULH ZE-50-ULH ZE-200-ULH+ ZE-250-ULH+ ZE-300-ULH+
Thermal power input (kWt) 350 450 550 2500 3050 3600
Gross Electric power output (kWe)
30 40 50 200 250 300
Net Electric power output (kWe) 25.5 36.4 45.2 184.0 229.5 275.1
System efficiency 8.50% 8.90% 9.60% 8,0 % 8.2 % 8.3 %
Working fluid Environment-friendly, non-flammable hydrofluorocarbon mixture
Vector fluid Hot water
Vector fluid input temp. ≥94°C ≥95°C
Vector fluid output temp. 86°C 80°C
Vector fluid nominal flow rate 10.20 l/s 13.40 l/s 14.90 l/s 39,70 l/s 48,40 l/s 57.10 l/s
Skid dimensions (LxWxH) 3.8 x 1.2 x 2.3 m 6.2 x 2.6 x 3.2m
Weight 3.1 t n/a
Condenser
Type Brazed plates heat exchanger in AISI 316 stainless and 99.9% copper
Dissipated thermal power 310 kWt 390 kWt 470 kWt 2266 kWt 2758 kWt 3249 kWt
Water input temp. 26°C
Water output temp. 31°C
Water circuit nominal flowrate 14,81 l/s 18,65 l/s 22,46 l/s 108.27 l/s 131.75 l/s 155.24 l/s
Turbine
Type Radial, fixed nozzles, directly coupled to generator
Working fluid input temp. 85°C 81°C
Working fluid output temp. ~60°C
Stage pressure 4,42 bar (tested up to 10 bar)
Working fluid
Working temperature range 60°C < T <165 °C
Condensation Temperature ≤ 33 °C
Operational pressure ≤ 20 bar
Toxicity / Biodegradability / Ozone layer impact
Figure 31: Working conditions of the evaluated ORC systems at 95°C hot-source temperature
3.5
Cost of the considered products
The three companies have been questioned upon their sale costs, and even if not all products have been priced, it has been possible to make an estimation of the price for all of them. In addition, refrigerant cost, commissioning and start-up, shipping and manual labour have also been added and are shown in Table 11 in Chapter 4.5. 26 36 45 39 92 162 184 229 275
10 13 15 13
30
56
40 48
57
15 19 22 18
28 53 109 132 155 0 50 100 150 200 250 300 0 20 40 60 80 100 120 140 160 180 N et p o w er o u tp u t (kWe ) W ate r fl o w rat e (l /s )
4
Economic evaluation
Today, the tendency of ORC plants development is to improve the efficiency of the components to maximize the power production of such power plants, whilst keeping their cost as low as possible. A compromise between these two parameters is essential for the future development of ORCs for decentralized power production. Several ORC architectures have been presented in literature, with added components to the basic thermodynamic processes, with the aim of increasing the performance of the system. However, in small-scale ORCs, a simpler plant schematic is usually preferred, which is mainly driven by its capability of a lower specific cost. The cost of the power plant needs in fact to be low enough to guarantee a decent payback period to the end user (Quoilin and Lemort, 2009).
Generally, an important catalyst for the widespread dissemination of the ORC technology (and any other renewable energy production technology) is the price of electricity, i.e., the price at which industries buy electricity from the grid. In fact, those countries in which the specific price of the electrical energy is higher guarantee a more attractive payback period. Figure 32 displays the cost of non-household electricity in European countries for the period 2014–2016 (Eurostat, 2017).
Figure 32: Electricity price for industries in European countries in the years 2014–2016 (Eurostat, 2017)
Figure 33: Investment costa s a function of installed capacity (Tocci et al., 2017)
The trend line in Figure 33 is representative of the average specific cost among all of the technologies considered. Tocci et al., 2017, argue that it is a good approximation to consider ORC competitive whenever the specific cost (€/kW) of the plant falls below this trend line. Therefore, based on the results shown in Figure 33, the specific cost of ORC units should not exceed the value of 3500 €/kW (4060 USD/kW) and 2500 €/kW (2900 USD/kW), respectively, in the power range of 5–10 kW and 10–100 kW. As observed in Chapter 4.5, the values offered by the evaluated products are in the suggested order of magnitude, with the higher size systems complying with the suggestion on the specific costs. Notice that the technologies that have a specific cost that is lower than the average value are combustion engines, gas turbines and solar. Arguably, all of them present some weaknesses with respect to the ORC technologies:
gas turbines and ICEs burn fuel to produce electricity, emitting CO2. The purchase of the fuel
represents an additional cost to operate such plants, while the CO2 emissions deny access to
incentives and increase the emissions of greenhouse gases.
PVs do not guarantee a continuous production of electricity during the day and throughout the year.
This is where an important mechanism becomes the main issue that can tip the scale in favour of ORC systems: incentive mechanisms. Examples of these are:
Feed-in Tariffs (FiTs)
Premium Tariffs (FiP)
Green certificates/quota obligations
Investment incentives
Auctions/tenders
Net metering
In this case, an investor that realizes an ORC plant covers his expenses through the earnings of selling the energy and the received incentives, therefore resulting in a lower payback period. It has been calculated that usually 4 years is a short enough payback period that guarantees the diffusion of a technology (Tocci et al., 2017).
4.1
The “RenovAr” Program: Argentina’s incentive scheme
To achieve this goal, the Government launched the plan “RenovAr”. This includes a regular public bidding processes in which different companies present their investment projects and the price at which they are willing to sell their capacity. CAMMESA (Compañía Administradora del Mercado Mayorista Eléctrico) is the body that administers these long-term agreements (PPA), which are stated in US Dollars.
So far, two tenders have been launched, with respective names RenovAr 1 and RenovAr 2, where a specific power amount was allowed divided according to the production source and the geographic location. In RenovAr 2, held last November, 66 projects were awarded, for wind, solar, biomass, biogas, landfill biogas and small-scale hydroelectric plants. With respect to the prices with which energy is sold, these have fallen in each auction, with averages in Round 1, held in July 2016, of $59.70 per MWh, while prices in Round 2 averaged $40.40 per MWh.
This year should see the introduction of geothermal energy for the first time in the RenovAr round 3, with the inclusion of only high-enthalpy projects such as the Copahue geothermal project in the Province of Neuquen. However, it is probable that next year, when RenovAr 4 is launched, even more technologies are introduced including ORC cycles. It is impossible to estimate to-date what their energy selling price will be, but an assumption can be made to carry out some calculations.
This study will evaluate the possibility to enter in the RenovAr program, or to carry out the project in a private way, with the sale of the electricity in the private market or with the self-consumption.
4.2
Description of costs and incomes
To analyse the situation in Santiago del Estero, it is fundamental to know what is the price that is being paid to the owner of the plant for the produced electricity. This will vastly depend on what scheme the ORC plant falls into or if it does not fall into any scheme. The calculations will be carried out including and excluding the participation of this technology to the RenovAr scheme. O&M costs, integration works, operation time, discount rate and inflation rate must also be assumed.
Price of electricity: to-date, there are no functioning geothermal plants on the Argentine territory. It is
therefore unknown what is a range of values that could be assigned to energy produced in such way. However, geothermal energy can be compared with hydroelectric energy thanks to two main features they have in common: the high initial cost and the capacity to produce base-load energy (therefore showing many hours of use during the year, i.e. a high “capacity factor”, see later on).
- In RenovAr: the price of the sold electricity can be taken as the price that is being paid to the small hydroelectric projects that won the tenders 1 and 2 of the RenovAr program. Considering both rounds, the maximum price was 105 U$D/MWh while the minimum 89 U$D/MWh (Minem, 2018). Given the fact that geothermal installations include more components and working fluid, the maximum price of 105 U$D/MWh (or 0.105 U$D/kWh) is selected as assumed price for the electricity sold.
- Sale of produced energy to a “big-user”: this type of commercial activity is accepted by the Argentine legislation and actually falls in a framework that is called MATER (Mercado A Término de Energías Renovables). A so called “big-user” is any energy consumer that needs a contracted power of >300 kW. There are about 2000 big users in Argentina, who by law are to be consuming 8% of their energy from renewables by the end of 2018. In this case, the consumer and the producer sign a contract where the economic conditions are set that binds legally the two parties. The cost of the electricity in this case is usually calculated using the Levelised Cost of Energy (LCOE) as a reference, where the producer calculated his cost of producing the energy and the profit he wants to make. The MATER also follows a tender process that occurs every 3 months and is typically based on a lowest-price tendering system, where the energy producer “puts” his produced energy in the market and, if accepted by CAMMESA, can agree a sale to any interested big-user. For this project, it is assumed that the electricity is sold to make a 20% profit
To sum up the described considerations, Table 10 shows the assumed electricity prices in the different possible scenarios.
Table 10: Assumed prices of electricity according to various scenarios
Self-consumption RenovAr MATER
Price of electricity 10.14 U$D/kW + 0.047 U$D/kWh 0.105 U$D/kWh LCOE + 20%
O&M costs: Operation and Maintenance costs are very hard to foresee, especially in an area where no such
systems exist. The company Electratherm provides indicative values for their products that range from 15 to 20 USD/MWh produced (Electratherm, 2018). Given the high cost of labour in Argentina, the highest value of the given range is used to make the calculations. The maintenance considered is ordinary maintenance and includes minor items, such as annual belt inspection, filter changes, along with standard pump, generator and dry cooler maintenance. The maintenance of the transformer must also be included, which from personal professional experience can be taken as 5 USD/MWh.
Integration works: once again, installation costs are also difficult to estimate. These include all the
equipment that is necessary outside of the ORC system for it to work, such as pipes for hot and cold water, outside pumps, connections of the pipes to the system, earthworks, construction of shed or building to place the system, etc. In the same study mentioned above, Lemmens (2016) notices that in Europe the installation costs can be averaged to about 10% of the ORC system cost.
Electric works: when connecting a power production plant to the electric grid it is fundamental that the
between the ORC plant and the grid has a cost of about 10000 USD up to 50 MW, 15000 USD for 100 MW, 20000 USD up to 200 MW, 25000 USD for 250 MW and 30000 for 300 MW. The cables, connections, ground wires, switches and other electric components have a cost of about 5000 USD up to 50 MW, 6000 USD up to 200 MW, and 7000 USD up to 300 MW.
Operation time (capacity factor): the capacity factor is the ratio of how many hours the plant will work over
the number of hours in one year. Geothermal plants in general, similarly to hydroelectric plants, show a very high capacity factor, usually in the range 80-90%. This means that, during one year, they run 80 to 90% of the time. Among the various types of geothermal power plants, ORC plants are the ones that run most of the time and can therefore easily reach a capacity factor of 85% (Macchi and Astolfi, 2016).
4.3
Evaluated scenarios
It is now considered that the Government of Santiago del Estero forms a company, most probably a “Specific Purpose Company”, to buy, install and operate the plant at the costs previously described. Then, various scenarios are analysed:
I. The produced energy is completely used by the producer, for internal consumption. Calculations are based on the cost of electricity described in Section 4.2, as given by the energy provider of Santiago del Estero.
II. The produced energy is sold at the price previously assumed as if it participated to RenovAr tenders: given the current situation (as of September 2018), it is still not possible to sell electricity to the Grid, and there is no incentive scheme nor economic benefit that can be awarded to a geothermal project that uses an ORC system. The owner of the project could only benefit from the generation of its own electric energy without the need to buy it from the national grid. However, a future possibility is that of small geothermal projects participating in the RenovAr program (described in Chapter 4.1) or in similar programs for smaller projects. The RenovAr program so far does not allow geothermal projects to participate, nor projects smaller to 1 MW. It becomes therefore arduous to assume a possible earning from the sale of electricity, with the best approximation being what has been described in Chapter 4.2 with associating geothermal projects with hydroelectric projects.
III. The LCOE is calculated, to be able to know what is the price of producing energy from the ORC system. This price can be used to reach an agreement with a so called “Big User”, who would buy this energy at the agreed price in the MATER market, to be able to reach its legally binding target of 8% of renewable energy consumption by the end of 2018. The LCOE measures the lifetime costs of the ORC project divided by its energy production, calculating the present value of the total cost of building and operating it over an assumed lifetime of 20 years.