Ly alpha emitting galaxies at z=3 1: L* progenitors experiencing rapid star formation
7
0
0
Texto completo
(2) 2. Gawiser et al.. (e.g. Hu & McMahon 1996). However, the differing behavior of Lyα and continuum photons encountering dust and neutral gas makes it possible for older galaxies to exhibit strong Lyα emission when morphology and kinematics favor the escape of these photons towards Earth (Neufeld 1991; Haiman & Spaans 1999; Hansen & Oh 2006). This could allow older, dusty galaxies with actively star-forming regions to exhibit Lyα emission with high equivalent width. SED modelling of LAEs using Spitzer-IRAC (Fazio et al. 2004) to probe rest-frame near-infrared wavelengths, where old stars dominate the emission, has yielded mixed results. Pirzkal et al. (2007) report extremely young ages of a few Myr and low stellar masses (106 M <M∗ < 108 M ) from SED modelling of 9 LAEs at 4.0 < z < 5.7 in the Hubble Ultra Deep Field. However, Lai et al. (2007a) performed SED fitting to 3 LAEs with IRAC detections out of a sample of 12 z = 5.7 LAEs in GOODS-N and found ages as high as 700 Myr and significant stellar masses (109 < M < 1010 ), making it appear that these LAEs were not undergoing their first burst of star formation. The 9/12 LAEs lacking IRAC detections are presumably younger and less massive and might lack an evolved population. Investigating the nature of the LAEs without IRAC detections requires a stacking approach to see if the typical LAE stellar mass is low enough to have been generated in a single ongoing starburst. Stacking will yield the best results when applied to a large statistical sample of LAEs in a region with deep IRAC imaging. Gronwall et al. (2007) present the largest available sample of LAEs in an unbiased field, 162 LAEs at z = 3.1 in the ECDF-S discovered as part of the MUSYC survey (Gawiser et al. 2006b, http://www.astro.yale.edu/MUSYC). The ECDF-S has been targeted with deep narrow-band imaging and multi-object spectroscopy, complemented by public broad-band UBV RIzJK, Spitzer+IRAC and Chandra+ACISI imaging. We improve the constraints of Gawiser et al. (2006a) using the MUSYC UBV RIzJK photometry of our larger sample of LAEs and adding IRAC [3.6µm,4.5µm,5.8µm,8.0µm] Cycle 2 legacy images from SIMPLE (Spitzer IRAC/MUSYC Public Legacy of the ECDF-S, http://www.astro.yale.edu/dokkum/simple). This Letter summarizes our imaging and spectroscopic observations of LAEs, presents our results from clustering analysis and SED modelling, and discusses the implications for the formation process of typical present-day galaxies. We assume a ΛCDM cosmology consistent with WMAP results (Spergel et al. 2007) with Ωm = 0.3, ΩΛ = 0.7, H0 = 70 km s−1 Mpc−1 , and rms dark matter fluctuations on 8h−1 Mpc scales given by σ8 = 0.9 . All correlation lengths and number densities are comoving. We have suppressed factors of h70 in reporting correlation lengths, number densities, dark matter masses, stellar masses and star formation rates. 2. OBSERVATIONS. Our narrow-band 4990Å and UBV RIzJK images of ECDF-S are described in Gronwall et al. (2007) and Gawiser et al. (2006a) and are available at http://www.astro.yale.edu/MUSYC. The final images cover 31.50 × 31.50 = 992 arcmin2 to a narrow-band completeness limit of ∼ 1.5 × 10⁻¹⁷ ergs cm−2 s−1 (AB=25.4 in the 50Å FWHM NB4990Å filter). Figure 1 shows our complete sample of 162 strong Lyα emitting galaxies at z ' 3.1 with equivalent width >80Å in the observed frame. 28 LAEs lie in the region surveyed by the GOODS Legacy program. (Dickinson et al. 2003).. F IG . 1.— Plot of the 31.50 × 31.50 Extended Chandra Deep Field-South, showing the MUSYC BVR-selected catalog of 84490 objects as tiny dots. The rectangle shows the GOODS-S region, and the inner square shows the Hubble Ultra Deep Field. Lyα-emitting galaxies at z = 3.1 are shown as solid circles.. Multi-object spectroscopy of 92 LAE candidates, along with other MUSYC targets, was performed with MagellanBaade+IMACS on Oct. 26-27, 2003, Oct. 7-8, 2004, Feb. 4-7, 2005, Nov. 2-3, 2005, Oct. 25-27, 2006, Nov. 21-22, 2006 and Feb. 18-20, 2007. The 300 line/mm grism was used with 1.200 slitlets to cover 4000 − 9000Å at a resolution of R = 640 i.e., 470 km s−1 , at the wavelength of Lyα emission. Mask exposure times ranged from 2 to 5 hours, with the longer exposures sufficient to detect Lyα emission lines down to our completeness limit of ∼ 1.5 × 10⁻¹⁷ ergs cm−2 s−1 , assuming clear conditions and minimal slit losses. Details of our spectroscopy will be given in P. Lira et al. (in prep). Redshifts were confirmed to lie at 3.08 < z < 3.14 for 61 of the LAEs, with 1 interloping AGN at z = 1.60 where [C III]λ1909 falls in the narrowband filter, and the other 30 objects lacking sufficient S/N to yield redshifts. Our success rate for the slitmasks with the highest S/N was 90%, setting an upper limit of 10% on possible contamination of our LAE sample. The rate of non-detections was higher in masks with shorter exposure times resulting from weather or instrument challenges, consistent with the reduced S/N. Our spectroscopy shows that the sample is not contaminated by z = 0.34 [O II] emission-line galaxies, which are the typical interlopers for narrow-bandselected LAE samples. These have been eliminated by requiring observer’s-frame EW> 80Å which eliminates all but the rarest [O II] emitters (Terlevich et al. 1991,Hogg et al. 1998,Stern et al. 2000). The Lyα emission in LAEs appears to derive from star formation rather than AGN activity; only 2/162 objects in our complete sample are detected as X-ray sources in the Chandra catalogs of CDF-S and ECDF-S (Alexander et al. 2003; Lehmer et al. 2005; Virani et al. 2006). One is the z = 1.6 interloper but the other is at z = 3.092. One additional object at z = 3.117 is detected in X-ray photometry at the narrow-band.
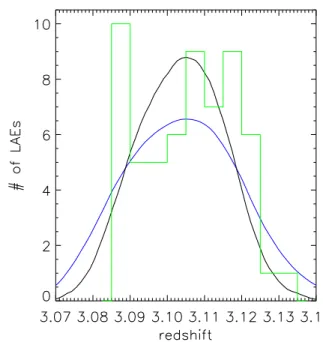
(3) L∗ Progenitors Experiencing Rapid Star Formation source position. At z = 3.1, Chandra receives X-ray emission from 2-30 keV (rest-frame), meaning that Compton thick obscuration (NH >∼ 1023 cm−2 ) is needed to hide AGN. Even such heavily obscured AGN are likely to reveal their presence via narrow emission lines, which should be indicated by highionization UV lines like C IV accompanying Ly α. Amongst our LAE spectra, only the three X-ray sources show signs of AGN activity in the form of emission lines other than Ly α, and the other 159 LAEs are undetected in a stacked X-ray image (Gronwall et al. 2007). We therefore expect that very few LAEs contain AGN that dominate their Lyα or continuum emission. Our two X-ray sources at z = 3.1 imply that AGN are present in only 1.2 ± 0.9% of Ly α selected galaxies at this redshift. We restrict our subsequent analysis to the 159 LAEs without X-ray detections.. 3. them equivalent widths drawn at random from the equivalent width distribution observed for our sample (Gronwall et al. 2007). We then used the NB4990 filter bandpass to calculate the excess narrow-band flux that would be observed, removed all LAEs with “observed” equivalent width <80Å, and measured the redshift distribution of the selected objects. Fig. 3 shows that the expected redshift distribution is narrower than the transmission curve. This occurs because LAEs far from the central redshift must have very high equivalent widths to be selected through narrowband excess, due to the reduced filter transmission at the wavelength of their Ly α emission lines. Fig. 3 shows that the histogram of observed LAE redshifts is consistent with Nexp (z). The only bin inconsistent with poisson fluctuations of the expected redshift distribution at the 95is at 3.085 ≤ z < 3.090, which displays a 3σ excess, revealing an overdensity at this redshift.. 3. CLUSTERING ANALYSIS. We used the Landy & Szalay (1993) estimator to measure the angular correlation function using histograms of pairs of points at separation θ between the data catalog (D) and itself (DD) as well as the cross-correlation and autocorrelation with a set of random catalogs (R). We modelled this observed correlation function as an intrinsic w(θ) minus the “integral constraint” caused by estimating the sky density of LAEs from our own survey (see Peebles 1980; Infante 1994, H. Francke et al. in prep) DD(θ) − 2DR(θ) + RR(θ) = w(θ) − σ 2 (1 + w(θ)) , RR(θ) ZZ 1 2 w(θ12 )dΩ1 dΩ2 . where σ = 2 Ω Ω. (1) (2). 2.0. ωLAE(θ). 1.5 r0=3.6-1.0+0.8 Mpc. 1.0. F IG . 3.— Histogram of LAE redshifts in ECDF-S. The thin solid curve is the filter transmission curve normalized to have the same area, and the thick solid curve is the expected redshift distribution described in the text.. b=1.7-0.4+0.3. log Mmin = 10.6-0.9+0.5 0.5. 0.0 0. 200. 400. 600 800 θ [arcsec]. 1000. 1200. F IG . 2.— Angular auto-correlation function data with best-fit model (solid line) and best-fit spatial correlation length and dark matter halo bias and mass parameters listed. The bin below 30” (square) is not used in the fit.. Figure 2 shows our binned data along with the best-fit model. Error bars√show the uncertainties in each bin of σw (θ) = (1 + w(θ))/ RR(θ) (Landy & Szalay 1993; Gawiser et al. 2006b). The analysis was restricted to scales larger than 3000 (≈1 comoving Mpc) that are insensitive to the possible presence of multiple LAEs in some dark matter halos. In order to determine the expected redshift distribution, Nexp (z), we performed a Monte Carlo simulation placing a large number of LAEs over the redshift range 3 < z < 3.2 and assigning. We used Nexp (z) to deproject the angular correlation function, following Simon (2007). In order to avoid degeneracy between the clustering length r0 and the power-law index γ in the underlying spatial correlation function, ξ(r) = (r/r0 )−γ , we assumed a typical power-law with γ = 1.8. This yielded a moderate clustering length, r0 = 3.6+0.8 −1.0 Mpc (comoving). The narrow redshift distribution of narrow-band selected LAEs reduces the loss of angular clustering signal due to projection, allowing a high S/N measurement of moderate clustering. Following Quadri et al. (2007), this value of r0 corresponds to stronger clustering than the dark matter at z = 3.1 by a bias factor b = 1.7+0.3 −0.4 . Note that bias factors are robust to the degeneracy between r0 and γ. This bias factor is shared by the population of dark matter halos with masses greater than log10 Mmin 10.6+0.5 −0.9 M (Sheth & Tormen 1999), implying a median dark matter halo mass of log10 Mmed = 10.9+0.5 −0.9 M . If 10% of the LAEs were unclustered low-redshift contaminants, the corrected value of r0 would be 10% higher, yielding halo masses ∼ 50% higher..
(4) 4. Gawiser et al.. The comoving number density of our LAE sample is 1.5 ± 0.3 × 10⁻³ Mpc−3 (Gronwall et al. 2007), where the uncertainty includes variance due to large-scale structure in our survey volume for objects with b = 1.7 (Somerville et al. 2004). The number density of the corresponding dark matter halos −2 −3 is 3+25 −2 × 10 Mpc , implying a “mean halo occupation” of +10 5−4.5 % for the LAEs. There is significant freedom in how the LAEs could be assigned to this subset of the available dark matter halos. However, the LAE median halo mass must roughly follow the result log10 Mmed = 10.9+0.5 −0.9 M in order to explain the observed clustering bias.15 Explorations of complex halo occupation distribution (HOD) models show that the assumption of one galaxy per halo made in our determination of Mmed can cause additional uncertainties of up to 0.2dex at z = 3.1,b = 1.7 (Lee et al. 2006; Zheng et al. 2007). 4. SED MODELLING. Lai et al. (2007b) offer a detailed description of our IRAC photometry along with single-component SED fitting of the detected and undetected objects and a comparison of their continuum properties with those of Lyman break galaxies. 76 of our LAEs fall within regions of the SIMPLE images (which include the GOODS IRAC images) where the lack of bright neighbors enables IRAC photometry accurate to very low fluxes. Only 24 LAEs (30%) are detected by IRAC at fluxes above the 2σ SIMPLE flux limit; these objects represent the high-mass end of the LAE mass function and appear to have stellar masses > 3 × 10⁹ M Only 2 of these LAEs are detected in our J, K images, which are two magnitudes shallower than the IRAC 3.6,4.5 µm images. The IRAC-detected LAEs are brighter in the rest-UV and rest-optical continuua, with mean R-band and 3.6µm fluxes corresponding to magnitude 25.4 and 24.4 respectively, compared with 26.7 and 26.6 for LAEs not detected by IRAC. In order to investigate the full SED of typical LAEs, which are too dim to be detected individually in our NIR and Spitzer images, we measured average fluxes from stacked images of the 52 LAEs (70%) lacking IRAC detections. We show the resulting SED in Fig. 4, where the V -band flux has been corrected for the contribution of the Lyα emission lines to this filter. Uncertainties in the stacked photometry were determined using bootstrap resampling to account for both sample variance and photometric errors. Instead of modelling LAEs with a single stellar population, we analyzed the extent to which the data allow the presence of an underlying evolved population. We adapted the method of K. Schawinski et al. (in prep.) to model the star formation histories using a two-burst scenario with the old component as an instantaneous burst and the young component as an exponentially declining starburst with variable e-folding time. Maraston (2005) population synthesis models were used with metallicity ranging from 0.02 solar to solar, a Salpeter (1955) initial mass function, and the Calzetti et al. (2000) dust law. The best-fit model shown in Fig. 4 corresponds to a stellar 9 −1 mass of 1.0+0.6 −0.4 × 10 M , star formation rate of 2 ± 1M yr , +0.1 and dust extinction AV = 0.0−0.0 (only positive values of AV were considered). Figure 5 shows the results for the age of the young population versus the mass fraction of the young population. The young population has an age of 20+30 −10 Myr with an e-folding timescale τ = 750 ± 250Myr i.e., a nearly 15 The quantity that must be preserved is the mean halo bias. The median halo mass is a simpler statistic that is also robust in typical HOD models, and the difference is far smaller than the reported uncertainties.. F IG . 4.— Datapoints show stacked flux densities ( fλ ) of LAEs lacking individual detections in the SIMPLE IRAC images, with 1σ error bars. The thick solid curve gives the best-fit model described in the text, which is a sum of a young component (dashed curve) and an old component (thin solid curve). Squares show fluxes predicted by the best-fit model, which has χ2 /d.o.f. = 14.6/12.. constant star formation rate. Although we did not include our narrow-band photometry in the SED analysis, the median LAE rest-frame equivalent width of 60Å found by Gronwall et al. (2007) is consistent with that expected for normal stellar populations in this age range (Finkelstein et al. 2007). The age of the old population is not well constrained but has a best fit of 2 Gyr (the age of the universe at z = 3.1).. F IG . 5.— Constraints on age of the young stellar population versus its mass fraction.. The mass fraction formed in the current starburst is not well constrained, and models where all of the stellar mass was produced in a current burst of star formation of age 60 to 350 Myr are allowed. Indeed, Lai et al. (2007b) performed a one-component SED fit with Maraston (2005) models and found a best-fit age of 100 Myr, τ =250 Myr, E(B-V)=0, and M∗ = 3 × 10⁸ M . Our two-component best-fit is preferred to this, even accounting for the two extra degrees of freedom, but a single “τ -model” population is not ruled out at 95% confi-.
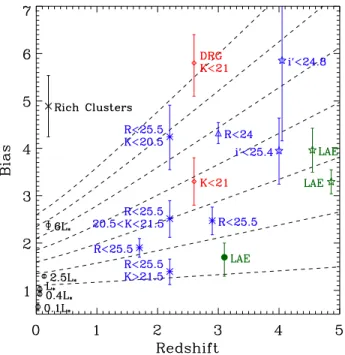
(5) L∗ Progenitors Experiencing Rapid Star Formation dence (see Fig. 5). 5. DISCUSSION. In CDM cosmology, galaxy formation is an ongoing process caused by merging of lower-mass dark matter halos, which may already possess stars. Finding stellar population ages of < 100 Myr is interesting. Our analysis of halo merger trees from the Milli-Millenium simulation (Springel et al. 2005) found the median age of dark matter halos with M> 1010.6 M at z = 3.1 (defined as the age since half of the dark matter mass was accumulated) to be ∼600 Myr, with only <10% of halos younger than 100 Myr. If repeated LAE phases occur, the mean halo occupation of ∼ 1–10% can be interpreted as a “duty cycle” telling us what fraction of each halo’s lifetime is spent in the early phases of starbursts before significant dust is generated, and the population-averaged young age of ∼20 Myr would imply that this phase typically lasts ∼40 Myr. Alternatively, if all dark matter halos experience a single LAE phase shortly after their “formation” in a major merger, the mean halo occupation implies that LAEs will only be found in the youngest 1–10% of halos, which is barely consistent with their single-population best-fit age of 100 Myr. If LAEs represent a subset of dark matter halos selected to have ages less than 100 Myr, their observed clustering may underestimate their dark matter halo masses by up to a factor of two (see Gao & White 2007).. F IG . 6.— Tracks show the evolution of bias with redshift calculated using the no-merging model. The filled circle shows our result for the bias of LAEs at z = 3.1. Previous results at high-redshift are shown for LAEs at z = 4.5 and z = 4.86 (stars, Kovač et al. 2007 and Ouchi et al. 2003, respectively), LBGs at z ∼ 4 (stars, Ouchi et al. 2004), K-selected galaxies (diamonds, Quadri et al. 2007), bright LBGs at z ∼ 3 (triangle, Lee et al. 2006), and BM, BX, and LBG galaxies (asterisks, Adelberger et al. 2005a, Adelberger et al. 2005b). Local galaxy clustering is shown for SDSS galaxies (open circles, Zehavi et al. 2005) and for rich clusters (cross, Bahcall et al. 2003). K-band limits are in Vega magnitudes.. Figure 6 shows the reported bias values for LAEs to be lower than those of other z > 3 galaxy populations (bias values determined as in Quadri et al. 2007). The expected evolution. 5. of bias is shown for the “no-merging” model (Fry 1996; White et al. 2007). A realistic amount of merging will cause the bias to drop somewhat faster, so the plotted trajectories provide an upper limit on the bias factor of a given point at lower redshifts. This shows that typical z = 3.1 LAEs will evolve into galaxies of at most a few times L∗ at z = 0. The bias values imply that LAEs at z = 3.1 might evolve into the subset of BX galaxies at z ' 2.2 dimmer than K = 21.5, which also show relatively weak clustering (Adelberger et al. 2005b). The K > 21.5 BX galaxies have average M∗ = 1.5 × 10¹⁰ M , so the z = 3.1 LAEs would need to form stars at an average rate of 14 M yr−1 over the intervening Gyr. This could be achieved with a constant specific SFR and no merging or with a constant SFR and ∼2 major mergers. The only previous measurements of LAE clustering in unbiased fields are at z = 4.5 (Kovač et al. 2007) and z = 4.86 (Ouchi et al. 2003), and this earlier LAE population appears to have significantly stronger clustering, consistent with possibly evolving into typical Lyman break galaxies at z ' 3. The models of Le Delliou et al. (2006) predict stellar and dark matter masses and star formation rates for z = 3 LAEs within a factor of two of our results, despite assuming a top-heavy IMF and a very low escape fraction fesc = 0.02 that appears inconsistent with the observed lack of dust (see Kobayashi et al. 2007, for an alternative approach). Mao et al. (2007) used the stellar mass of 5 × 10⁸ M observed by Gawiser et al. (2006a) to predict LAE dark matter masses of 1010 <M< 1011 M , in the lower end of our allowed range. The stellar ages of ∼ 20 Myr preferred by the two-population fit are noticeably lower than the maximum values of 100 to 500 Myr predicted by these authors, Mori & Umemura (2006), and Haiman & Spaans (1999), but the ages of 60 to 350 Myr preferred for the case of no evolved stars would be compatible. None of the current models and numerical simulations of LAEs (see also Thommes & Meisenheimer 2005; Razoumov & Sommer-Larsen 2006; Tasitsiomi 2006) predict their present-day descendants. Nonetheless, the evolution of a significant fraction of z = 3.1 LAEs into z = 0 L∗ galaxies with dark matter mass MDM ' 2 × 10¹² M and stellar mass M∗ ' 4 × 10¹⁰ M (Ichikawa et al. 2007) appears reasonable. Fig. 7 shows the histogram of present-day masses of dark matter halos in the Milli-Millenium merger trees that have progenitors with M> 5 × 10¹⁰ M at z = 3.1. The median present-day halo mass is 1.2 × 10¹² M , and this would increase if LAEs found in sub-halos of massive z = 3.1 halos were included. Li et al. (2007) predict that the main progenitor of a present-day L∗ galaxy had a dark matter mass of ∼ 1011 M at z = 3 and that these galaxies experienced several major mergers at 1.5 < z < 7. To form an L∗ galaxy at z = 0, several LAEs could merge while experiencing a mild reduction in average SFR, with accretion of lower-mass dark matter halos through minor mergers providing most of the final dark matter mass. However, the halo mass distribution of z = 0 descendants in Fig.7 is very broad, with 25th and 75th percentile values of 2.9 × 10¹¹ M and 7.6 × 10¹² M . While z = 0 L∗ galaxies like the Milky Way are roughly the median descendants of z = 3.1 LAEs, the descendant halos include a wide range from dwarf galaxies to rich galaxy groups. The typical LAE stellar mass at z = 3.1 is lower than that of any other studied high-redshift population (see Reddy et al. 2006) but is close to that of dim (i < 26.3) Lyman break galaxies (LBGs) at z ∼ 5 (Verma et al. 2007). LAEs at z = 3.1 have much lower star formation rate, stellar age, stellar mass, dark.
(6) 6. Gawiser et al.. F IG . 7.— Histogram of dark matter halo masses of present-day descendants of halos with M> 5 × 10¹⁰ M at z = 3.1. The dashed lines show the median halo mass of 1.2 × 10¹² M and the 25th and 75th percentile values of 2.9 × 10¹¹ M and 7.6 × 10¹² M .. matter halo mass, and dust extinction than the ∼ 30M yr−1 , ∼ 500 Myr, ∼ 2 × 10¹⁰ M , ∼ 3 × 10¹¹ M , AV ' 1 LBG population at z ∼ 3 (R < 25.5, Shapley et al. 2001; Adelberger et al. 2005b) or the ∼ 100M yr−1 , ∼ 2 Gyr, ∼ 1011 M , ∼ 1013 M , AV ' 2.5 Distant Red Galaxy (DRG) population (Webb et al. 2006; Förster Schreiber et al. 2004; Quadri et al. 2007). The high-redshift Sub-Millimeter Galaxies (Chapman et al. 2003) appear to be the most massive and dusty, with the highest SFR. LAEs may represent the beginning of an evolutionary sequence where galaxies gradually become more massive and dusty due to mergers and star formation, but most LAEs at z = 3.1 will never reach the DRG stage since DRG stellar and dark matter masses are already greater than those of present-day L∗ galaxies. The Damped Lyα Absorption systems (DLAs, Wolfe et al. 2005) are another high-redshift population that probes the faint end of the luminosity function. The dark matter halo masses of DLAs at z ∼ 3 were determined by Cooke et al.. (2006) to lie in the range 109 <M< 1012 M i.e., 1.3 < b < 4, which overlaps with the range of both L∗ and super-L∗ progenitors in Fig. 6. At least half of the DLAs appear to have ongoing star formation (Wolfe et al. 2004) and two of the three DLAs detected in emission were seen in Lyα. Further study is needed to determine the relationship between DLAs and LAEs. The observed properties of LAEs at z = 3.1 make them the most promising candidates to be high-redshift progenitors of present-day L∗ galaxies like the Milky Way. Our results suggest that LAEs are observed during the early phases of a burst of star formation, perhaps caused by a major merger of smaller dark matter halos. The input halos appear to have already contained stars, accounting for the evolved stellar population that appears to contribute most of the LAE stellar mass, although starburst-only models are also allowed. It is clear that not all progenitors of L∗ galaxies were LAEs at z = 3.1. The comoving number density of our sample of LAEs is a factor of 15 less than φ∗ for local galaxies (Lin et al. 1996), plus we expect several high-redshift halos to merge into a single galaxy today. It remains possible that all progenitors of present-day galaxies experienced an LAE phase at some redshift. Clustering and SED studies of LAEs at various redshifts are needed to assess the validity of this hypothesis. We acknowledge valuable conversations with Kyoung-Soo Lee, Jeff Newman, Ravi Sheth, David Spergel, Jason Tumlinson and Martin White. We are grateful for support from Fundación Andes, the FONDAP Centro de Astrofísica, and the Yale Astronomy Department. Support for this work was provided by NASA through an award issued by JPL/Caltech. This material is based upon work supported by the National Science Foundation under Grant. Nos. AST-0201667, an NSF Astronomy and Astrophysics Postdoctoral Fellowship (AAPF) awarded to E.G., and AST-0137927 awarded to R.C. We thank the staff of Cerro Tololo Inter-American Observatory and Las Campanas Observatory for their invaluable assistance with our observations. The Millenium Simulation databases used in this paper and the web application providing online access to them were constructed as part of the activities of the German Astrophysical Virtual Observatory. This research has made use of NASA’s Astrophysics Data System. Facilities:CTIO(MOSAIC II),LCO(IMACS). REFERENCES Adelberger, K. L., Erb, D. K., Steidel, C. C., Reddy, N. A., Pettini, M., & Shapley, A. E. 2005a, ApJ, 620, L75 Adelberger, K. L., Steidel, C. C., Pettini, M., Shapley, A. E., Reddy, N. A., & Erb, D. K. 2005b, ApJ, 619, 697 Alexander, D. M. et al. 2003, AJ, 126, 539 Arnaboldi, M., Aguerri, J. A. L., Napolitano, N. R., Gerhard, O., Freeman, K. C., Feldmeier, J., Capaccioli, M., Kudritzki, R. P., & Méndez, R. H. 2002, AJ, 123, 760 Bahcall, N. A., Dong, F., Hao, L., Bode, P., Annis, J., Gunn, J. E., & Schneider, D. P. 2003, ApJ, 599, 814 Calzetti, D., Armus, L., Bohlin, R. C., Kinney, A. L., Koornneef, J., & Storchi-Bergmann, T. 2000, ApJ, 533, 682 Castro Cerón, J. M., Michałowski, M. J., Hjorth, J., Watson, D., Fynbo, J. P. U., & Gorosabel, J. 2006, ApJ, 653, L85 Chapman, S. C., Windhorst, R., Odewahn, S., Yan, H., & Conselice, C. 2003, ApJ, 599, 92 Cooke, J., Wolfe, A. M., Gawiser, E., & Prochaska, J. X. 2006, ApJ, 652, 994 Cowie, L. L. & Hu, E. M. 1998, AJ, 115, 1319 Dawson, S. et al. 2004, ApJ, 617, 707 Dickinson, M., Giavalisco, M., & The Goods Team. 2003, in The Mass of Galaxies at Low and High Redshift, 324 Fazio, G. G. et al. 2004, ApJS, 154, 10. Finkelstein, S. L., Rhoads, J. E., Malhotra, S., Pirzkal, N., & Wang, J. 2007, ApJ, 660, 1023 Förster Schreiber, N. M. et al. 2004, ApJ, 616, 40 Fry, J. N. 1996, ApJ, 461, L65 Gao, L. & White, S. D. M. 2007, MNRAS, 377, L5 Gawiser, E. et al. 2006a, ApJ, 642, L13 —. 2006b, ApJS, 162, 1 Gronwall, C. et al. 2007, ApJ, 667, 79 Haiman, Z. & Spaans, M. 1999, ApJ, 518, 138 Hansen, M. & Oh, S. P. 2006, MNRAS, 367, 979 Hogg, D. W., Cohen, J. G., Blandford, R., & Pahre, M. A. 1998, ApJ, 504, 622 Hu, E. M., Cowie, L. L., Capak, P., McMahon, R. G., Hayashino, T., & Komiyama, Y. 2004, AJ, 127, 563 Hu, E. M., Cowie, L. L., & McMahon, R. G. 1998, ApJ, 502, L99 Hu, E. M. & McMahon, R. G. 1996, Nature, 382, 231 Ichikawa, T. et al. 2007, ArXiv:astro-ph/0701820 Infante, L. 1994, A&A, 282, 353 Kobayashi, M. A. R., Totani, T., & Nagashima, M. 2007, ApJ, in press, ArXiv:0705.4349 Kovač, K., Somerville, R. S., Rhoads, J. E., Malhotra, S., & Wang, J. 2007, ApJ, 668, 15.
(7) L∗ Progenitors Experiencing Rapid Star Formation Kudritzki, R.-P. et al. 2000, ApJ, 536, 19 Lai, K., Huang, J.-S., Fazio, G., Cowie, L. L., Hu, E. M., & Kakazu, Y. 2007a, ApJ, 655, 704 Lai, K. et al. 2007b, ApJ, submitted Landy, S. D. & Szalay, A. S. 1993, ApJ, 412, 64 Le Delliou, M., Lacey, C. G., Baugh, C. M., & Morris, S. L. 2006, MNRAS, 365, 712 Lee, K.-S., Giavalisco, M., Gnedin, O. Y., Somerville, R. S., Ferguson, H. C., Dickinson, M., & Ouchi, M. 2006, ApJ, 642, 63 Lehmer, B. D. et al. 2005, ApJS, 161, 21 Li, Y., Mo, H. J., van den Bosch, F. C., & Lin, W. P. 2007, MNRAS, 379, 689 Lin, H., Kirshner, R. P., Shectman, S. A., Landy, S. D., Oemler, A., Tucker, D. L., & Schechter, P. L. 1996, ApJ, 471, 617 Manning, C., Stern, D., Spinrad, H., & Bunker, A. J. 2000, ApJ, 537, 65 Mao, J., Lapi, A., Granato, G. L., de Zotti, G., & Danese, L. 2007, ApJ, 667, 655 Maraston, C. 2005, MNRAS, 362, 799 Matsuda, Y., Yamada, T., Hayashino, T., Yamauchi, R., & Nakamura, Y. 2006, ApJ, 640, L123 Mori, M. & Umemura, M. 2006, Nature, 440, 644 Neufeld, D. A. 1991, ApJ, 370, L85 Nilsson, K. K., Moeller, P., Moeller, O., Fynbo, J. P. U., Michalowski, M. J., Watson, D., Ledoux, C., Rosati, P., Pedersen, K., & Grove, L. F. 2007, A&A, 471, 71 Ouchi, M. et al. 2003, ApJ, 582, 60 —. 2004, ApJ, 611, 685 Peebles, P. J. E. 1980, The Large-Scale Structure of the Universe (Princeton, NJ: Princeton University Press) Pirzkal, N., Malhotra, S., Rhoads, J. E., & Xu, C. 2007, ApJ, 667, 49 Quadri, R. et al. 2007, ApJ, 654, 138 Razoumov, A. O. & Sommer-Larsen, J. 2006, ApJ, 651, L89 Reddy, N. A., Steidel, C. C., Erb, D. K., Shapley, A. E., & Pettini, M. 2006, ApJ, 653, 1004. 7. Rhoads, J. E. et al. 2003, AJ, 125, 1006 Salpeter, E. E. 1955, ApJ, 121, 161 Shapley, A. E., Steidel, C. C., Adelberger, K. L., Dickinson, M., Giavalisco, M., & Pettini, M. 2001, ApJ, 562, 95 Sheth, R. K. & Tormen, G. 1999, MNRAS, 308, 119 Simon, P. 2007, A&A, 473, 711 Somerville, R. S., Lee, K., Ferguson, H. C., Gardner, J. P., Moustakas, L. A., & Giavalisco, M. 2004, ApJ, 600, L171 Spergel, D. N. et al. 2007, ApJS, 170, 377 Springel, V. et. al. 2005, Nature, 435, 629 Stern, D., Bunker, A., Spinrad, H., & Dey, A. 2000, ApJ, 537, 73 Tasitsiomi, A. 2006, ApJ, 645, 792 Terlevich, R., Melnick, J., Masegosa, J., Moles, M., & Copetti, M. V. F. 1991, A&AS, 91, 285 Thommes, E. & Meisenheimer, K. 2005, A&A, 430, 877 Venemans, B. P. et al. 2005, A&A, 431, 793 Verma, A., Lehnert, M. D., Förster Schreiber, N. M., Bremer, M. N., & Douglas, L. 2007, MNRAS, 377, 1024 Virani, S. N., Treister, E., Urry, C. M., & Gawiser, E. 2006, AJ, 131, 2373 Webb, T. M. et al. 2003, ApJ, 582, 6 Webb, T. M. A. et al. 2006, ApJ, 636, L17 White, M., Zheng, Z., Brown, M. J. I., Dey, A., & Jannuzi, B. T. 2007, ApJ, 655, L69 Wolfe, A. M., Gawiser, E., & Prochaska, J. X. 2005, ARA&A, 43, 861 Wolfe, A. M., Howk, J. C., Gawiser, E., Prochaska, J. X., & Lopez, S. 2004, ApJ, 615, 625 Zehavi, I. et al. 2005, ApJ, 630, 1 Zheng, Z., Coil, A. L., & Zehavi, I. 2007, ApJ, 667, 760.
(8)
Figure
Documento similar
