Simulation of the hydraulic performance of Highway Filter Drains
1
through Laboratory Models and Stormwater Management Tools
2
3
Luis A. Sañudo-Fontaneda
1*, Daniel Jato-Espino
2, Craig Lashford
3and Stephen J.
4
Coupe
45
6
1 GICONSIME Research Group. Department of Construction and Manufacturing Engineering. University
7
of Oviedo. Polytechnic School of Mieres. Calle Gonzalo Gutierrez Quiros s/n. 33600, Mieres (Asturias).
8
Spain.
9
2 GITECO Research Group, Universidad de Cantabria, Av. de los Castros s/n, 39005, Santander, Spain.
10
3 School of Energy, Construction and Environment, Coventry University. George Eliot Building. Priory
11
Street. CV1 5FB. Coventry, UK.
12
4 Centre for Agroecology, Water and Resilience (CAWR), Coventry University, Ryton Gardens, Wolston
13
Lane, Ryton-on-Dunsmore, CV8 3LG, Coventry, UK.
14
15
*Corresponding author details: Email: sanudoluis@uniovi.es
16
17
Acknowledgements:
18
The laboratory research was part of a wider research project funded by the company Carnell Group Services
19
Ltd. Daniel Jato-Espino’s research internship at Coventry University and its participation in the research
20
that led to this article was jointly funded by the CAWR, Coventry University, and the Spanish Ministry of
21
Economy and Competitiveness through the research projects RHIVU (Ref. BIA2012-32463) and
SUPRIS-22
SUReS (Ref. BIA2015-65240-C2-1-R MINECO/FEDER, UE), financed by the Spanish Ministry of
23
Economy and Competitiveness with funds from the State General Budget (PGE) and the European Regional
24
Development Fund (ERDF). A further acknowledgement to XP Solutions for providing a licence to use
25
MicroDrainage®.
26
Abstract
28
Road drainage is one of the most relevant assets in transport infrastructure due to its inherent influence on
29
traffic management and road safety. Highway Filter Drains (HFD), also known as “French Drains”, are the
30
main drainage system currently in use in the UK throughout 7,000 km of its strategic road network. Despite
31
being a widespread technique across the whole country, little research has been done on their design
32
considerations and their subsequent impact on their hydraulic performance, representing a gap in the field.
33
Laboratory experiments have been proven to be a reliable indicator for the simulation of the hydraulic
34
performance of Stormwater Best Management Practices (BMPs). In addition to this, Stormwater
35
Management Tools (SMT) have been preferentially chosen as a design tool for BMPs by practitioners from
36
all over the world. In this context, this research aims to investigate the hydraulic performance of HFD by
37
comparing the results from laboratory simulation and two widely used SMT such as the US EPA’s
38
StormWater Management Model (SWMM) and MicroDrainage®. Statistical analyses were applied to a
39
series of rainfall scenarios simulated, showing a high level of accuracy between the results obtained in
40
laboratory and using SMT as indicated by the high and low values of the Nash-Sutcliffe and R2 coefficients
41
and Root Mean Square Error (RMSE) reached, which validated the usefulness of SMT to determine the
42
hydraulic performance of HFDs.
43
44
Keywords: Highway Filter Drains (HFD); Low Impact Development (LID); Rainfall-runoff simulation;
45
Sustainable Drainage Systems (SuDS); Transport Infrastructure; Water Sensitive Urban Design (WSUD).
46
1. Introduction
47
The UK has one of the densest road networks in Europe, consisting of nearly 1.8 km road/km2 land area
48
(Nicodeme et al. 2012) and more than 300 billion vehicle miles in 2014 (UK Department of Transports
49
2015). Hence, to ensure safety, road condition and environmental protection (Coupe et al. 2015), Filter
50
Drains (FDs) (Highway Filter Drains -HFDs- when used in Highways/Motorways), also known as “French
51
Drains”, have been implemented and maintained in 7,000 km of the UK’s Strategic Road Network (SRN).
52
HFDs catch the runoff, safely removing it from the carriageway, and treat the pollutants washed off from
53
the road whilst reducing the runoff peak-flow before discharging into natural watercourses downstream or
54
conventional drainage systems (Woods-Ballard et al. 2015).
55
The importance of FDs in other European countries outside Great Britain can be measured by the research
56
carried out in the Republic of Ireland by Bruen et al. (2006) and Desta et al. (2007), where more than 40%
57
of dual carriageways and motorways use FDs as their main drainage asset. Spain has also implemented the
58
use of FDs as a Sustainable Drainage System (SuDS) instead of a more conventional road technique as in
59
the UK, having achieved promising results as shown in Castro-Fresno et al. (2013), Andrés-Valeri et al.
60
(2014) and Sañudo-Fontaneda et al. (2014b).
61
Design considerations for Road FDs in the UK can be obtained from the “Design Manual for Roads and
62
Bridges” (DMRB-UK 2004). The manual specifies that highway drainage systems should be designed in
63
order to be fully capable of catching runoff produced by high-intensity rainfall events over a few minutes
64
with return periods between 1 and 5 years.
65
Despite the importance of HFD to drainage highways, there is little research carried out up to date.
66
Stylianides et al. (2016) focused on the study of Ground Penetration Radar (GPR) technologies to assess
67
HFD condition onsite. However, there was no relationship stablished between HFD condition and hydraulic
68
performance (infiltration rates and hydrographs, rainfall intensities, etc.). Coupe et al. (2015; 2016) pointed
69
out the need for developing both laboratory and field studies in order to identify the main variables affecting
70
HFD hydraulic performance. They also linked hydraulic performance with the structural performance of
71
HFDs. This study, alongside Sañudo-Fontaneda’s et al. (2016) first attempt to link stormwater management
72
tools with HFD hydraulic performance, was supported by and earlier research published by Ellis and
73
Rowlands (2007). They showed the importance of HFDs and identified the main problems affecting them
74
such as clogging due to sedimentation. No in depth relationship was established then between hydraulic
75
performance and clogging effects. Furthermore, Norris et al. (2013) found out that mechanisms involved
76
in pollution attenuation on SuDS gravel columns used as drainage systems in roads had been poorly
77
addressed so far, contributing to improve the understanding of their water quality performance. However,
78
other international researches undertaken on Stormwater Best Management Practices (BMP) similar to
79
HFD are available and support the identification of the main needs to advance research in this area. Thomas
80
et al. (2015), Haselbach et al. (2015) and Freimund et al. (2015) investigated the long-term water quality
81
performance of Media Filter Drain (MFD) in roads by means of accelerated tests in the laboratory. Witthoeft
82
et al. (2014) developed methods to assess the infiltration rates of BMPs used in roads, including HFDs.
83
Other works by Motsinger et al. (2016) and Bhattarai et al. (2009) focused on the water quality treatment
84
capacities of vegetated strips with similar structures than those of a HFD. Nevertheless, none of these
85
researches evaluated described the hydraulic performance of a HFD, studied its performance under different
86
rainfall intensities and storm durations and linked them to the results obtained by using stormwater
87
management tools.Laboratory experiments based upon the simulation of rainfall events and runoff volumes
88
have been successfully used across the world to model real and varying conditions in the field, including
89
the challenge induced by Climate Change (Golroo and Tighe 2012). This type of research based on
90
experimentation and heavily controlled surrounding conditions allow researchers simulating and modelling
91
the hydraulic performance of Stormwater Best Management Practices (BMPs), known as SuDS in the UK
92
(Fletcher et al. 2015), up to a high level of accuracy. There are many examples of successful researches
93
carried out to simulate the hydraulic performance of BMPs in laboratory. Research on Permeable Pavement
94
Systems (PPS) (Rodriguez-Hernandez et al. 2012; Sañudo-Fontaneda et al. 2013; Sañudo-Fontaneda et al.
95
2014c; Rodriguez-Hernandez et al. 2016; Huang et al. 2016) and grassed areas and green roofs (Deletic
96
2005; Alfredo et al. 2016) are some of the most commonly studied SuDS in the literature.
97
In order to investigate the hydraulic performance of HFD as a previous step before validating the results in
98
the field, laboratory models of HFD were developed and tested under varying scenarios of rainfall
99
intensities and storm durations. Further work was orientated towards the area of replicating the laboratory
100
conditions through stormwater simulations, with the aim of comparing the results achieved through them
101
with those obtained in laboratory. For this late purpose, computational programmes such as the US EPA’s
102
StormWater Management Model (SWMM) and MicroDrainage® were selected, due to their condition as
103
some of the most recognised tools for stormwater management design worldwide (Coupe et al. 2016;
104
Sañudo-Fontaneda et al. 2016). SWMM is one of the most used tools due to its particular characteristics
105
containing specific modules for the simulation of BMPs/SuDS, such as the Low Impact Development (LID)
106
Control Editor (Rossman 2010), where FDs are included as a technique. Moreover, SWMM is a free rainfall
107
and runoff-modelling tool available (Jato-Espino et al. 2016a; Sañudo-Fontaneda et al. 2016) and it allows
108
the simulation of small-scale watersheds (Lee et al. 2010; Niazi et al. 2017). As a demonstration of their
109
use to design and simulate BMPs, several researches have been conducted using SWMM as the stormwater
110
management design tool (Zhang and Duo 2015; Jato-Espino et al. 2016b), including some studies focused
111
on validating its application through both field (Rosa et al. 2015; Cipolla et al. 2016; Krebs et al. 2016) and
112
laboratory experiments (Palla and Gneco 2015). On the other hand, MicroDrainage® is the preferred
113
stormwater management drainage design tool in the UK industry, including specific modules that contain
114
SuDS (Hubert et al. 2013). FDs are therefore included as part of the package and their hydraulic
115
performance can be modelled under varying conditions of rainfall events and runoff volumes both in
116
SWMM and MicroDrainage®.
117
The main aim of the research presented in this article is, therefore, the investigation of the hydraulic
118
performance of HFD using both laboratory and modelling tools. This article intends to clarify the
119
understanding of HFD performance and support the use of stormwater management tools as part of research
120
methodologies, in order to promote their application to predict the potential impact of drainage systems
121
when designing urban water resources planning strategies. This later objective will need to be validated in
122
the field in future researches.
123
124
2. Materials and Methods
125
2.1. Materials used in the laboratory experiments
126
The material used in the laboratory simulations was obtained from real Type B aggregate of clean igneous
127
Granodiorite characteristics, which is used to refurbish highway FDs in the UK’s SRN, and therefore
128
complies with the UK Highways Agency Manual of Contract Documents for Highway Works (MCDH
129
2009) and BS EN 13242 requirements (BSI 2006). The Particle Size Distribution (PSD) of the aggregate is
130
shown in Table 1.
131
Table 1. PSD of the Type B aggregate used in the laboratory simulation and its comparison with the specifications in
132
the MCDH (2009) and BS EN 13242 (BSI 2006).
133
BS Sieve Size (mm) % Passing (Laboratory) % Passing (Specifications) 80 100 100 63 100 98 – 100 40 93 85 – 99 20 11 0 – 20 10 1 0 – 5134
2.2. Experimental methodology135
The experimental methodology of this research was divided into 3 main areas. Firstly, the experiments
136
carried out in the laboratory and the simulation methodology are described in detail. Secondly, the
137
stormwater design management tools used in the research are presented with the specific features utilised
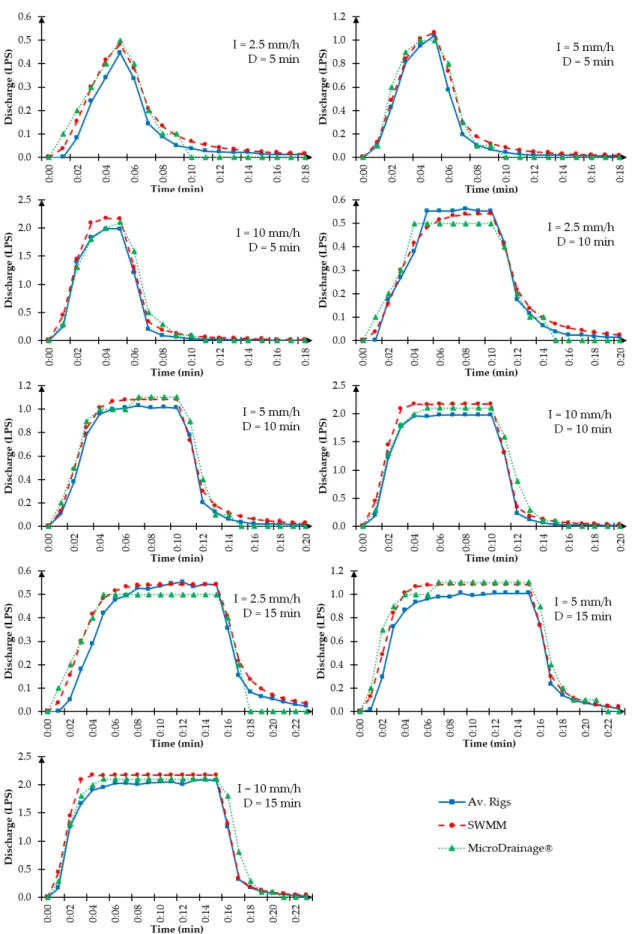
138
in the investigation. Finally, the statistical analyses that determine the accuracy of the comparison between
139
the results obtained in laboratory and the results produced by the simulations on the stormwater design tools
140
are delivered.141
142
2.2.1. Laboratory simulations143
Special rigs of 21.5 cm x 21.5 cm x 65.0 cm dimensions were tailored made out of plate-glass material for
144
visual analysis of the infiltration performance of the columns of gravel (see Figure 1). Four of these rigs
145
were used to obtain enough reliability in the subsequent statistical analyses.
146
The pipe that is usually installed in HFD was deliberately avoided in this study, in order to focus the analysis
147
on the hydraulic performance of the porous media represented by the standardised Type B aggregate. This
148
decision enables describing the physical equations underpinning the hydraulic processes in the HFD
149
accurately. The pipe that serves as an underdrain in HFDs is governed by different processes and it is
150
usually related to the Colebrook-White formula (Colebrook and White 1937). The Darcy’s law (Whitaker
151
1986) that acts as a framework for the hydraulic behaviour of porous media with the characteristics of the
152
materials used in the HFD (see Table 1) and under non-saturated conditions, which are typical of the
153
simulations carried out in this research, were applied under the assumption of steady-state flow through the
154
aggregate. Therefore, the physical performance beneath the whole infiltration process is defined by the
155
Navier-Stokes equations (Novak et al. 2010) due to the high void ratio (commonly over 40%) of the
156
material, which avoids saturation during the experiments (Sansalone et al. 2008; Charbeneau et al. 2010;
157
Rodriguez-Hernandez et al. 2012; Fontaneda et al. 2013; Fontaneda et al. 2014a;
Sañudo-158
Fontaneda et al. 2014c).
159
160
Fig. 1 Detail of the laboratory HFD model and the rainmaker.
161
The input parameters for this laboratory study were the rainfall intensities, storm durations and type of
162
aggregate utilised, whilst the output parameter was the infiltration rates and accumulated volumes described
163
by the hydrographs of performance. Infiltration rates were measured by collecting the outflow from the
164
experiments by using a sample collector underneath the laboratory rigs in periods of 1 minute during the
165
development of the test. Rainfall intensity was simulated by the use of a tailored made rainmaker. The
166
inflow was controlled at any time through the use of a flowmeter connected to a water intake and the
167
rainmaker. Every storm event was simulated by maintaining the same intensity thorough the whole
168
experiment for each rainfall intensity studied.
169
The hydraulic performance of FD was characterised through the simulation of 9 different storm scenarios
170
obtained from the combination of 3 high rainfall intensities (100, 200, 400 mm/h), with their correspondent
171
runoff flows in a highway, and 3 short-duration storm events (5, 10 and 15 minutes) as required in the
172
design criteria specified in the DMRB-UK (2004). Neither sediments nor pollutants were added to the
173
laboratory rigs used to replicate the gravel columns embedded in the HFD in order to avoid the disturbance
174
on the hydraulic performance of the gravel that conforms the HFD. Therefore, just tap water was used in
175
the experiments.
176
Sañudo-Fontaneda et al. (2016) partially described the relation between the simulation of direct rainfall
177
over the rigs and their correspondence with the runoff volume reaching the FD from the carriageway for
178
the very same rainfall intensity. This process of early comparison is required to understand the subsequent
179
modelling of the 9 scenarios in the stormwater design management tools, because it will influence the
180
receiving area of the direct rainfall and the receiving area of the runoff produced by it, which are entirely
181
different. In order to clarify the calculations, the use of the Rational Method for small catchments (Nash
182
1958), which fits perfectly the description of a transport infrastructure such as a road (Woods-Ballard et al.
183
2016; DMRB-UK 2004), was selected as the equation to control the transformation from rainfall intensity,
184
raining down over a certain area, into runoff volume entering the FD (Coupe et al. 2016; Sañudo-Fontaneda
185
et al. 2016). Under these premises, Table 2 has been prepared to understand the transformation from the
186
volumes of direct rainfall and the volumes of runoff for a contribution area defined by 2 carriageways of
187
3.0 m width and a hard-shoulder of 1.8 m width. Since the length of the laboratory-simulated rigs was 0.215
188
m, this contribution area amounted up to 1.677 m2.
189
Table 2. Surface runoff flow for a 100 m length HFD produced by the simulated rainfall events for a contribution area
190
consisting on 2 carriageways and a hard-shoulder (7.8 m width).
191
Rainfall intensity directly simulated over the
laboratory rigs (mm/h)
Flow simulated over the laboratory models for the
rig’s surface (0.046 m2)
(L/min)
Equivalent rainfall intensity for the flow simulated, having a contribution area defined by the 2 carriageways + hard
shoulder (1.677 m2) (mm/h) 100 0.070 2.5 200 0.140 5 400 0.280 10
192
The application of the Rational Method (Woods-Ballard et al. 2016; DMRB-UK 2004) considering the flow
193
simulated over the laboratory models as the runoff volume discharged from a contribution area of 1.677m2
194
enabled the direct rainfall simulated over the rigs to be translated into the direct rainfall corresponding to
195
the real length of 2 carriageways and a hard-shoulder, which are a common standard in UK highways.
196
Therefore, the last column in Table 2 provides the values of that rainfall intensity (2.5, 5 and 10 mm/h),
197
which are considered of great interest for road designers as they are representative of common rainfall event
198
in the West Midlands, the area of the UK where the research was conducted. In addition, a rainfall event of
199
10 mm/h and 15 minutes of storm duration corresponds to 11 months of return period in the West Midlands
200
(Alfredo et al. 2010), achieving the year of return period required for the FD to cope with the design rainfall
201
event and runoff volume specified by the DRMB-UK (2004).
202
203
2.2.2. Stormwater Design Management Tools
204
The same rainfall scenarios described in the laboratory experiments were simulated both in the Stormwater
205
Management Model (SWMM) and MicroDrainage®. SWMM is a widely used rainfall-runoff piece of
206
software that simulates diverse phenomena associated with urban hydrology: continuous and discrete storm
207
events, runoff generation, water routing, overflow discharge and reservoir storage (Huber et al. 1988).
208
Furthermore, it enables modelling the impact of different SuDS on water quantity and quality through its
209
LID Control Editor (Rossman 2010). Although HFD are not explicitly included among them, they can be
210
assimilated to infiltration trenches, which are one of the eight types of SuDS available in SWMM.
211
The scaled laboratory conditions were replicated in SWMM by defining a sub-catchment of 0.078 ha (100
212
m length by 7.8 m width), which represented the contributing area flowing to the HFD. Three different
213
uniform storms were designed to simulate the equivalent rainfall intensities listed in Table 2, including a
214
1-minute time step to reproduce the real-time testing used in laboratory. Moreover, the cross-section of the
215
HFD was characterized through a 650 mm thick layer with a porosity of 0.4. The seepage rate was set at 0,
216
since this parameter concerns the infiltration capability of the soil below the HFD. All these parameters
217
were fixed by both the characteristics of the materials and the conditions under which the laboratory tests
218
were conducted. Hence, the only parameters which were variable and, therefore, subject to calibration were
219
those referred to the drain system of the rigs. None of the specifications included in the SWMM “Drain
220
Advisor”, which consider the existence of impermeable bottoms, slotted pipes or fully saturation, replicated
221
the outflow conditions of the tests. Drain systems are characterized in SWMM through two parameters:
222
flow coefficient and flow exponent. These parameters are performance-based rather than design-based and
223
its combination determines the height above the bottom of the LID unit storage layer and how its volumetric
224
flow rate varies with the height of saturated media above it (Rossman 2010). The calibration of simulations
225
proved that a ratio 1:6 ratio between flow exponent and flow coefficient provided the best fit to the drain
226
characteristics of the test rigs. In particular, the best fit for the flow exponent was found to be in the range
227
of 1 and 3, from more to less conservative. The results of the calibration demonstrated that a flow exponent
228
of 1.75 and a flow coefficient of 10.50 was the best combination to keep a balance between conservatism
229
and accuracy.
230
The DrawNet suite within MicroDrainage®, which is the UK industry standard drainage modelling tool,
231
was also used to simulate the HFD (Hubert et al. 2015; Lashford et al. 2014). The software enabled the
232
design and simulation of both piped and SuDS drainage systems, which included the modelling of a HFD.
233
The HFD was designed using the equivalent parameters and contributing area as used in SWMM. Each
234
design storm was subsequently simulated in the software package, based on the rainfall monitored in the
235
laboratory, and the outputs compared to evaluate the performance of the FD.
236
In a second step, the results were scaled up from 0.215 up to a 100 m length, in order to be ready for
237
comparison with the results obtained from the management tools, which have the limitation of not providing
238
results for very small catchments like the one simulated in the laboratory. The flow values obtained at the
239
discharge point of the FD are shown below in Table 3 and were obtained after applying the Rational Method
240
for small catchments (Woods-Ballard et al. 2016; DMRB-UK 2004).
241
Table 3. Runoff flow value calculated as the volume of runoff entering the simulated 100 m length FD from the
242
equivalent contribution area consisting on the 2 carriageways and the hard-shoulder (7.8 m width).
243
Rainfall intensity raining down the equivalent contribution area scaled up to 100 m length of FD and 2 carriageways + hard shoulder (780
m2)
(mm/h)
Surface runoff volume produced by the intensities raining over the equivalent contribution area considered in the first column
(L/s)
5 1.09
10 2.17
244
2.2.3. Statistical analyses
245
Three goodness-of-fit coefficients were considered to validate the accuracy of the comparison between the
246
laboratory simulations and the results obtained from the modelling of the same 9 scenarios using SWMM
247
and MicroDrainage®. This course of action was in line with the recommendations made by Jain and
248
Sudheer (2008), who suggested that the use of a sole goodness-of-fit measure can be misleading. Therefore,
249
the Nash-Sutcliffe (Nash and Sutcliffe 1970) and the R2 (Hirsch et al. 1993) coefficients and the Root Mean
250
Square Error (RMSE) (Chai and Draxler 2014) were chosen for their reliability in previous researches. In
251
addition, inferential statistical techniques were applied to verify the absence of differences between the
252
hydrographs obtained for both the laboratory and computer models. Thus, parametric (known distribution)
253
or non-parametric (unknown distribution) tests were used depending on whether the hydrographs followed
254
normal distributions or not, according to the Shapiro-Wilk test (Shapiro et al. 1965). A significance level
255
of 0.05 was chosen for statistical testing.
256
257
3. Results and Discussions
258
The results of all experiments carried out in the laboratory models and the simulations developed in the
259
stormwater management tools (SWMM and MicroDrainage®) are presented and discussed in this point.
260
The main areas for the interpretation and discussion of these results are the hydrographs of performance
261
obtained from the laboratory simulations and the design tools. Finally, the results from the statistical
262
analyses are described and discussed as a support for the hydrographs of performance.
263
264
3.1. Hydraulic characterisation of the FD in the laboratory
265
The characterization of the performance of FD was carried out through the laboratory simulation of the
266
different 9 storm scenarios, so that each scenario is represented by the hydrographs obtained as a result of
267
the outflows measured beneath the laboratory rigs in periods of 1 minute.
268
The average hydrographs obtained from the rigs tested in laboratory (Av. Rigs) were compared with those
269
determined from the simulations of the 9 different storm scenarios with the SWMM and the
270
MicroDrainage® tools as represented in Figure 2, dividing the analysis of the hydrographs into the three
271
different storm event durations (5, 10 and 15 minutes). The mere visual inspection of these plots
272
demonstrated the excellent fit between the hydrographs obtained in laboratory and those determined using
273
stormwater tools. Furthermore, the simulations run with SWMM and MicroDrainage® resulted in more
274
conservative hydrographs generally (slight overestimation of the discharge of HFD), which involves being
275
on the safe side in terms of design.
276
277
Fig. 2 Hydrographs for a 100 m length HFD extrapolated from the results obtained for the laboratory models
278
3.2. Statistical analyses
280
The statistical analyses include the main coefficients that allow to determine the validity of the models
281
obtained using the SMT through their comparison with the laboratory simulations. For this reason, the
282
Nash-Sutcliffe and R2 coefficients and the Root Mean Squared Error (RMSE) were calculated for all the
283
different scenarios of rainfall as shown in Table 4. Overall, the results revealed that the higher the rainfall
284
intensity, the better the level of accuracy of the laboratory models in comparison with the simulations
285
obtained in SWMM and MicroDrainage®.
286
The Nash-Sutcliffe coefficients validated the methodology showing very high values in the region of 0.88
287
and 0.99 for both SWMM and MicroDrainage® when comparing them with the laboratory simulations.
288
The R2 coefficient reached high values as well, being always above 0.97 in all storm scenarios simulated
289
with both design management tools. Furthermore, the values of RMSE achieved were generally below 10%
290
of the discharge peaks for both SWMM and MicroDrainage®, which ensured that the differences in the
291
amount of volume produced between the laboratory and computer hydrographs were minimal.
292
Table 4. Statistical analyses conducted using the Nash-Sutcliffe and R2 coefficients and the RMSE
293
Goodness-of-fit measure Stormwater Management Tool (SMT)Storm duration (minutes)
5 10 15 Rainfall Intensity (mm/h) 2.5 5 10 2.5 5 10 2.5 5 10 Nash-Sutcliffe Coefficient SWMM 0.92 0.97 0.98 0.98 0.98 0.97 0.95 0.96 0.97 MicroDrainage® 0.86 0.95 0.97 0.95 0.97 0.97 0.92 0.91 0.97 R2 Coefficient SWMM 0.98 0.99 1.00 0.99 1.00 1.00 0.97 0.99 0.99 MicroDrainage® 0.94 0.97 0.97 0.96 0.98 0.98 0.92 0.96 0.98
Root Mean Square Error (RMSE)
SWMM 0.04 0.06 0.11 0.03 0.06 0.15 0.05 0.09 0.15
MicroDrainage® 0.05 0.08 0.13 0.05 0.08 0.17 0.06 0.13 0.17
294
The hydrographs illustrated in Figure 2 were evaluated using statistical techniques, in order to validate the
295
absence of differences between the laboratory and computer results. Almost all the p-values obtained after
296
checking normality for the datasets behind the hydrographs were below 0.05, which suggested that the
297
samples under study had to be analysed using non-parametric tests.
298
Therefore, the Kruskal-Wallis test was applied to check the hypothesis that the three types of hydrographs
299
(Av. Rigs, SWMM and MicroDrainage®) were not significantly different. The p-values shown in Table 5
300
confirmed this hypothesis, since they were above the significance level in all cases. Consequently, the
301
Mann-Whitney test was used to prove the similarity between hydrographs derived from the laboratory and
302
computer simulations, as well as that between the results obtained with SWMM and MicroDrainage®.
303
Again, the values listed in Table 5 in relation to this test demonstrated that the differences in each pairwise
304
comparison were not significant (p-values>0.05). In overall terms, these results proved the high accuracy
305
of computer-based models to replicate the hydraulic performance of HFDs as tested in laboratory.
306
Table 5. Non-parametric comparative analysis of the hydrographs obtained for the laboratory and computer models
307
Storm scenario Kruskal-Wallis Mann-Whitney Storm duration (minutes) Rainfall Intensity (mm/h) Av. Rigs*SWMM* MicroDrainage® Av. Rigs* SWMM Av. Rigs* MicroDrainage® SWMM* MicroDrainage® 5 2.5 0.300 0.231 0.423 0.204 5 0.223 0.343 0.204 0.148 10 0.349 0.226 0.470 0.257 10 2.5 0.663 0.880 0.447 0.440 5 0.667 0.263 0.870 0.695 10 0.336 0.162 0.649 0.312 15 2.5 0.327 0.503 0.460 0.129 5 0.169 0.087 0.153 0.419 10 0.077 0.057 0.202 0.102
308
4. Conclusions
309
The main conclusions reached in this research conducted as an international collaborative effort are as
310
follows:
311
• Laboratory simulations have proven to be an accurate tool to determine the hydraulic performance
312
of FDs under varying scenarios represented by a varying range of rainfall intensities and storm
313
durations.
314
• The use of stormwater design management tools can be validated through the models of
315
performance obtained in the laboratory experiments to provide decision-makers with an accurate
316
and reliable means of estimating the potential impact of FDs on urban drainage.
317
• The methodology presented in this article has been validated through the comparison of
318
laboratory-simulated experiments, stormwater design management tools using statistical analyses,
319
including the Nash-Sutcliffe and R2 coefficients and the Root Mean Square Error (RMSE).
320
• Small-scale laboratory simulation models require to be scaled-up adequately by using the
321
appropriate mathematical equations, in order to be realistic and to be adapted to real scenarios of
322
rainfall and real contribution areas.
323
As a final conclusion to this article, the authors of this research would like to indicate the future research
324
lines that are recommended to achieve full validation of these models in the field.
325
• A full-scale study in the field is recommended to further validate the models obtained in the
326
laboratory simulations and the results achieved using SWMM and MicroDrainage®.
327
• A full-scale study where important parameters such as the flow of water entering the FD and the
328
real contribution area are fully monitored is recommended, in order to not lose the potential for
329
comparison with the models obtained in this research. The heterogeneity of conditions in the field
330
required the isolation of parameters and variables that may disturb the comparisons and, therefore,
331
they may inadequately describe the scenario and would be not acceptable for comparison and/or
332
application of the models obtained in laboratory and through the management tools.
333
334
335
References
336
Alfredo K, Montalto F, Goldstein A (2010) Observed and modelled performances of prototype green roof
337
test plots subjected to simulated low- and high-intensity precipitations in a laboratory experiment. Journal
338
of Hydrologic Engineering 15(6), 011006QHE, 444-457. doi: 10.1061/(ASCE)HE.1943-5584.0000135
339
Andrés-Valeri VCA, Castro-Fresno D, Sañudo-Fontaneda LA, Rodriguez-Hernandez J (2014)
340
Comparative analysis of the outflow water quality of two sustainable linear drainage systems. Water
341
Science and Technology 70(8): 1341-1347. doi: 10.2166/wst.2014.382
342
Bhattarai, R., Kalita, P.K., Patel, M.K. (2009). Nutrient transport through a Vegetative Filter Strip with
343
subsurface drainage. Journal of Environmental Management 90(5), pp. 1868-1876. doi:
344
10.1016/j.jenvman.2008.12.010
345
British Standards Institution (BSI). BS EN 13242: Aggregates for unbound and hydraulically bound
346
materials for use in civil engineering work and road construction. London: BSI, UK, 2006.
347
Bruen M, Johnston P, Quinn MK, Desta M, Higgins N, Bradley C, Burns S. Impact Assessment of Highway
348
Drainage on Surface Water Quality. Report prepared for the Environmental protection Agency by the
349
Centre for Water Resources Research, University College Dublin, Republic of Ireland, 2006.
350
Castro-Fresno D, Andrés-Valeri VC, Sañudo-Fontaneda LA, Rodriguez-Hernandez J (2013) Sustainable
351
drainage practices in Spain, specially focused on pervious pavements. Water (Switzerland) 5(1): 67-93. doi:
352
10.3390/w5010067
353
Chai T, Draxler RR (2014) Root mean square error (RMSE) or mean absolute error (MAE)? - Arguments
354
against avoiding RMSE in the literature. Geoscientific Model Development 7(3):1247-1250. doi:
355
10.5194/gmd-7-1247-2014
356
Charbeneau RJ, Klenzendorf JB, Barrett ME (2010) Methodology for determining laboratory and in situ
357
hydraulic conductivity of asphalt permeable friction course. Journal of Hydraulic Engineering
137(1):15-358
22. doi: 10.1061/(ASCE)HY.1943-7900.0000252
359
Colebrook, C. F. and White, C. M. (1937). «Experiments with Fluid Friction in Roughened
360
Pipes». Proceedings of the Royal Society of London. Series A, Mathematical and Physical Sciences
361
161 (906): 367-381.
Coupe SJ, Sañudo-Fontaneda LA, Charlesworth SM, Rowlands EG (2015) Research on novel highway
363
filter drain designs for the protection of downstream environments. SUDSnet International Conference,
364
Coventry, UK, 2015. http://sudsnet.abertay.ac.uk/downloads.htm. Accessed 30 December 2016
365
Coupe SJ, Sañudo-Fontaneda LA, McLaughling A-M, Charlesworth SM, Rowlands EG (2016) The
366
retention and in-situ treatment of contaminated sediments in laboratory highway filter drain models. 4th
367
Annual Water Efficiency Conference, Coventry, UK.
368
https://www.watefnetwork.co.uk/files/default/resources/Conference2016/Session_One/45-COUPE.pdf.
369
Accessed 30 December 2016
370
Deletic A (2005) Sediment transport in urban runoff over grassed areas. Journal of Hydrology
301(1-371
4):108-122. doi: 10.1016/j.jhydrol.2004.06.023.
372
Desta MB, Bruen M, Higgins N, Johnston P (2007). Highway runoff quality in Ireland. Journal of
373
Environmental Monitoring 9:366-371, doi: 10.1039/B702327H.
374
DMRB-UK (2004). Design Manual for Roads and Bridges: Geotechnics and Drainage. Vol. 4, sec. 2, part
375
1. (HA 106/04). Drainage of runoff from natural catchments. Technical Report, Highways Agency, UK.
376
Ellis JB, Rowlands EG (2007) Highway filter drain waste arisings: A challenge for urban source control
377
management? Water Science and Technology 56(10):125-131. doi: 10.2166/wst.2007.743
378
Fletcher TD, Shuster W, Hunt, WF, Ashley R, Butler D, Arthur S, Trowsdale S, Barraud S,
Semadeni-379
Davies A, Bertrand-Krajewski J.-L, Mikkelsen PS, Rivard G, Uhl M, Dagenais D, Viklander M (2015)
380
SUDS, LID, BMPs, WSUD and more – The evolution and application of terminology surrounding urban
381
drainage. Urban Water Journal 12(7):525-542. doi: 10.1080/1573062X.2014.916314
382
Freimund, M., Haselbach, L., Poor, C., Thomas, A. (2015). Modified media filter drain mix with alternate
383
aggregate grading. Innovative Materials and Design for Sustainable Transportation Infrastructure - Selected
384
Papers from the International Symposium on Systematic Approaches to Environmental Sustainability in
385
Transportation pp. 143-153. doi: 10.1061/9780784479278.014
386
Golroo A., Tighe SL (2012) Pervious concrete pavement performance modeling: An empirical approach in
387
cold climates. Canadian Journal of Civil Engineering 39(10):1100-1112. doi: 10.1139/l2012-088.
388
Haselbach, L.M., Rath, J.R., Werner, B. (2015). Extended performance of media filter drains: Existing
389
media. International Low Impact Development Conference 2015 - LID: It Works in All Climates and Soils
390
- Proceedings of the 2015 International Low Impact Development Conference pp. 304-311. doi:
391
10.1061/9780784479025.031
392
Huang J, He J, Valeo C, Chu A (2016) Temporal evolution modeling of hydraulic and water quality
393
performance of permeable pavements. Journal of Hydrology 533:15-27. doi:
394
10.1016/j.jhydrol.2015.11.042.
395
Hirsch RM, Helsel DR, Cohn TA, Gilroy EJ (1993) Statistical Analysis of Hydrologic Data, in: D.R.
396
Maidment (Ed.), Handbook of Hydrology, McGraw-Hill, New York (U.S.), pp. 1-55.
397
Motsinger, J., Kalita, P., Bhattarai, R. (2016). Analysis of best management practices implementation on
398
water quality using the Soil and Water Assessment Tool. Water (Switzerland) 8(4), 145. doi:
399
10.3390/w8040145
400
Huber WC, Dickinson RE (1988) Storm Water Management Model, Version 4, U.S. Environmental
401
Protection Agency, Cincinatti, (U.S.).
402
Hubert J, Edwards T, Jahromi BA (2013) Comparative study of sustainable drainage systems. Engineering
403
sustainability 166 (ES3):138-149. doi: 10.1680/ensu.11.00029.
404
Jain SK, Sudheer KP (2008) Fitting of hydrologic models: A close look at the Nash-Sutcliffe index. Journal
405
of Hydrologic Engineering 13:981-986. doi: 10.1061/(ASCE)1084-0699(2008)13:10(981)
406
Jato-Espino D, Andrés-Valeri VC, Sañudo-Fontaneda LA, Castro-Fresno D, Rodriguez-Hernandez J,
407
Charlesworth SM (2016a) Analysis and implementation of sustainable drainage practices under Spain’s
408
oceanic climate conditions. 4th Annual Water Efficiency Conference, Coventry, UK.
409
https://www.watefnetwork.co.uk/files/default/resources/Conference2016/Session_Seven/59-JATO-410
ESPINO-1.pdf. Accessed 30 December 2016
411
Jato-Espino D, Charlesworth SM, Bayon JR, Warwick F (2016b) Rainfall-runoff simulations to assess the
412
potential of SuDS for mitigating flooding in highly urbanized catchments. International Journal of
413
Environmental Research and Public Health 13, 149. doi: 10.3390/ijerph13010149
414
Lashford C, Charlesworth S, Warwick F, Blackett M. (2014). Deconstructing the sustainable drainage
415
management train in terms of water quantity - preliminary results for Coventry, UK. Clean - Soil, Air,
416
Water 42 (2):187-192. doi: 10.1002/clen.201300161
417
Lee S-B, Yoon C-G, Jung KW, Hwang HS (2010) Comparative evaluation of runoff and water quality
418
using HSPF and SWMM. Water Science and Technology 62(6):1401-1409. doi: 10.2166/wst.2010.302
419
MCDH (2009). Manual of Contract Documents for Highway Works. Volume 1 - Specification for Highway
420
Works. Series 500: Drainage and Service Ducts. Highways Agency, UK.
421
Nash JE (1958) Determining run-off from rainfall. Proceedings of the Institution of Civil Engineers 10:
422
163-184.
423
Nash JE, Sutcliffe JV (1970) River flow forecasting through conceptual models part I – A discussion of
424
principles. Journal of Hydrology 1970 10 (3), 282-290. doi: 10.1016/0022-1694(70)90255-6
425
Nicodeme C, Diamandouros K, Diez J, Durso C, Brecx C, Metushi S (2013) European Union Road
426
Federation. European Road Statistics 2012.
427
Report. http://www.erf.be/images/Statistics/ER_Statistics_Final_2012.pdf.
Accessed 30 December
428
2016
429
Norris, M.J., Pulford, I.D., Haynes, H., Dorea, C.C., Phoenix, V.R. (2013). Treatment of heavy metals by
430
iron oxide coated and natural gravel media in Sustainable urban Drainage Systems. Water Science and
431
Technology 68(3), pp. 674-680. doi: 10.2166/wst.2013.259
432
Novak P, Guinot V, Jeffrey A, Reeve DE (2010) Hydraulic Modelling - an Introduction: Principles,
433
Methods and Applications, Spon Press, New York (U.S.), pp. 84. ISBN 0-203-86162-0.
434
Rodriguez-Hernandez J, Andrés-Valeri VC, Ascorbe-Salcedo A, Castro-Fresno D (2016) Laboratory study
435
on the stormwater retention and runoff attenuation capacity of four permeable pavements. Journal of
436
Environmental Engineering (United States) 142(2). doi: 10.1061/(ASCE)EE.1943-7870.0001033
437
Rodriguez-Hernandez J, Castro-Fresno D, Fernández-Barrera AH, Vega-Zamanillo Á (2012)
438
Characterization of Infiltration Capacity of Permeable Pavements with Porous Asphalt Surface Using
439
Cantabrian Fixed Infiltrometer. Journal of Hydrologic Engineering 17 (5):597-603. doi:
440
10.1061/(ASCE)HE.1943-5584.0000480
441
Rossman, L. (2010) Storm Water Management Model User's Manual - Version 5.0 (No.
EPA/600/R-442
05/040). Cincinnati (U.S.): U.S. Environmental Protection Agency.
443
Sansalone J, Kuang X, Ranieri V. (2008) Permeable pavement as a hydraulic and filtration interface for
444
urban drainage. Journal of Irrigation and Drainage Engineering 134(5):666-674. doi:
445
10.1061/(ASCE)0733-9437(2008)134:5(666)
446
Sañudo-Fontaneda LA, Andrés-Valeri VCA, Rodriguez-Hernandez J, Castro-Fresno D (2014a) Field study
447
of infiltration capacity reduction of porous mixture surfaces. Water (Switzerland) 2014a, 6(3):661-669. doi:
448
10.3390/w6030661
449
Sañudo-Fontaneda LA, Charlesworth S, Castro-Fresno D, Andrés-Valeri VCA, Rodriguez-Hernandez J
450
(2014b) Water quality and quantity assessment of pervious pavements performance in experimental car
451
park areas. Water Science and Technology 69(7):1526-1533. doi: 10.2166/wst.2014.056
452
Sañudo-Fontaneda LA, Jato-Espino D, Lashford C, Coupe S (2016) Investigation of the design
453
considerations for Highway Filter Drains through the comparison of stormwater management tools with
454
laboratory simulation experiments. 9th International Conference NOVATECH: Planning & technologies
455
for Sustainable Urban Water Management. Lyon, France, 2016.
456
http://www.novatech.graie.org/a_progr_sessions.php#A1. Accessed 30 December 2016
457
Sañudo-Fontaneda LA, Rodriguez-Hernandez J, Calzada-Pérez MA, Castro-Fresno D (2014c) Infiltration
458
behaviour of polymer-modified porous concrete and porous asphalt surfaces used in SuDS techniques.
459
Clean - Soil, Air, Water 42(2):139-145. doi: 10.1002/clen.201300156.
460
Sañudo-Fontaneda LA, Rodriguez-Hernandez J, Vega-Zamanillo A, Castro-Fresno D (2013) Laboratory
461
analysis of the infiltration capacity of interlocking concrete block pavements in car parks. Water Science
462
and Technology 67(3):675-681. doi: 10.2166/wst.2012.614.
463
Shapiro SS, Wilk MB (1965) An analysis of variance test for normality, Biometrika 52(3-4):591-611. doi:
464
10.2307/2333709
465
Stylianides, T., Frost, M.W., Fleming, P.R., Mageean, M., Huetson, A. (2016). A Condition Assessment
466
Approach for Highway Filter Drains Using Ground Penetrating Radar. Procedia Engineering 143,
1226-467
1235. doi: 10.1016/j.proeng.2016.06.108
468
Thomas, A., Haselbach, L., Poor, C., Freimund, M. (2015). Long-term metal retention performance of
469
media filter drains for stormwater management. Sustainability (Switzerland) 7(4), pp. 3721-3733. doi:
470
10.3390/su7043721
471
UK Department of Transports (2015). National Road Traffic Survey.
472
https://www.gov.uk/government/statistical-data-sets/tra01-traffic-by-road-class-and-region-miles.
473
Accessed 30 December 2016
474
-22-
Whitaker S (1986) Flow in porous media I: A theoretical derivation of Darcy's law. Transport in Porous
475
Media 1(1): 3-25. doi: 10.1007/BF01036523.
476
Witthoeft, A.F., Conkle, C.S., Stern, A. (2014). Techniques for in situ evaluation of stormwater infiltration
477
rate. Geotechnical Special Publication (234 GSP), pp. 3432-3443. doi: 10.1061/9780784413272.333
478
Woods-Ballard B, Wilson S, Udale-Clark H, Illman S, Ashley R, Kellagher R (2015) The SuDS manual.
479
CIRIA 753. CIRIA, London, UK, pp. 968. ISBN 979-0-86017-760-9.
480
Zhang S, Guo Y (2015) SWMM simulation of the Storm Water volume control performance of permeable
481
pavement systems. Journal of Hydrologic Engineering 20(8), 06014010. doi:
10.1061/(ASCE)HE.1943-482
5584.0001092