Conservation of otter (Lutra lutra) in a Mediterranean
area: the importance of habitat quality and temporal
variation in water availability
José Prenda
1, Pedro López-Nieves
2and Rafael Bravo
31
Departamento de Biología Ambiental y Salud Pública, Facultad de Ciencias
Experimentales, Universidad de Huelva, Campus Universitario de La Rábida,
21819-Palos de la Frontera, Huelva, Spain. E-mail: jprenda@uhu.es 2
I.E.S. Los Pedroches, Departamento de Biología y Geología, Avda. Marcos
Redondo s/n, 14400-Pozoblanco, Córdoba, Spain. E-mail: plnieves@olemail.com 3
Abstract
1. This study analyses quantitatively the association between habitat
characteristics and annual variation in water availability on otter (Lutra lutra L.)
distribution in a large Mediterranean area (13717 km2) in southern Spain
2. There was a strong positive correlation between habitat quality, estimated after
the two first components of a Principal Component Analysis of a matrix habitat
variables x sites, and an index of otter presence/absence, otter presence being
most probable in unpolluted and undisturbed sites and surrounded by
woodland.
3. After univariate analysis, the main freshwater habitat features were statistically
different between sites with presence of otters and sites lacking them. In
general, otters occurred in medium-sized fluvial habitats, with high bankside
vegetation cover, unpolluted, with low or very low human disturbance and
surrounded by forests or dehesas (Mediterranean-like savannah).
4. Water availability, inferred from the water balance, strongly influenced otter
distribution and the type of water body mostly used. As water availability
increased so did the otter distribution range and during these periods they
tended to colonise low-order streams. During periods of water shortage, otters
were most probably found in high-order streams and reservoirs, the only sites
that kept water.
5. In conclusion, otter distribution in Mediterranean areas is strongly influenced by
two factors: 1) man-induced habitat degradation and 2) natural variability in
water availability. The addition of the second factor to the first one introduces
additional risks to the survival of otter populations in Mediterranean areas
compared with more northerly and humid areas, usually only subjected to the
first threatening factor.
keywords: otter ecology, mustelids, aquatic mammals, stream habitat, water
balance, Mediterranean climate, Spain
Introduction
The otter (Lutra lutra L.) depends largely upon water availability. Other ultimate
factors that determine distribution and habitat selection by river otters (e.g. L. lutra
and L. canadensis) are food availability and the presence of adequate cover
(Melquist and Hornocker, 1983; Bas et al., 1984; Dubuc et al., 1990; Kruuk et al.,
1993; Kruuk, 1995; Prenda and Granado-Lorencio, 1996). However, otters are
affected not only by prey and habitat structure, usually provided by bankside
vegetation (see Mason and Macdonald, 1986, and references therein), but also by
the characteristics of the surrounding areas, water pollution and human
disturbance (Chanin and Jefferies, 1978; Macdonald and Mason, 1983; Bas et al.,
1984; Adrián et al., 1985; Delibes et al., 1991).
In the Mediterranean area where the climate is characterised by a long dry
summer and a high interannual variation in precipitation, water balance (rainfall
minus evapotranspiration) is usually negative, sometimes for very long drought
periods. This hydric stress is responsible for strong irregularities in water flow in
most Mediterranean streams, which fluctuate between catastrophic flash floods in
autumn-spring and intermittent flows or completely dry channels during summer.
Thus, there is no stable water supply in most Mediterranean river basins. It poses
a major question on otter temporal distribution and habitat use in this kind of river
system, because such annual changes in habitat structure and resource
availability should affect the otter’s distribution (Macdonald and Mason, 1982;
Adrián et al., 1985). Delibes (1990) observed that otters in Spain tended to occur
in areas where annual rainfall exceeded 400 mm and also that their distribution
expanded as annual rainfall increased (Delibes, 1993).
Previous work on otter distribution in Mediterranean regions did not directly
address quantitatively the impact of water availability on this species and only few
studies have established any direct quantitative relationship between global habitat
quality and otter habitat use (Prenda and Granado-Lorencio, 1996). However,
several authors have found a positive correlation between otter presence and
particular habitat features, such as bankside cover (Adrián et al., 1985; Macdonald
and Mason, 1985; Delibes et al., 1991). With respect to water supply and otters a
(1982) found signs of otters throughout much of Portugal during August, including
in dry river beds with scattered pools. Similarly, Broyer et al. (1988) observed
otters even in practically desert regions in Morocco.
In southern Spain otters still maintain healthy populations, mostly localised in
areas of low human population density (Delibes, 1990). To test the effects both of
habitat quality (type and structure of water body, cover, characteristics of the
surrounding areas, water pollution and human disturbance) and water availability
on otter distribution the following questions were asked: 1) What are the most
important differences in habitat features between sites with otters and sites lacking
them?; 2) Is there any quantitative relationship between general habitat quality and
otter distribution?; 3) Does water availability influence otter distribution? Finally,
the probable consequences of the response of otters to water shortage in
Mediterranean freshwater habitats were examined.
Study Area
The study area of 13.717 km2, comprises Córdoba province (S Spain) (38º N-5º
W) (Figure 1). This area is bisected by the Guadalquivir River into northern and
southern sectors, which differ both ecologically (geology, vegetation, fauna, etc.)
and socio-economically (demography, economic development, etc.)
(López-Ontiveros, 1985). Human population density in the northern sector is rather low
(usually below 18 km-2) while the southern sector is more densely populated. A
summary of some environmental features of the study area is given in Table 1.
The climate is Mediterranean with a negative water balance caused by a long
summer dry period (between May and October). Rainfall is very irregular, both
within and between years with maximum rainfall in autumn and winter.
The original vegetation in the area is characterised by Mediterranean
schlerophylous species, although nowadays, as in most of the Mediterranean
basin, it is highly modified by human activities, especially in the extensive
agricultural lands of the southern sector. The northern sector is dominated by
natural forests, ‘dehesas’ and ‘maquis’. In general, olive groves are the dominant
The study area is drained by two main rivers, the Guadiana which occupies a
small zone in the North, and the Guadalquivir. Most streams in the Guadiana basin
are usually surrounded by dense riparian forests and characterised by low slopes,
wide channels and unpolluted waters (A.M.A., 1989). The Guadalquivir basin
displays a large asymmetry between the left and right margins. The right margin
presents a high drainage density, with many first and second order high slope
streams that flow into the main river. The left margin drainage basin is made up of
very few long streams, characterised by a low slope and affected by high pollution
level in many reaches (A.M.A., 1995). In all cases the river flow regime is typically
Mediterranean, highly influenced by climatic factors and subsequently with a long
drought period.
Methods
Field surveys
The area was surveyed four times between 1984 and 1995: 1) October-December
1984, 2) July-December 1992, 3) July 1993-May 1994 and 4) July
1995-February-1996. A total of 561 sites, located in 132 distinct water bodies (103 streams, 24
reservoirs, one irrigation channel and four ponds), were surveyed during the study,
distributed temporally as follows: 56 in the first survey period (1), 261 in (2), 98 in
(3) and 146 in (4). Survey site selection was based on 1:50.000 cartographic maps
(National Grid of Spain): each sheet was divided into four quadrats (covering
approx. 140 km2 each) and, within each, most water bodies (mostly streams) were
surveyed.
A survey site was a stream reach or reservoir shore with a minimum length of
200 m (even if otter signs where found immediately) and a maximum of 600 m
(Lenton et al., 1980; Elliot, 1983; Delibes, 1990; Delibes et al., 1991). The species
was considered absent from a site if no signs (scent marks, spraints or footprints)
were found within 600 m. When otter density is very low, signs of their presence
are similarly very limited so otter can remain undetected (Broyer and Erome, 1983;
Macdonald, 1983; Libois et al., 1990). Thus, when a 600 m stretch had been
surveyed and scored negative for otter signs, the stream was also surveyed in
the original site. Within the same stream, the nearest sites (usually < 5 km apart)
were grouped as a single site, when their habitat characteristics were similar.
Also, in large streams and in reservoirs otters presence can similarly remain
undetected due to their preference to spraint on only one bank (Lenton et al.,
1980). To avoid this problem, large streams were surveyed on both banks and
reservoirs along most of their shores.
Otter signs (scent marks, spraints or footprints) were used exclusively as
indicators of otter presence, independently of their number or marking sites found.
Therefore, marking intensity (e.g. spraints 100 m-1) was not noted.
At each survey site, several habitat variables, usually considered of potential
importance to otters (see Mason and Macdonald, 1986; Prenda and
Granado-Lorencio, 1996), and otter presence or absence (1 or 0) were noted. Table 2 lists
the different categories used for each variable and its associated quantitative
scale. Channel width was visually estimated usually between 5-10 times per site.
The most frequent channel width per site was assigned to one of seven
categories. Channel depth was measured with a rigid metre rule (usually between
5-10 times per site). The final estimate per site used was the most frequent depth
category recorded (Table 2). The most frequent flow velocity per site was visually
assigned to one of three categories. The dominant bank substrate, bankside
vegetation cover, bankside dominant vegetation type, land use and human
disturbance in the surrounding areas were all visually estimated and classified into
the categories presented in Table 2.
Channel quality refers to the general state of the watercourse and was
divided into three categories: natural; altered (with apparent human modifications
such as dredging, bankside vegetation cutting, etc.); man-made. Water pollution
was visually assigned to one of three categories: nil (more or less transparent
water without odours or any other apparent sign indicative of pollution, such as
foam); medium-high (water with clear signs of pollution, such as strong odour,
turbid colour, foam, etc.); low (sites not assigned to either of the previous
categories). Human disturbance usually refers to the distance to human
to sites inside urban areas (very intense). The stream order was assigned after
Strahler (1974) based on cartographic maps 1:200,000.
Statistical analysis
Chi-square tests were performed on random use or preferences of single habitat
variables, comparing the frequency distribution of each habitat variable use (only
positive sites, i.e. sites with signs of otters) and availability (all sites surveyed). If
the frequency distributions for habitat variable use and availability did not differ
significantly (P>0.05), the otter was considered to be using that variable at
random. Conversely, significant differences indicated preferences for certain
values of that variable. Initially, this analysis was performed independently for
each survey. The variables that did not provide significant differences between use
and availability in at least three surveys were discarded from subsequent analysis
(flow velocity, bank dominant substrate, bankside dominant vegetation and
channel quality). As for most variables the different comparisons for each survey
produced very similar results, all data were grouped in just one general use and
availability frequency distribution.
Second, the correlation between the habitat quality and otter
presence/absence was tested. Habitat quality was determined by principal
component analysis (PCA) of environmental variables x sites (8 variables-columns
x 561 sites-rows). The environmental variables were quantitatively transformed
from categories according to Table 2. The PC scores that explained most variance
and had a sound ecological meaning were selected (here PC1 and PC2 scores).
These two PCs summarised the eight variables included in the analysis. The study
area was divided into 15 x 10 km quadrats, and the mean habitat quality per
quadrat was calculated as the mean of the PC1 and PC2 scores, respectively, of
the sites inside each quadrat. Otter presence/absence per quadrat was estimated
as the frequency of positive sites throughout the four surveys. Then, to test for
habitat preferences or random habitat use, the PC1 and PC2 were used as
independent variables in a multiple regression model against otter
The effect of water availability on otter presence/absence was tested by a
regression of the water balance (rainfall minus evaporation) and an index of water
pollution (Table 2) per survey period against the percentage of positive sites for
the same survey periods. The water balance data were obtained from a
representative meteorological station located in the study area (Pozoblanco
Meteorological Station, Spanish National Institute of Meteorology). This analysis
considered only the fluvial reaches that were surveyed in the four periods.
Results
Habitat quality and otter signs distribution
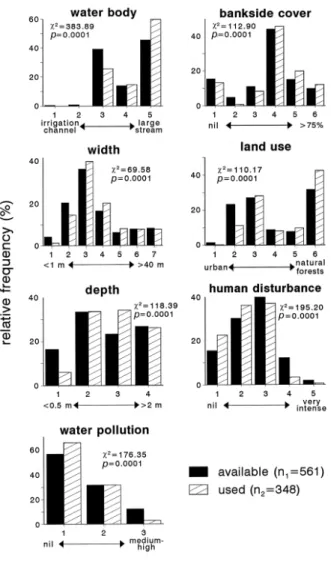
Otters occurred in fluvial habitats 2-20 m wide and 1-2 m deep, with more than
25% of bankside vegetation cover, unpolluted, with low or very low human
disturbance and surrounded by forests or dehesas (Figure 2) (2 analysis,
P<0.0001). On the contrary, otters signs were not usually found in shallow narrow
streams (less than 0.5 m deep and less than 1 m wide), polluted, with intense or
very intense human disturbance and surrounded by crop-pastures (Figure 2). Four
variables (water current, channel quality, dominant bank substrate and bankside
dominant vegetation type) were discarded from this analysis as they were not
apparently selected by otters in any of the survey periods (2 analysis, P>0.05).
Two habitat gradients were identified from the PCA analysis of environmental
variables x sites (Table 3). According to the PC1, the habitat could be ordered
between larger rivers, highly polluted and disturbed, with little bankside vegetation
cover and surrounded by urban areas or crop-pastures, and sites surrounded by
forests with opposite characteristics. The PC2 produced another habitat gradient
(Table 3), that varied between smaller polluted and disturbed streams and larger
water bodies surrounded by woodland. The otter presence/absence (percentage
of positive sites per quadrat) was positively correlated both to PC1 and PC2
(multiple regression model, F88=71.2, R2=61.5%, P<0.00001). PC1 explained
46.7% of variance and PC2 14.7%. Thus, otter signs were most usually found in
unpolluted and undisturbed sites surrounded by woodland. As there were strong
divided by the Guadalquivir River) and the sites surveyed in the southern part
were all negative for otters, the same analysis was carried out for the northern part
alone. The result was the same as for the whole region (multiple regression model,
F76=39.0, R2=56.3%, P<0.00001). The same analysis was repeated, but excluding
all those quadrats that lacked any otter sign, thus avoiding the effect of habitat
potentially suitable to otters but where they were absent. Again the result was the
same (multiple regression model, F65=34.2, R2=50.5%, P<0.00001). Here, PC1
explained 36.4% of variance and PC2 14.1%.
Water availability and otter distribution
Water in the Mediterranean area suffers from periodic deficits, both annually
(mostly during the summer) and interannually, that influence the physical and
hydrological characteristics of water bodies (flow values, watercourse length and
water volume in reservoirs). These shifts in habitat availability for otters might be
related to otter presence/absence (e.g. the percentage of positive surveys per
period). Thus, the water balance for each survey period (an indicator of water
availability for otters) was regressed on otter presence/absence (Figure 3) (here,
as before, only those fluvial reaches that were similarly surveyed in the four
periods were considered). Both variables were positively correlated (R2=88.6,
P=0.05), meaning that as water availability changed so did the otter distribution
range. An inverse relationship was observed for water pollution (Figure 3),
although for this variable the correlation only reached marginal significance
(R2=70.3, P=0.09). Thus, the reduction in water availability not only limits the
potential distribution range for otters, but also determines a parallel reduction in
water quality.
The annual water balance determines mean water flow in streams. During
dry periods water tends to flow only in the highest order streams, while in rainy
years most streams, including the smallest, keep some flow. Otter
presence/absence parallel these changes in water flow. During dry periods otters
used significantly higher order streams than in rainy periods (Figure 4a,
Kruskal-Wallis test, KW=9.3, P=0.025). This showed that the distribution range of otters
water flow is reduced in dry years (Figure 4b), because reservoirs are the only
water bodies, apart from large streams, that keep some water in these periods. In
the study area the presence of otter signs in reservoirs was at its maximum with
respect to streams in the 1994 survey (Figure 4b), i. e. during an intensely dry
period. In contrast, in wet years reservoir use was much reduced, except in
1995-96 when surveys were undertaken only a few months after the previous dry period
(Figure 4b).
Discussion
The importance of habitat quality on otter distribution
The habitat quality of the sites where otters occur in southern Spain are rather
similar to those observed for otters from other geographical areas (Macdonald and
Mason, 1982, 1983; Elliot, 1983; Adrián et al., 1985; Taylor et al., 1988). From the
11 habitat variables analysed in this work, only seven had some influence on otter
distribution. To discriminate which of these variables had a greater influence is
rather difficult because most environmental variables affecting otters are usually
correlated. For example, remote sites far from human influence, as forested
mountainous lands in southern Spain, tend to be undisturbed, unpolluted, with high
bankside cover, etc.- just the opposite of sites in urban areas or surrounded by
intensive agricultural fields. Otters may be affected by the synergistic effect of
several habitat variables rather than by only one isolated factor.
However, some variables are known to be more important to otters than
others, including land use in the surroundings, human disturbance or bankside
cover. Detailed analysis of these variables has shown that several of them are
associated. For example, Melquist and Hornocker (1983) observed that Canadian
otters (Lutra canadensis) showed a high degree of tolerance to human disturbance
if shelter, usually provided by bankside cover, was adequate. A similar result was
found by Macdonald and Mason (1982), Elliot (1983) and Green et al. (1984) for
European otters (L. Lutra). Thus the importance of disturbance is conditioned by
the availability of shelter. In this study human disturbance was negatively
Over an extensive area and time period the probability of finding otter signs
was correlated to a habitat gradient. This gradient in otter habitat conditions
fluctuated from highly polluted and/or disturbed streams up to undisturbed,
unpolluted streams, with high cover availability, especially on both banks and in
the surrounding areas. Thus, otter presence varied according to predictable
changes in habitat conditions. Otters preferred the habitats represented by the
most positive extreme of the habitat gradient and rejected the most negative. This
large-scale observation adds weight to hypotheses on the synergistic effect of
several habitat variables on otter distribution (Delibes, 1990).
The importance of water availability on otter distribution
Water balance, a direct indicator of water availability (Delibes, 1990), is strongly
correlated with otter distribution. In southern Spain water balance is usually
negative, but it still fluctuates between higher or lower negative values. Water
availability is the most important environmental factor for otter distribution (Broyer
et al., 1988; Delibes, 1990), as this species feeds almost exclusively on aquatic
prey (López-Nieves and Hernando, 1984; Mason and Macdonald, 1986). Yet,
water in Mediterranean areas is in short supply and water availability changes
dramatically both within and between years. Thus, the water bodies potentially
inhabited by otters suffer from periodic enlargement and reduction. For example,
during summer most small or medium-sized streams dry up and the only water
remains in a few scattered pools where environmental conditions degrade
progressively (warming up, eutrophication, loss of oxygen concentration and
anoxia, higher densities of fish and other vertebrates). This degradation is still
stressed in streams receiving sewage inputs (Prenda and Gallardo, 1986). A
similar succession is observed throughout the long periods of drought, although
over an extended time period. This reduction in habitat size may force otters to
concentrate in certain aquatic patches containing food and other habitat features
(Macdonald and Mason, 1982; Broyer et al., 1988; Taylor et al., 1988; Delibes et
al., 1991). Conversely, during rainy periods otter distribution may increase as
How are otter populations affected by this strong environmental fluctuation?
(Figure 5). Otter population density in Mediterranean areas may fluctuate
accordingly to water availability. During drought periods, food shortages and
increases in territorial behaviour may cause an elevation in otter mortality (Kruuk
et al., 1993), although no data are available from the study area on this aspect.
However, otter distribution range after an extreme drought increases to the
previous level in a short period of time -about one year- (Figure 4a), less than the
time necessary to get new independent cubs to recover earlier population
densities. The reaches of large streams and reservoirs that contain water even in
the driest months may serve as otter refuges during these stressful periods in
Mediterranean areas.
In general, Mediterranean otters are similarly affected by habitat degradation
and water pollution than otters from temperate areas. But in the Mediterranean
regions, the fluctuations in water availability, both seasonal and interannual, stress
the problems derived from the habitat degradation and, especially, the water
pollution, with respect to more northerly locations (Figure 5). During winter, as a
consequence of frequent catastrophic flash floods, fish suffer from drift and
dillution (the same fish in much larger water volume). The result is that temporally
(from a few days to months) there can be an important reduction in prey
availability. It may force otters to look for alternative prey. During summer or
longer drought periods the reduced flow can determine a strong reduction in water
quality and an increase in contaminant concentration (Prenda and Gallardo, 1996).
It may reduce prey availability and/or increase otter mortality. The final
consequence can be an otter population bottleneck, from which this mustelid can
quickly recover in a subsequent rainy period (Figure 5).
This large variability in otter distribution between rainy and drought periods
may pose a cautionary tale when interpreting large-scale censuses to monitor otter
population status in Mediterranean areas. As otter distribution range expands and
contracts very quickly, the fact that in a certain survey period otter distribution area
may have enlarged with respect to any previous survey, does not necessarily
mean that populations are thriving and that the threats to the species have
pollution reduction as a consequence of contaminant dilution in the larger water
flow predominant during rainy periods) but not necessarily eliminated.
The role of reservoirs on otter distribution and conservation in
Mediterranean areas
Melquist and Hornocker (1983) suggested that the availability of adequate escape
cover and shelter and less disturbance were probably important reasons for
Canadian otters preferring streams, instead of lakes, reservoirs and ponds. These
Idaho water bodies were mostly used by otters when human disturbance
decreased during winter. In southern Spain streams were similarly preferred by
otters, but reservoirs were used where they were available. There were no
observation of any preference or rejection for this sort of man-made water body. In
Sweden there were no obvious differences in otter signs between regulated and
unregulated rivers related to regulation (Nilsson and Dynesius, 1994). This study
suggest that reservoirs could be important habitats for otters during long periods of
large water shortage. In the study area during most of the extreme drought period
1993-94 the only permanent water bodies were reservoirs and very few isolated
pools in some large streams. Otter signs during this period were only found in
such water bodies. When this drought ended, otters quickly recolonised the
remaining area that previously lacked water. According to these results, reservoirs
act as otter refuges during Mediterranean droughts. Notwithstanding, most
reservoirs surveyed in this work were small to medium-sized (usually less than 30
hm3) and none of them seemed to act as barriers impeding otter dispersal, both
upstream and downstream.
Some authors have observed fewer otter signs in reservoirs than in any other
water body, especially streams or rivers (Macdonald and Mason, 1982). The
reservoirs apparently seem to be poor otter habitats due to frequent and
unpredictable water level fluctuations and the lack of bankside cover. On the other
hand, it is more difficult to find otter signs in most reservoirs than in streams
(Delibes, 1990). Thus, in many cases otters may go unnoticed in reservoirs, which
are probably reported as sites lacking otters during conventional otter surveys. In
of us (J. P., personal observation) found signs of otters in 90% of hydroelectric
production reservoirs in the northern half of Portugal. The role of reservoirs on
otter distribution and conservation in Mediterranean areas, especially during
drought periods, should be further investigated.
In conclusion, otter distribution in Mediterranean areas is strongly influenced
by two factors: 1) man-induced habitat degradation and 2) natural variability in
water availability. The addition of the second factor to the first one introduces
additional risks to the survival of otter populations in Mediterranean areas
compared with more northerly and humid areas, usually only subjected to the first
threatening factor.
ACKNOWLEDGEMENTS
We are very grateful to R. Villar, M. Delibes, S. M. Macdonald, H. Kruuk, N. T. H.
Holmes and one anonymous referee for their suggestions and helpful comments
to earlier versions of this paper.
REFERENCES
A.M.A. 1989. Informe general del medio ambiente en Andalucía. Junta de
Andalucía, Sevilla.
A.M.A. 1995. Informe general del medio ambiente en Andalucía. Junta de
Andalucía, Sevilla.
Adrián MI, Wilden W, Delibes M. 1985. Otter distribution and agriculture in
Southwestern Spain. Congr. Int. Un. Game Biol. Brussels. 17th, 17-21
September 1985, pp. 519-26.
Bas N, Jenkins D, Rothery P. 1984. Ecology of otters in northern Scotland. V. The
distribution of otter (Lutra lutra) faeces in relation to bankside vegetation in the
river Dee in summer 1981. Journal of Applied Ecology21: 507-13.
Broyer J, Erome G. 1983. La loutre Lutra lutra dans le basins Rohdanien. Bievre 5:
97-118.
Broyer J, Aulagnier S, Destre, R. 1988. La loutre Lutra lutra angustifrons Lataste,
Chanin PRF, Jefferies DJ. 1978. The decline of the otter Lutra lutra L. in Britain: an
analysis of hunting records and discussion of causes. Biological Journal of the
Linnean Society 10: 305-328.
Delibes M. 1990. La nutria (Lutra lutra) en España. ICONA, Serie Técnica: Madrid.
Delibes, M. 1993. Estudio sobre la nutria en Andalucía. I Jornadas Españolas de
Conservación y Estudio de Mamíferos, 17. Mollina (Málaga).
Delibes M, Macdonald SM, Mason CF. 1991. Seasonal marking, habitat and
organochlorine contamination in otters (Lutra lutra): a comparison between
catchments in Andalucía and Wales. Mammalia 55: 567-578.
Dubuc LJ, Krohn WB, Owen RB. 1990. Predicting occurrence of river otters by
habitat on Mount Desert Island, Maine. Journal of Wildlife Management54,
594-599.
Elliot KM. 1983. The otter (Lutra lutra L.) in Spain. Mammal Review 13: 25-34.
Green J, Green R, Jefferies DJ. 1984. A radio-tracking survey of otters Lutra lutra
on a Perthshire River system. Lutra27: 85-145.
Kruuk H. 1995. Wild Otters. Predation and Populations. Oxford University Press:
Oxford.
Kruuk K, Carss DN, Conroy JWH, Durbin L. 1993. Otter (Lutra lutra L.) numbers
and fish productivity in rivers in north-east Scotland. Symposium of the
Zoological Society of London 65: 171-191.
Lenton EJ, Chanin PRF, Jefferies DJ. 1980. Otter survey of England 1977-79.
Nature Conservancy Council. London.
Libois RM, Paquot A, Lambert M. 1990. Des piéges á indices olfactis pou détecter
la présence de la loutre (Lutra lutra)? Cahiers d’Ethologie Applique10: 105-10.
López-Nieves P, Hernando JA. 1984. Food habits of the otter in the Central Sierra
Morena (Córdoba, Spain). Acta Theriologica29: 383-401.
López-Ontiveros A. 1985. Córdoba. Ediciones Gever: Sevilla.
Macdonald SM. 1983. The status of the otter (Lutra lutra) in the British Isles.
Mammal Review13: 11-23.
Macdonald SM, Mason CF. 1982. The otter Lutra lutra in Central Portugal.
Macdonald SM, Mason CF. 1983. The Otter Lutra lutra in Southern Italy. Biological
Conservation25: 95-101.
Macdonald SM, Mason CF. 1985. Otters, their habitat and conservation in
Northeast Greece. Biological Conservation 31: 191-210.
Mason CF, Macdonald SM. 1986. Otters. Ecology and Conservation. Cambridge
University Press: Cambridge.
Melquist WE, Hornocker MG. 1983. Ecology of river otters in West Central Idaho.
Wildlife Monographs 83: 1-60.
Nilsson C, Dynesius M. 1994. Ecological effects of river regulation on mammals
and birds: a review. Regulated Rivers: Research and Management 9: 45-53.
Prenda J, Gallardo A. 1996. Self-purification, temporal variability and the
macroinvertebrate community in small lowland Mediterranean streams receiving
crude domestic sewage effluents. Archiv für Hydrobiologie136: 159-170.
Prenda J, Granado-Lorencio C. 1996. The relative influence of riparian habitat
structure and fish availability on otter Lutra lutra L. sprainting activity in a small
Mediterranean catchment. Biological Conservation 76: 9-15.
Strahler AN. 1974. Geografía física. Omega: Barcelona.
Taylor IR, Jeffries MJ, Abbott SG, Hulbert IAR, Virdee SRK. 1988. Distribution,
habitat and diet of the otter Lutra lutra in the Drina catchment, Yugoslavia.
Table 1. Summary of environmental data of the study area (Córdoba province,
southern Spain).
Mean Range
rainfall (mm yr-1) 647 375 - 1168
Mean annual temperature (ºC) 16.6 15.3 - 17.6
human population density (km-2) 63.9 12.4 - 149.8
altitude (m) 550 100 - 1570
water quality: BOD (mg L-1) 83.9 0.6 - 167.1
water quality: conductivity (s cm-1) 1532 270 - 6780
Number Total capacity (hm3)
reservoirs (>5 hm3) 16 2510
Land use (km2) %
crop and pastures 3754 27.4
olive grove 2935 21.4
dehesas 3572 26.0
Table 2. Qualitative scales used to estimate selected variables of otter habitat Scale water body width (m) depth (m) Flow velocity bank dominant substrate water pollution1 bankside vegetation cover bankside dominant vegetation type channel quality
land use human
disturbance2
1 irrigation
channel
<1 <0.5 no current
or very slow
large rocks nil nil nil man
made
urban nil or very low
2 pond 1-2 0.5-1 slow
pebble-cobble
low <10% helophytes Altered3
crop-pastures
low
3 small
stream
>2-5 >1-2 moderate or high
fine gravel
medium-high
10-25% trees natural Dehesa4 moderate
4 reservoir >5-10 >2 sand >25-50% bushes olive grove intense
5 large
stream
>10-20 >50-75% tree
plantations
very intense
6 >20-40 >75% natural
forest
7 >40
1,2
See methods for explanation 3
dredged, bankside vegetation cutting, etc. 4
accounted for 33.5 % and 29.4 % of the variance, respectively (n=561).
* P<0.05; ** P<0.01, *** P<0.001
PC1 PC2
land use 0.69*** 0.42***
water pollution -0.76*** -0.11*
human disturbance -0.72*** -0.33***
water body 0.01 0.70***
width -0.47*** 0.73***
depth -0.36*** 0.86***
FIGURE CAPTIONS
Fig. 1. Map of the study area (Córdoba province, southern Spain) indicating the
positive (filled circles) and negative sites (open circles) for otters in four
Fig. 2. Frequency distribution (%) of selected environmental variables at all sites
(filled bars) and at only those sites where otter signs were found (hatched
Fig. 3. Temporal evolution of water balance (rainfall minus potential
evapotranspiration), the water pollution index (see Methods) and the
percentage of otter positive sites in a large area in southern Spain. The
water pollution index are means ± SE (error bars). Observe that ‘water
balance’ and ‘percentage of positive surveys’ run parallel, the opposite to
‘water pollution’.
Fig. 4. a) Distribution of otter signs in several order streams and in reservoirs in
four different periods (three wet and one dry). b) Ratio between the relative
frequency of positive sites in reservoirs vs. the relative frequency of positive
sites in streams in the four periods previously mentioned.
FRESHWATER
MEDITERRANEAN
TEMPERATE FRESHWATER HABITATS
Habitat
degradation
+
Seasonal fluctuations
Interannual variability
Fig. 5. A model scheme on the hypothetical consequences of climate fluctuations