PROGRAMA DE DOCTORADO EN CONSERVACIÓN Y USO
SOSTENIBLE DE SISTEMAS FORESTALES
TESIS DOCTORAL:
Tree growth dynamic and thinning response in
Mediterranean pine-oak forest stands
Presentada por Jorge Aldea para optar al grado de
Doctor por la Universidad de Valladolid
Dirigida por:
Tree growth dynamic and thinning
response in Mediterranean pine-oak
forest stands
Jorge Aldea
Sustainable Forest Management Research Institute
University of Valladolid
-INIA
A thesis submitted for the degree of Doctor
1
GENERAL INDEX
LIST OF FIGURES
4
LIST OF TABLES
5
LIST OF ACRONYMS
6
NOTE TO READERS
7
ABSTRACT
8
RESUMEN
10
INTRODUCTION
12
1.1. Climate change impact on Mediterranean forest 12
1.2. Forest management for climate change adaptation 13
1.3. The use of dendrometer devices for tree growth dynamics 14
1.4. Mediterranean pine-oak mixed forests 16
1.5. Motivation 24
OBJECTIVES
25
2.1 General objective 25
2.2 Specific objectives 25
2.3 Graphic schedule of present research 25
DATA
27
3.1. Study sites and experimental design 27
3.1.1. Pinus pinaster -Quercus pyrenaica mixed forest 27 3.1.2. Pinus sylvestris-Quercus pyrenaica mixed forest 30
3.2. Stem radial variation and climatic measurements 32
2
METHODS
37
4.1. Spring radial increment onset 37
4.2. Stem radial variation cycle approach 37
4.3. Weather effect on stem radial variation 38
4.3.1. Weather effect on daily radial variation cycle and increment phase 38 4.3.2. Weather effect on radial increment rate 39
4.4. Radial variation synchrony 40
4.5. Intra-annual cumulative radial increment pattern 40
4.5.1. Bi-logistic model 40
4.5.2. Single Richards model for spring and autumn period 41
4.5.3. Double-Richards model 42
4.6. Thinning effect on radial increment 43
4.6.1. Thinning effect on intra-annual radial increment 43 4.6.2. Thinning effect on inter-annual radial increment 44
4.7. Statistical methods summary 44
RESULTS
47
5.1.Pinus pinaster and Quercus pyrenaica daily radial increment dynamics 47
5.1.1. Spring radial increment onset 47 5.1.2. Seasonal differences in daily radial variation cycles 47 5.1.3. Weather influence on daily radial variation cycles 49
Influence on amplitude and period 49
Influence on radial increment phase 50
5.1.4. Species radial variation synchrony 52 5.1.5. Inter-annual variation in intra-annual cumulative radial increment pattern 53
5.2.Pinus pinaster and Quercus pyrenaica radial increment response to thinning 55
5.2.1. Thinning and weather influence on radial increment rate 55 5.2.2. Thinning effect on intra-annual radial increment pattern 56 5.2.3. Thinning effect on inter-annual variation of seasonal and annual radial increment 59
5.3.Pinus sylvestris and Quercus pyrenaica radial increment response to thinning 62
5.3.1. Thinning effect on intra-annual cumulative radial increment pattern 62
DISCUSSION
64
6.1. Meteorological drivers of radial variation 64
6.2. Growth temporal complementarity 66
3
6.3. Intra and inter-annual thinning effect 71
CONCLUSIONS
74
CONCLUSIONES
75
ACKNOWLEDGEMENTS
77
BIBLIOGRAPHY
79
APPENDIX A: SUPPLEMENTARY FIGURES
93
APPENDIX B: SUPPLEMENTARY TABLES
96
APPENDIX C: STATISTICAL SCRIPTS SUMMARY
97
4
List of Figures
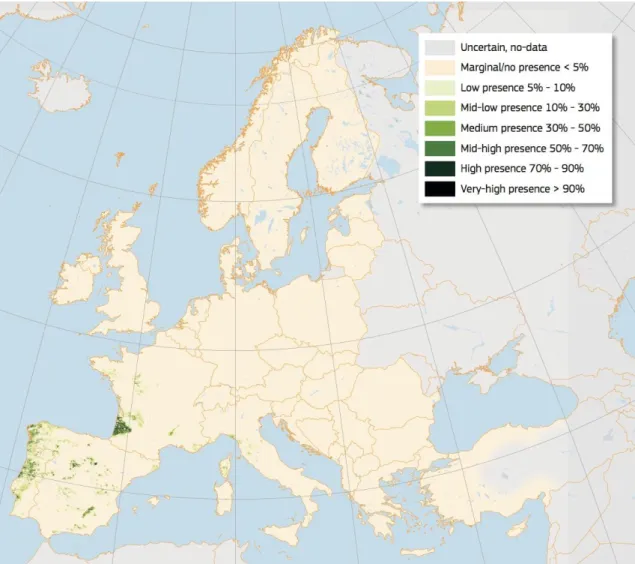
Figure 1.High resolution distribution map for Pinus pinaster estimating the relative probability of presence 17
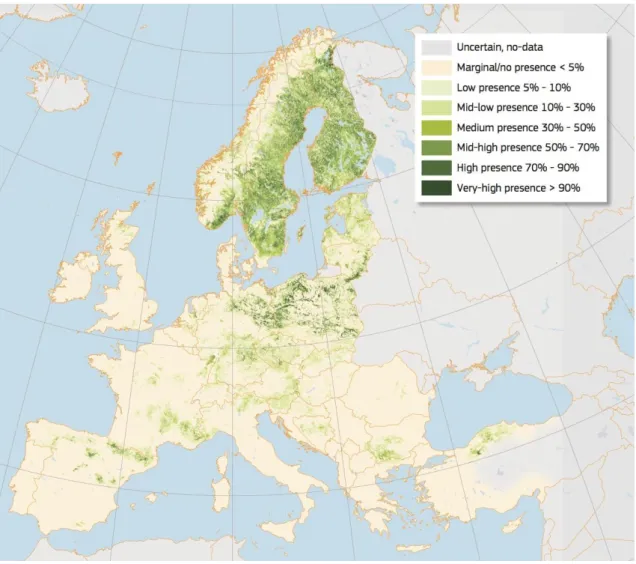
Figure 2. High resolution distribution map for Pinus sylvestris estimating the relative probability of presence 18
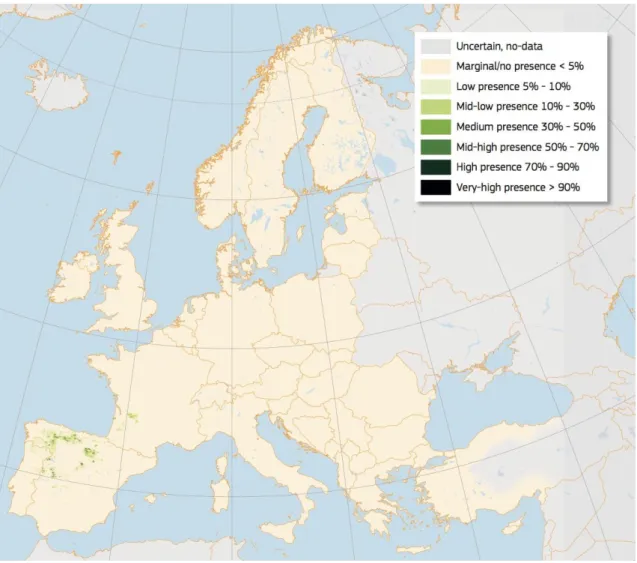
Figure 3. High resolution distribution map for Quercus pyrenaica estimating the relative probability of presence 19
Figure 4 Distribution map of Pinus pinaster, Quercus pyrenaica and mixed forest stands in Spain 20
Figure 5. Distribution map of Pinus sylvestris, Quercus pyrenaica and mixed forest stands in Spain 21
Figure 6. Thesis workflow process to evaluate species temporal complementarity and thinning response based on intra-annual radial variation of pine-oak mixed forest. 26
Figure 7. Band dendrometer installed in maritime pine-oak mixed forest stands 33
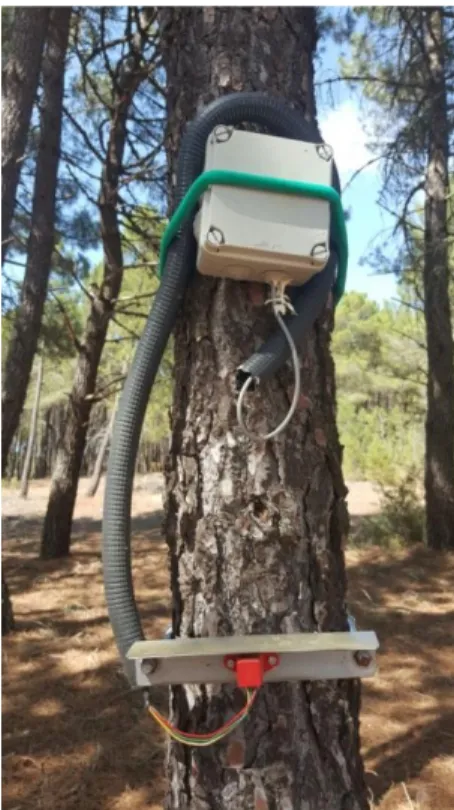
Figure 8. Electronic high-resolution point dendrometer installed in maritime pine-oak mixed forest stands 34
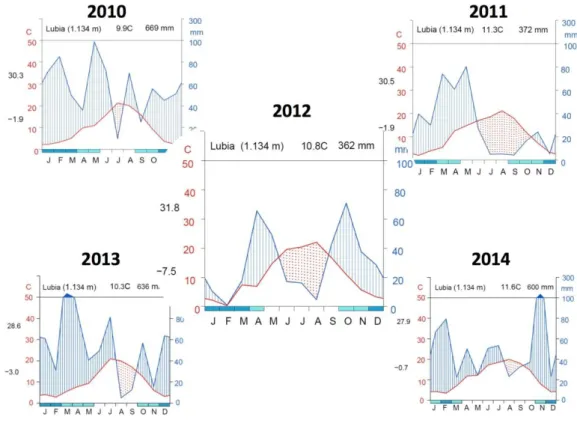
Figure 9. Climograms of sampling years for maritime pine-oak mixed forest in WAI-0.22 site 35
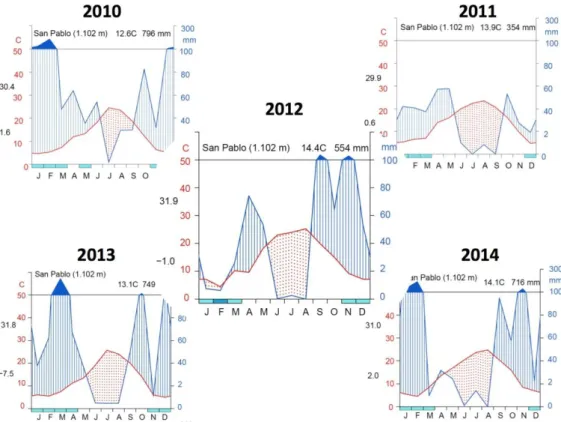
Figure 10. Climograms of sampling years for maritime pine-oak mixed forest in WAI-0.65 site 36
Figure 11. Climograms of sampling years for Scots pine-oak mixed forest. 36
Figure 12. Schematic representation of stem daily radial variation cycle, divided into three distinct phases: contraction,
expansion and stem radial increment 38
Figure 13. Species radial increment onset and leaf phenological phases for maritime pine-oak mixed forest by site 47
Figure 14. Mean daily radial variation cycles by season for maritime pine-oak mixed forest 48
Figure 15. Differences in amplitude (mm), period (hours) and onset of contraction phase for daily radial variation cycles by species and season in maritime pine-oak forest 48
Figure 16. Species-specific effect of air temperature on amplitude of daily radial variation cycles. Air temperature and precipitation effects on period of radial variation cycles for maritime pine-oak mixed forest 49
Figure 17. Differences of daily radial increment and number of cycles with increment phase in spring by site, year, and species of maritime pine-oak mixed forest 51
Figure 18. Intra-annual cumulative radial increment patterns of maritime pine-oak mixed stands recorded by
high-resolution point dendrometers 53
Figure 19. Cumulative radial increment and radial increment rates from bi-logistic model for P.pinaster. 57
Figure 20. Cumulative radial increment and radial increment rates from bi-logistic model for Q.pyrenaica. 57
Figure 21. Spring, autumnal and annual radial increment differences between treatments, years, species and sites in
maritime pine-oak mixed forest 61
5
List of Tables
Table 1. Main stand characteristics before and after thinning for the two study sites of maritime pine-oak mixed
forest 29
Table 2. Main stand characteristics before and after thinning for Scots pine-oak mixed forest 31
Table 3. Main characteristics of sampled trees with band dendrometer for maritime pine-oak mixed stands 32
Table 4. Main characteristics of sampled trees with band dendrometer for Scots pine-oak mixed stand 33
Table 5. Main characteristics of sampled trees with high-resolution dendrometer for the two study sites of maritime
pine-oak mixed forest 34
Table 6. Summary of statistical methods and R packages used 46
Table 7. Linear mixed model fitted for weather effect on amplitude and period of stem radial variation cycles in
maritime pine-oak mixed forest (Eq. 1) 50
Table 8. Linear mixed model fitted for weather effect on annual and spring daily radial increment of maritime
pine-oak mixed forest (Eq. 1) 52
Table 9. Synchrony of radial variation between time series of maritime pine-oak mixed forest 53
Table 10. Single Richards model fitted for spring and autumn cumulative radial increment pattern for maritime
pine-oak mixed forest (Eq. 5) 54
Table 11. Linear mixed model fitted for weather and thinning effect on radial increment rate of maritime pine-oak
mixed forest by site (Eq. 2) 56
Table 12. Intra-annual bi-logistic model parameter set differences between treatment and species for each site of
maritime pine-oak mixed forest (Eq. 4) 58
Table 13. Linear mixed model fitted for thinning effect on spring, autumn and annual radial increment of Pinus
pinaster by site (Eq. 7) 59
Table 14. Linear mixed model fitted for thinning effect on spring, autumn and annual radial increment of Quercus
pyrenaica by site (Eq. 7) 60
Table 15. Double-Richards model fitted for intra-annual cumulative radial increment pattern of Scots pine-oak
6
List of Acronyms
AEMET Spanish State Meteorological Agency AIC Akaike information criterion
AR autoregressive serial model
ARIMA mixed autoregressive and moving average serial model
BA basal area (m2/ha)
C Concurrency
DBH, dbh diameter at breast height mm
ha hectare
H0 dominant height (m)
HT heavy thinning (40-50% basal area removed) IADFs intra-annual density fluctuations
LdM Loreau and de Mazancourt’s metric
MA moving average serial model
m.a.s.l. meters above sea level
MT moderate thinning (25% basal area removed)
P rainfall per daily cycle (mm)
Q Phase synchrony metric
RHmin minimum relative air humidity (%) SR solar radiation (10KJ/m2)
Tair mean air temperature (ºC)
Tmin minimum air temperature (ºC) Treat. thinning treatment intensity VPD mean vapor pressure deficit (kPa)
W Kendall’s concordance metric
WAI Walter-Lieth annual aridity index
7
Note to readers
8
Abstract
Climate change forecasts are particularly severe for the western Mediterranean Basin, where rising temperatures and decreased precipitation could increase the frequency of drought events. Mixed forest stands via species niche complementarity may lead to greater functional services, over-yielding or increased temporal stability compared to monospecific stands. Controlling competition through thinning may also provide a drought adaptation tool to minimize potentially adverse ecological and socio-economic impacts of climate change.
In this study, we sought to better understand temporal complementarity among intra-annual radial increment and thinning effect in Mediterranean pine-oak coexisting species. Besides, we required to uncover differences in the weather drivers of radial variation for the two co-existing species. The forest stands under study were originated by pine forestation, which were diversified over time due to the recovery and sprout of initially oak coppice stands. Nowadays, they present a pine-oak mixed stands structure where pine species dominates the oak coppice trees.
We studied species differences in stem daily radial variation cycles, intra-annual cumulative radial increment pattern and thinning response of Pinus pinaster-Quercus pyrenaica mixed stands over climatically contrasted years (2010-2014) at two sites with dissimilar drought conditions. Moreover, intra-annual cumulative radial increment pattern and thinning response of Pinus sylvestris-Quercus pyrenaica mixed stands were evaluated for two contrasted year (2016-2017). A severe drought event occurred during 2012 and 2017 years in both sites respectively.
Nine rectangular plots were established in a Latin square design at the three study sites. The experimental design consisted of two thinning treatments with different intensity and unthinned control with three replicates each. Thinning treatment comprised moderately and heavy thinning removing 25% and 40-50 % of initial basal area. Thinning treatment was focused only on pine in maritime pine-oak mixed stands, while both species were harvested in Scots pine-oak mixed stand. Band and high-resolution point dendrometers were installed in oak and pine trees sample, so that stem radial variation was analyzed. Site weather variables were continuously monitored using a variety of sensors, a specifically weather station and via the Spanish State Meteorological Agency automatic network stations.
Non-linear mixed models were fitted to show species differences in intra-annual cumulative radial increment pattern: bi-logistic, a Richards curve for spring and autumn period and a double-Richards curve. Linear mixed models were fitted to analyze species-specific response to weather. Besides, linear and non-linear statistical metrics were also used to evaluate radial variation synchrony.
9
leads to radial stem-size changes in daily variation cycles with different species responses, while precipitation increased daily amplitude and cycle duration in the same way for both species. Daily radial increment and number of cycles with increment phase during spring were mostly higher for maritime pine than oak, being water availability the most important control factor. Accordingly, intra-annual cumulative patterns showed greater radial increment for maritime pine than oak regardless year and site. Species differences in intra-annual cumulative radial increment patterns also revealed a possible species-specific complementarity growth strategy in certain periods, despite synchronization of radial variation.
10
Resumen
Las previsiones sobre el cambio climático son especialmente graves para la cuenca del Mediterráneo occidental, donde el aumento de las temperaturas y la disminución de las precipitaciones podrían acrecentar la frecuencia de los episodios de sequía. Las masas mixtas, a través de la complementariedad de nichos de las especies que la componen, pueden conducir a la obtención de mayores servicios ambientales, sobre-producción o mayor estabilidad temporal en comparación con masas monoespecíficas. Controlar la competencia mediante las claras puede proporcionar, asimismo, una herramienta de adaptación a la sequía, minimizando los impactos ecológicos y socioeconómicos potencialmente adversos generados por el cambio climático.
En el presente estudio, se pretende esclarecer la complementariedad temporal, de acuerdo con los patrones de incremento radial intra-anual, y el efecto de las claras en las especies de pino y rebollo que coexisten en clima Mediterráneo. Además, se evaluaron las diferencias en la variación radial de las especies en respuesta a las variables climáticas. Las masas objeto de estudio proceden de repoblación (inicialmente eran masas de pino, con las características típicas de las masas artificiales), las cuales se diversificaron con el tiempo debido a la recuperación y rebrote de las originales masas de monte bajo de rebollo. En la actualidad son masas mixtas con una en estructura en las que domina el pino con subpiso de rebollo. Se estudiaron las diferencias entre especies de los ciclos de variación radial diaria, en el patrón intra-anual del incremento radial acumulado y en la respuesta de la clara de las masas mixtas de Pinus pinaster-Quercus pyrenaica en años climáticamente contrastados (2010-2014) y en dos sitios con condiciones de sequía diferentes. Asimismo, se evaluó el patrón intra-anual del incremento radial acumulado y la respuesta de la clara de una masa mixta de
Pinus sylvestris-Quercus pyrenaica durante dos años distintos climáticamente (2016-2017). Se
produjo un evento de sequía grave durante los años 2012 y 2017 en ambas masas, respectivamente.
Se establecieron nueve parcelas rectangulares en un diseño cuadrado latino en los tres sitios de estudio. El diseño experimental consistió en dos tratamientos de clara con diferente intensidad y un control (sin aclarar) con tres réplicas cada uno. El tratamiento de clara por lo bajo consistió en una intensidad moderada y fuerte, eliminando el 25% y el 40-50% del área basal inicial respectivamente. La clara se realizó solamente eliminando el pino en rodales mixtos de pino negral y rebollo, mientras que ambas especies fueron cortadas en rodales mixtos de pino albar y rebollo. Para el análisis de la variación radial, se instalaron dendrómetros de banda y electrónicos de alta resolución temporal en una muestras de los pies de pino y rebollo. Las variables meteorológicas de cada sitio se registraron de forma continua utilizando una variedad de sensores, una estación meteorológica al uso y estaciones automáticas de red de la Agencia Estatal de Meteorología.
11
Richards. Se emplearon modelos mixtos lineales para analizar la respuesta de cada especie al clima. Además, se utilizaron estadísticos lineales y no lineales para evaluar la sincronía en la variación radial de las especies.
El incremento radial comenzó de media el 30 de marzo para el pino negral, mientras que para el rebollo fue entre 1-3 semanas más tarde coincidiendo con el brote de la hoja. La temperatura del aire generó variaciones radiales en los ciclos diarios con diferentes respuestas de las especies, mientras que la precipitación aumentó la amplitud y la duración del ciclo diario de igual forma para ambas especies. El incremento radial diario y el número de ciclos con dicha fase fueron mayores para el pino negral que para el rebollo durante la primavera, siendo la disponibilidad de agua el factor más importante para dicho incremento. En consecuencia, el patrón intra-anual mostró un mayor incremento radial para el pino negral que para el roble independientemente del año y el sitio. Las diferencias de las especies en el patrón intra-anual del incremento radial acumulado también revelaron una posible estrategia de complementariedad en el crecimiento en ciertos períodos, a pesar de la sincronización en la variación radial.
12
Introduction
1.1. Climate change impact on Mediterranean forest
Climate change could influence biodiversity and ecosystem functioning through phenological alterations (Gordo and Sanz, 2009; Rossi et al., 2011), species-specific distribution range shifts (Peñuelas et al., 2007), changes in forest production (Linares and Camarero, 2012; Pretzsch et al., 2014) and subsequent changes in carbon storage (Vayreda et al., 2012).
Thereby, climate change could entail severe loss in the economic value of forest land in southern Europe which might affect the provision of goods and forest services (Hanewinkel et al., 2012). This in turn may lead to changes in traditional timber harvesting or diversification in the use of non-woody forest products and other forest resources (Bravo et al., 2008; Hanewinkel et al., 2012). Thus, forest management plans must take into account future drought risk and water resource management strategies as adaptation measures for climate change (Botterill and Hayes, 2012).
Moreover, climate change may impact specially Mediterranean forests harshly (Dankers and Hiederer, 2008; Luterbacher et al., 2012) resulting in soil water deficits that could alter tree growth according to species sensitivity (Lara et al., 2013; Michelot et al., 2012). Although fertilize effect from CO2 increment could enhance net primary productivity, low evidence
was observed in Mediterranean stands (Camarero et al., 2015; Rathgeber et al., 2000). Several studies demonstrated an increment of plant mortality rates and die-off events, reduced seedling recruitment, long-term shifts in vegetation composition, reduced radial growth, and increased crown defoliation responses (Allen et al., 2010; Andreu et al., 2007; Carnicer et al., 2011).
13
1.2. Forest management for climate change adaptation
Different temporal scales of management strategies must be considered for forest adaptation to climate change. The strategies should be executed towards achieving short-term objectives (as decreasing the immediate risk of a particular disturbance), and also towards the promotion of resilience for long-term adaptation. Different management strategies are expected to induce short/mid-term or long-term effects, and it can be implemented before disturbance (e.g. to improve resistance to drought) or after disturbance (e.g. to improve forest recovery after fire). According to Vilà-Cabrera et al., (2018) the management strategies to cope to climate change could be classified as follow:
1. Promoting mixed forests via species or genotype levels, or actions focused for the promotion of forest structural diversity as uneven-aged forests to raise stability to disturbances (Martín-Alcón et al., 2016).
2. Reduction of stand density. Thinning treatments increase growth, health and value of the remaining trees. Besides, reduces fire risk losses (Hurteau et al., 2008), and stimulates resistance to drought (D’Amato et al., 2013a) and pests (Waring and O’Hara, 2005).
3. Changing species or genetic composition better adapted to the conditions forecasted under global warming.
4. Management of the understory by breaking vertical and horizontal fuel continuity, or promoting spatial heterogeneity for disturbance prevention and enhancing connectivity.
The present study is focused on the first two strategies, which effects are expected to induce long and short/mid-term effects, respectively. Mixed-species stands present some advantages over monospecific ones with regard to ecological functions and services (Forrester, 2017; Knoke et al., 2008; Pretzsch and Forrester, 2017). Several recent studies have identified mixed forest stands as a possible adaptation strategy in forest management, to cope with climate change, increase resistance and recovery to biotic and abiotic factors (Forrester, 2015; Guyot et al., 2016; Pretzsch et al., 2013) and enhance temporal stability (del Río et al., 2017b; Jucker et al., 2014). Mixtures could increase resilience in extreme drought conditions through complementary use of water resources based on species niche partitioning and modifications in water-use efficiency (Forrester, 2014). Although studies have shown contrasting results depending on species composition and site conditions, the positive effect of mixing species seems relevant to drought-prone sites (Forrester et al., 2016; Grossiord et al., 2014). Mixed forest stands might also increase diversify production and reduce the risk of damage from pests or diseases (e.g. Condés et al., 2013; Griess and Knoke, 2011; Kelty, 2006; Pretzsch et al., 2015; Pretzsch and Schütze, 2009).
14
2013; Riofrío et al., 2017a). This could be important for the Mediterranean region, where pine species have generally been re-introduced into oak coppice stands. Successional and phenological trait differences could involve different species growth, offset the usual low production of Mediterranean pure oak coppices and promote mixed composition as a possible adaptation strategy for climate change.
Thinning treatment is a management strategy planned to have short- or mid-term effects on forest responses. Thinning reduce tree-to-tree competition for resources and to improve survival and fruit production (Olivar et al., 2014; Sanchez-Humanes and Espelta, 2011), the physiological performance of individuals (Matteo et al., 2010), and alters forest functions such as C sequestration (Bravo-Oviedo et al., 2017), as well as the reduction of drought vulnerability via increasing water availability and water use efficiency (Cotillas et al., 2009; D’Amato et al., 2013b; Magruder et al., 2013)and fire risk (Hurteau et al., 2008).
Trees growing in conditions of low competition enhance tree growth and prevent stand growth stagnation and are less vulnerable to the drought events predicted by climate change scenarios (Fernández-de-Uña et al., 2015; Martín-Benito et al., 2010; Martínez-Vilalta et al., 2012). Concretely, thinning improve radial growth recovery but scarcely to resistance of drought Sohn et al., (2016b). Controlling competition through thinning may also provide a drought adaptation tool that would minimize potentially adverse ecological and socio-economic impacts of climate change (J. A. Sohn et al., 2016a, 2016b; Sohn et al., 2013). Therefore, understanding growth dynamics in mixed forest stands under different competition conditions may serve to establish a combined strategy for adapting forest stands to climate change.
1.3. The use of dendrometer devices for tree growth dynamics
Tree or stand growth can be measure by several methodologies attend to forestry science, which varies according temporal scale and precision. The common methodology used to evaluate tree growth is by difference of forest inventories. It is largely used in National Forest Inventories along the globe by comparing stocks in temporal field plots in different times. Growth is calculated by the difference of target variable (diameter, high, basal area, volume, biomass, etc.) for a same place (plot) in different times at long-term (years).
15
To examine relationships between growth and short-term climatic variability in tree species mixtures, inter-annual measurements usually provide a better basis than inventories or intra-annual measurements for analyzing ecosystem processes such as synchrony (Bauhus et al., 2017b). However, intra-annual data can improve predictions of potential tree growth response to climate by identifying particular climatic events that may escape a classical dendroclimatic approach (Duchesne and Houle, 2011). Monitoring intra-annual stem radial variations can provide insight into climate impacts on tree physiology and growth processes (Deslauriers et al., 2007; Duchesne and Houle, 2011; Zweifel, 2016). Accordingly, micro-cores let wood formation monitoring by sampling small wood samples (2 mm in diameter and 15-20 mm long) from the stem of the selected trees. Micro-cores are collected weekly at breast height following an ascending spiral pattern and spacing out each sampling from about 2 cm of the previous one to avoid wound reaction. Cross micro-sections are prepared from micro-cores to allow microscopic observation of cambial activity and tree growth.
Moreover, intra-annual radial variation patterns may reveal species-specific resource capture and growth, and repot tree interaction differences between mixed and monospecific stands (Forrester, 2014; Pretzsch, 2017). In view of that, band dendrometers are typically used to read manually using vernier measurement scales or similar. They can theoretically be used to detect small changes in stem size, when read very frequently. However, they require that an operator read this scale periodically and readings should be taken in the early morning when stem size is at a maximum to avoid mistakes. The advantages of band dendrometers for measuring tree diameter are that measured are taken easily with precision, and offer a low-cost. Thereby, they can be installed in a lot of trees, so they have most often been used for developing precise estimates of intra-annual growth. Drew and Downes, (2009) defined band dendromters as high-spatial and low temporal resolution measuring tools. Some examples of intra-annual uses of dendrometer bands include investigation of seasonal dynamics and growth phenology. Band dendrometer studies have generally analyzed relationships between stem size variations and climate (Duchesne and Houle, 2011; Oberhuber et al., 2014; Vieira et al., 2013), as well as species-specific responses (King et al., 2013; Oberhuber et al., 2015). Studies based on band dendrometer diameter measurement in Mediterranean mixed forests are scarce. Riofrío et al., (2017b) found proportion in species composition to be an important factor affecting intra-annual radial increment patterns in maritime pine-Scots pine mixed stands.
16
synchrony between species. Radial increment onset from dendrometer recordings could be related with xylogenesis, i.e, radial growth development (Oberhuber and Gruber, 2010; Vieira et al., 2014; Vieira et al., 2015). Generally, forest synchrony analyses focus on inter-annual radial growth concurrence in the timing of ring formation over several years (Fajardo and Mcintire, 2012; Hayles et al., 2007; Lyu et al., 2016) or flowering and seed tree phenology (Bogdziewicz et al., 2017), but very little is known about intra-annual radial variation synchrony between species from dendrometer measurements. Moreover, several authors have also studied leaf phenology and Quercus pyrenaica Willd. cambial activity dynamics (Fernández-De-Uña et al., 2017; González-González et al., 2013; Pérez-de-Lis et al., 2013), but dendrometer records have seldom been used to explore the relation between leaf phenology and radial increment.
The handful of studies that have reported on seasonal variations in tree stem radius in Mediterranean areas mostly confirm the dominant role of temperature as the major constraint on radial increment in short time scales, and of precipitation effects in monthly scales (Camarero et al., 2010; Gutiérrez et al., 2011; Vieira et al., 2013). However, high-resolution stem diameter variation studies on mixed forests in this region are infrequent. Sánchez-Costa et al., (2015) found contrasting growth and water use strategies in four co-occurring Mediterranean species. Besides, reports of radial variation cycles focusing on the species studied here are insufficient, with the exception of Vieira et al. (2013), who worked with matirime pine for one year only (2010). Camarero et al., (2010) described also species-specific differences in xylogenesis patterns in mixed stands of Juniperus thurifera L., Pinus halepensis Mill., and Pinus sylvestris L. by high-resolution dendrometers.
Because intra-annual analyses often involve short observation periods, they do not accurately capture radial variations under contrasting weather conditions (Drew and Downes, 2009; King et al., 2013). However, in this study we evaluated a long period for Pinus pinaster Ait.-Q.pyrenaica stands (2010-2014) and two contrasted years for
P.sylvestris-Q.pyrenaica mixed forest (2016-2017) with a severe drought episode in both cases.
1.4. Mediterranean pine-oak mixed forests
The maritime pine (Pinus pinaster) is a widespread medium-size tree native to the western Mediterranean basin (Figure 1). Most of the surface occupied in Europe by maritime pine
is in the Iberian Peninsula, approximately 1.7 million ha in monospecific and mixed stands
(Serrada et al., 2008). Maritime pine in Spain is at 600-1300 m.a.s.l. in a sub-humid and continental Mediterranean climate. Mean annual precipitation is 400-800 mm and summer
precipitation is between 20-125 mm (Serrada et al., 2008). It is ecologically versatile,
showing a wide range of expressive traits regarding growth characteristics, frost resistance, adaptation to summer drought and shows preference for siliceous and sandy soils.
17
Figure 1. High resolution distribution map for Pinus pinaster estimating the relative probability of presence. Source:(Abad Viñas et al., 2016)
Pinus sylvestris (Scots pine) is the most widely distributed pine species in the world, can be
found all the way across Eurasia. The mountains of Sierra Nevada in southern Spain (37° N) are the southern latitudinal limit of the species. In Europe, Scots pine forests now
exceed 28 million ha (Figure 2) and in Spain is approximately 1.3 million ha (Serrada et al.,
2008). Although the altitudinal distribution of Scots pine in Spain is at 800-2000 m.a.s.l., it is mainly found in montane climate: mean annual precipitation of 600-1200 mm and summer precipitation higher than 100 mm (Serrada et al., 2008).
Scots pine is a light-demanding pioneer species (but also can be found in partially shaded
sites), frost and drought tolerant and able to grow on very poor soils, so it can be found in
18
Figure 2. High resolution distribution map for Pinus sylvestris estimating the relative probability of presence. Source:
(Houston Durrant et al., 2016)
Pyrenean oak (Quercus pyrenaica Willd.) is a deciduous and mercescent species distributed throughout the western Atlantic Mediterranean regions: West France, Portugal, Spain and North Morocco (Figure 3). In Spain it occupies 214,000 and 375,300 ha in seedling and coppice forest system respectively (Serrada et al., 2008). Castilla y Leon region in Spain hoard the largest area of the species (67% of its natural distribution area). This oak species is at 400-1600 m.a.s.l. in a sub-humid and continental Mediterranean climate. Mean annual precipitation is 600 mm and summer precipitation is higher than 125 mm (Serrada et al.,
2008). It has a short growing season, which may determine its distribution. Summer
drought is one of its limiting factors, and it avoids the driest areas. Hereafter we will refer to Q. pyrenaica as oak.
Oak is a partially shade-tolerant and intermediate tree between temperate and Mediterranean species, growing prevalently in mid mountain areas on siliceous soils. The root system is strong, equipped with numerous shallow, spreading, stoloniferous secondary roots, and reaches a depth of 50 cm. Thanks its high resprouting capability, the oak forests have been widely managed as coppice with silvo-pastoral uses, such as firewood, livestock
19
Figure 3. High resolution distribution map for Quercus pyrenaica estimating the relative probability of presence. Source: (Nieto Quintano et al., 2016)
Oakand both pines (P. pinaster and P. sylvestris) usually establish spontaneous mixed stands where its natural distribution area coincides. Consequently, forest management strategies during the second half of the twentieth century included re-introducing pine into oak coppice stands as a method of forest restoration and to increase stand productivity. This is the case of the mixed forest stands of the present study. These co-occurring species show different successional and phenological traits which enhance complementarity: light-demanding pine species are dominant in early successional stages, while deciduous oak is a moderately shade-tolerant tree that predominates in the late-successional stage. P.pinaster
and Q.pyrenaica species are widely distributed throughout the Western Spain and occupy
20
Figure 4 Distribution map for Pinus pinaster, Quercus pyrenaica and mixed forest stands of both species in Spain. The study sites are marked with a different color flag. Pictures show thinning intensity.
Vieira et al., (2013) studied growth dynamic for maritime pine based on season and daily variations in stem radius. They mainly determined that radial variation is related with the course of transpiration and thus dependent on temperature and tree water status. Bogino and Bravo, (2008) found that tree-ring growth of maritime pine was positively correlated with rainfall during the growing season and with summer rainfall of previous year, while temperature had a negative effect.
21
Figure 5. Distribution map for Pinus sylvestris, Quercus pyrenaica and mixed forest stands of both species in Spain. The study site is marked by colored flag. Pictures show thinning intensity.
Despite having the ability to reactivate the cambium in autumn season, competition and water deficit appeared to operate as predisposing factors for maritime pine decline in the center of the Iberian Peninsula (Bravo-Oviedo et al., 2006; Prieto-Recio et al., 2015). Accordingly, Bogino et al., (2014) show an inverse significant correlation between δ13C and tree-ring growth for maritime and Scots pine suggesting the negative influence of water deficit on growth. Studies focused on tree response to climatic conditions for maritime pine in mixed forest are scarce. Recent studies evaluated changes in structural heterogeneity, stand productivity and species-specific competition for maritime and Scots pine mixed forest (Riofrío et al., 2017a, 2017b).
Because of its extended distribution area and economic importance, numerous studies were focused on the relationships between climate and tree-ring width for Scots pine. Studies from Central-Europe highlighted the significance of precipitation just before and at the beginning of the growing season to promote radial growth (Oberhuber and Gruber, 2010b; Rigling et al., 2001). Relative air humidity may increase radial increments, while soil water content and air temperature had no influence (Oberhuber et al., 2014; Oberhuber and Gruber, 2010b). Actually, even IADFs were detected in Scots pine due to moist-cool conditions in the middle of the growing season (Rigling et al., 2001).
22
effects should be negative in the warmest climates but strongly positive in the coldest (Rehfeldt et al., 2002). Warm late summer temperatures constrained growth of Scots pine (Sánchez-Salguero et al., 2015), but without cambium reactivation (IADFs) in autumn season as other Mediterranean endemic conifers (Camarero et al., 2010). Although mean day-length seems to be the key factor for wood formation (Camarero et al., 2010), nowadays, Scots pine is also suffering a process of growth decline in marginal areas of its distribution at Mediterranean region, mainly as a result of drought stress (Büntgen et al., 2013; Martínez-Vilalta et al., 2012). The resilience to drought was found to be lower in recent years regardless the tree vigor (Camarero et al., 2018), resulting in reduce latewood density as a way to enhance hydraulic conductivity during dry summers (Candel-Pérez et al., 2018).
Studies of mixed forest stands composed by Scots pine are currently spreading in Europe due to functional advantages compared to monospecific stands. Mixing effect on individual tree structure or crown morphology has been reported by several researches (Pretzsch, 2017, 2014; Pretzsch and Schütze, 2016). Besides, tree species mixing can increase maximum stand density and promote over-yielding (Pretzsch and Biber, 2016; Pretzsch and Schütze, 2016, 2009). Similar results were confirmed in mixed forest stands of Scots pine in Spain (Condés et al., 2013; del Río and Sterba, 2009; Riofrío et al., 2017a). Scots pine-oak mixed stands support higher volume increment per occupied area compared to pure stands suggesting a species interaction with reduced levels of competition in the former (del Río and Sterba, 2009).
In spite of its large distribution area in Spain, the studies of Q.pyrenaica growth are relatively scarce. The effect of climate on spring growth and early wood vessel area for oak species was closely related to precipitation during April and May (García-González and Souto-Herrero, 2017; González-González et al., 2013). According to xylem and wood formation monitoring earlywood growth onset occurred between late-March and early-April, while latewood enlargement ceased at the end of July-mid-August (Fernández-De-Uña et al., 2017; González-González et al., 2013). However, over-aging commonly caused a steep decline in latewood production, acting as a predisposing factor in the decline episode of oak coppice stands (Corcuera et al., 2006). Growth projections reveal local vulnerability of Mediterranean oaks with rising temperatures, resulting in declining trees characterized by a very low production of latewood and a decrease in lumen area of the widest earlywood vessels, suggesting a potential reduction of hydraulic conductivity (Gea-izquierdo et al., 2013; Gentilesca et al., 2017)
23
Thinning improves the growth of the remaining trees by releasing competition for above and belowground resources, including water. Tree respond to thinning treatments depends on the thinning regime (age at the first thinning), intensity, type, and frequency. Thinning treatment for maritime pine forests commonly reduced the density to 150-200 trees per ha when it was 25 years old to ensure a fast growth diameter for resin extraction. Stand density after thinning coincided with the final density of regeneration cutting, but assuming a loss of timber yield in favor of resin production (Serrada et al., 2008).
In pure stands from reforestation, thinning treatments become more important due to the structural characteristics of the stand, even-aged and high densities. The first thinning is made at 20-40 years depending on the site index in a semi-systematic way(del Río et al., 2006). Thinning from below is usually employed due to common low site index, although co-dominant misshapen trees could be also removed. Thinning intensity of first cutting is moderate-heavy removing 25-30 % of initial basal area and chosen 300-400 trees per ha as final crop trees(del Río et al., 2006).
Thinning frequency depends of site index, from 7 years when young trees and high site index for timber production, to 15 years for old trees and low site index (del Río et al., 2006). When thinning frecuency is 5-6 years tree diameter increases from 3-4% to 6-8% of current annual growth (Serrada et al., 2008). The final number of thinning treatments in a stand is usually 3-4 for low or high site index respectively. The usual low wood quality of stems, resinated trees or elevated distance to processing factories, have generated a lack of demand for maritime pine wood and, as a result, a low number of thinning treatments (Serrada et al., 2008).
A large number of thinning experiments were established for Scots pine in the last century across Europe due to the importance of timber quality (del Río et al., 2017a). Occasionally, competition overrides climate as a driver of tree growth for Scots pine (Sánchez-Salguero et al., 2015), hence, highlight the thinning importance. In some experiments, accelerated basal area and volume growth was found for thinning treatments at young stand ages (del Río et al., 2008; Montero et al., 2001). Thinning from below commonly has no effect on the dominant height of the stand (del Río et al., 2008), although significant height growth reductions, as spacing decreases, have been reported for several species (del Río et al., 2017a). Conversely, heavy thinning from below significantly increases the quadratic mean diameter of the stand, but part of this increase is due to the shift caused by eliminate smaller trees (del Río et al., 2017a). Thinning selection from above and heavy intensity, result in greater tree radial increments but usually with associated yield loss at stand level for Scots pine (del Río et al., 2017a, 2008).
24
greater stability (del Río et al., 2017b; Pretzsch et al., 2015), thinning experiments in mixed Scots pine stands are currently scarce (Primicia et al., 2016)
Similarly, there are not too much studies amog thinning treatment effect on oak growth. In Spain, traditional coppice management has declined rapidly since the 1960’s, when the rural population and charcoal demand greatly decreased(Corcuera et al., 2006). These structural changes have also led to new management strategies such as the conversion from overaged coppice stands into high forests and open woodlands through selective thinning, a task which is not always successfully accomplished (Amorini et al., 1996).
Cañellas et al., (2004) reported that the higher oak tree growth was observed under heavy thinning treatment in coppice stands, although no differences were found for stand yield (total basal area and biomass). Remained oak trees from thinning treatment form wider tree-rings, more latewood and multiseriate tree-rings than overaged trees (Corcuera et al., 2006). Besides, the growth enhancement remained 8 years after thinning. Cotillas et al., (2009) also found that selective thinning (20–30% of total stump basal area) improved tree growth for oak mixed coppice stands under natural and under reduced rainfall conditions. Nevertheless, the positive effects of thinning rapidly declined during three years. Moreover, thinning may altere the early-decomposition rate and nutrient immobilization of foliar litter in Mediterranean oak-pine mixed stands (Bravo-Oviedo et al., 2017). The unknown clone factor could mask the results of thinning on oak radial increment. Accordingly, Salomón et al. (2013) proposed thinning or clonal silvicultural treatments in managed oak coppice stands, to control root aging and increase stem growth.
In spite of the amount of studies of thinning effect on monospecific stands, forest management recommendations or silvicultural information for mixed stands studied here are scarce or absent.
1.5. Motivation
25
Objectives
2.1General objective
The main objective of present study was to investigate the radial variation differences among species in Mediterranean pine-oak mixed forest stands. Specifically, we studied the species-specific tree responses to different meteorological conditions and how thinning affects radial increment for coexisting species.
2.2Specific objectives
Exactly we studied the specific objectives shown as follow:
1. Species differences in daily radial variation cycles.
To uncover species-specific weather responses in daily radial variation cycles and to identify the weather variables that drove radial increment. We tested the hypotheses that (i) daily radial variation cycles varied according to seasons and species; (ii) differences were due to species responding differently to daily weather conditions and (iii) temperature and water availability were the main factors limiting radial increment, as expected in Mediterranean areas.
2. Temporal complementarity among species
To decipher temporal complementarity between studied species by species differences in intra-annual cumulative radial increment patterns, and to identify and quantify radial variation synchrony between time series of species. We tested the hypotheses that (i) radial increment onset occurred later for deciduous oak species than for pine, (ii) cumulative radial increment patterns differed by species, with greater radial increment for pine than oak, giving plausible indication of temporal complementarity at certain periods and (iii) we expected that radial variation synchrony was lower between species than within the species.
3. Responses of pine-oak mixed stands to thinning
To evaluate the effects of thinning and weather on inter and, especially, on intra-annual radial increment patterns. We tested the hypotheses that moderate and, particularly, heavy thinning intensity promotes tree radial increment for co-existing species.
2.3Graphic schedule of present research
26
measurements: band or electronic high-resolution point dendrometers. Rounded dark and light green rectangles represents the end of the process until intra-annual radial variation measurements in different temporal scales: daily radial variation cycles or cumulative radial increment patterns. Besides, thinning effect is tested via band dendrometer measurements in different competition situation.
27
Data
3.1. Study sites and experimental design
The field work has been executed in three experimental sites, where different thinning intensities were compared. Two sites where placed in maritime pine-oak mixed forest and another one in Scots pine-oak mixed stand. These mixed stands have a similar history: originally as monospecific pine forestation that has been diversifying over time, allowing the colonization of other species or the recovery of old and previous oak coppice stands. This evolution created mixed stands structure with different situations of dominance between pine and oak trees.
3.1.1.Pinus pinaster -Quercus pyrenaica mixed forest
The study was located at two sites with different drought conditions in central Spain: Lubia (Soria; 41º 39’ N, 2º 29’ W) and San Pablo de los Montes (Toledo; 39º 31’ N, 4º 16.6’W). The Lubia experimental site was located in the Duero Basin at an altitude of 1,134 m.a.s.l. on a continental plateau. This site is characterized by a sub-humid continental Mediterranean climate with an annual rainfall of 512 mm, of which 100 mm falls during the summer drought period, between June and August (AEMET, 2016; Spanish State Meteorological Agency). July is the driest month, with 30 mm rainfall, and May is the wettest month, with 67 mm rainfall. Annual mean temperature is 10.0 ºC, with frost occurring from September to May. The hottest month is July, with an average temperature of 18.9 °C, and the coldest is January, with a mean temperature of 2.3 °C. The soils are regosols and arenosols, characterized by a slightly acidic pH (5–6), sandy texture and low fertility, composed of predominately tertiary and quaternary materials (IGN, 1991). The experimental site was on a flat land.
The other study site was established in the Montes de Toledo mountain range, which separates the drainage basins of the Tagus and Guadiana rivers at 1,102 m.a.s.l. This site has a continental Mediterranean climate, with an average rainfall of 469 mm and a marked summer drought between June and August, with 49 mm recorded rainfall (AEMET, 2016). The driest month is July, with 8 mm, while the month with the highest rainfall is May, with 55± 32 mm. Annual mean temperature is 12.9 ºC and the hottest month is July, with an average temperature of 23.9 ºC. January is the coldest month of the year, with an average temperature of 4.1 ºC. The geological composition of the soil is mainly sandstones and quartzites from the mesozoic period that have given rise to slightly acidic arenosol soils (pH 5-6) (IGN, 1991). The site has a northwest facing aspect and the slope is 21.5%.
28
The forest stands at both sites had a similar origin: a plantation in rows of maritime pine
(Pinus pinaster ssp. mesogeensis) was incorporated into the stand in 1970’s after the removal of
standing oaks. Between the plantation rows, oak sprouts have grown and the stand is currently a mixed stand in rows with a dominant canopy of maritime pine and an understory of oak. Today stand looks as pine-oak even-aged mixed stand of 35-40 years old, although real cambial age differs between species.
Nine rectangular plots (600-800 m2) were established at each site, using a Latin square
design. The experimental design consisted of an unthinned control and two treatments with three replicates each. Moderately and heavy thinning treatment consisted in 25 % and 40% of initial basal area removed respectively (Figure 4).
29
Table 1. Main stand characteristics before and after thinning for the two study sites. Data shown are mean and standard deviation values. Different letters denote significant differences for each site after thinning at the 0.05 significance level.
Pinus pinaster
Quercus pyrenaica Before thinning After thinning
Site Treat. Ho (m)
Density
(n·ha-1)
DBH
(mm)
BA
(m2·ha-1)
Ho
(m)
Density
(n·ha-1)
DBH
(mm)
BA
(m2·ha-1)
Density
(n·ha-1)
DBH
(mm)
BA
(m2·ha-1)
WAI
-0.22
Control 4.8±1.2 2,203±399 45.4±17.9 5.1±1.4 11.0±0.7 1,388±225 182.8±55.6 38.9±5.2 1,388±225c 182.8±55.6a 38.9±5.2c
Moderate 5.7±1.8 2,284±401 55.1±22.9 6.7±1.8 11.0±1.1 1,257±69 185.2±58.7 39.5±6.0 681±77b 221.3±39.9b 29.5±4.3b
Heavy 5.1±1.6 2,406±484 46.5±19.6 6.7±2.8 11.3±1.0 1,228±235 187.7±57.7 39.3±4.9 482±112a 225.5±40.5b 23.4±2.9a
WAI
-0.65
Control 5.8±1.6 2,013±458 65.5±18.6 6.7±1.7 10.9±1.5 591±46 258.8±49.4 32.2±2.8 591±46c 258.8±49.4a 32.2±2.8c
Moderate 5.4±1.5 1,725±366 58.7±17.6 5.5±0.4 11.1±0.8 574±98 252.1±54.0 30.2±1.6 394±63b 272.6±46.0b 23.5±1.1b
Heavy 5.3±1.5 1,633±313 60.6±17.4 5.5±2..1 11.1±1.2 606±45 263.8±51.3 34.2±3.1 301±21a 289.2±37.9b 20.1±0.7a
30
3.1.2.Pinus sylvestris-Quercus pyrenaica mixed forest
The experiment was located in Palacio de Valdellorma (León, 42º 45’ 42.4’’ N, 05º 12’ 39.6’’ W) in north-western Spain (Figure 5). The experimental site was sited at 990 m.a.s.l. in a continental Mediterranean climate. The average annual rainfall is 515 mm with a marked summer drought episode between July and August, when 42 mm of precipitation are usually recorded (AEMET, 2016; Spanish State Meteorological Agency. 2661 weather station code, based on 1981-2010 historical records). Annual mean temperature is 11.1 ºC and the hottest month is July, with an average temperature of 27.4 ºC. The probability of frost period is from December to February. Topography was moderate with a slope of 16% and soils consisted in acid conglomerates based on Miocene clay sediments (IGN, 1991).
Similarly, initially oak coppice stand was harvested during 1970’s and reforestation was carried out by planted pines in rows. Oak coppice sprouts grew again via asexual reproduction between pine rows, so today stand looks as pine-oak even-aged mixed stand of 40 years old, although real cambial age differs between species.
31
Table 2. Main stand characteristics before and after thinning for Scots pine-oak mixed forest. Data shown are mean and standard deviation values. Different letters denote significant differences after thinning at the 0.05 significance level.
Before thinning After thinning
Species Treat. Ho (m)
Density
(n·ha-1)
DBH
(mm)
BA
(m2·ha-1)
Density
(n·ha-1)
DBH
(mm)
BA
(m2·ha-1)
Pinus sylvestris
Control 12.5±1.2 1,415±130 122.1±43.4 19.6±2.3 1,415±130c 122.1±43.4a 19.6±2.3b
Moderate 10.7±1.9 1,575±90 120.6±45.0 19.5±3.9 710±240b 160.1±33.5b 13.7±5.5b
Heavy 11.7±1.7 1,580±130 118.3±42.5 20.9±3.3 390±197a 151.6±35.5b 9.0±4.6a
Quercus pyrenaica
Control 10.9±1.1 2,960±710 59.3±32.6 12.6±1.6 2,960±710b 59.3±32.6a 12.6±1.6b
Moderate 10.7±0.7 2,855±366 66.0±35.8 12.1±1.4 1,195±286a 92.7±46.2b 8.8±1.7a
Heavy 11.3±1.8 2,005±760 66.3±41.0 8.7±5.0 430±427a 93.1±63.4b 4.0±2.9a
32
3.2. Stem radial variation and climatic measurements
3.2.1.Leaf phenological records
Leaf phenological events were visually observed on the main lower branches every two weeks throughout the year for maritime pine-oak mixed forest stands. These events included budburst (breaking up of the scales after bud swelling), twig enlargement (bud elongation and leaf unfolding) and leaf expansion (final stage of leaf extension). Because not all buds or leaves presented the same stage at any given moment during the season, especially at the beginning, we recorded a particular event when more than 50 % of the buds/leaves on the main branches were in the same stage.
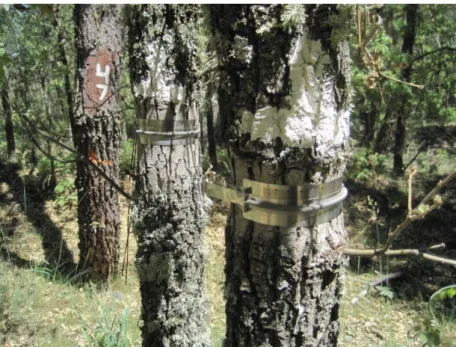
3.2.2.Band dendrometer measurements
After thinning, and three months before sampling (in order to ensure tool stabilization), dendrometer bands (DB 20, EMS Brno) were placed on ten trees per species and plot in maritime pine-oak mixed forest stands (Figure 7 and Table 3). A total of 360 dendrometer bands were fitted at breast height (1.30 m) after smoothing and removal of the outermost dead bark to avoid the influence of hygroscopic bark swelling and shrinkage on dendrometer measurements. Trees were selected within the plot using a stratified sampling approach that took diameter distribution into account and were carefully chosen attempting that local competition was representative to the plot thinning treatment. Dendrometer bands were read every two weeks throughout the year to the nearest 0.1 mm from April 2010 to December 2012.
Table 3. Main characteristics of sampled trees with band dendrometer for maritime pine-oak mixed stands. Data shown are mean values and standard deviation in brackets. DBH: diameter at breast height; Hm: mean height.
Letters denote significant differences between species, thinning treatments and site at the 0.05 significance level.
DBH (mm) Hm (m)
Species Treat. WAI-0.22 WAI-0.65 WAI-0.22 WAI-0.65
Pinus pinaster
Control 216.3 (42.9)d 279.4 (32.0)e 10.1 (0.9)c 11.1 (1.1)d
Moderate 218.7 (38.5)d 264.7 (35.5)e 10.5 (1.1)cd 10.7 (1.1)cd
Heavy 222.5 (37.6)d 288.6 (32.6)e 10.5 (1.2)cd 11.2 (1.5)d
Quercus pyrenaica
Control 86.9 (11.4)a 100.2 (11.0)c 6.2 (0.7)a 7.4 (1.0)b
Moderate 99.3 (17.1)bc 90.6 (10.0)ab 7.1 (1.4)b 7.0 (1.0)b
Heavy 92.3 (17.4)ab 88.0 (16.4)ab 6.6 (1.2)ab 6.9 (1.1)ab
33
Table 4. Main characteristics of sampled trees with band dendrometer for Scots pine-oak mixed stand. Data shown are mean values and standard deviation in brackets. DBH: diameter at breast height; Hm: mean height. Letters
denote significant differences between species and thinning treatment at the 0.05 significance level.
Species Treat. DBH (mm) Hm (m)
Pinus sylvestris
Control 131.9 (34.2) a 11.7 (1.1) ab
Moderate 138.2 (29.2) a 12.6 (1.8) b
Heavy 145.7 (33.1) a 11.1 (0.7) ab
Quercus pyrenaica
Control 117.8 (30.0) a 9.7 (1.5) ab
Moderate 119.8 (26.6) a 10.3 (0.5) a
Heavy 118.2 (28.6) a 10.2 (1.1) ab
Measurements were taken in the morning to reduce diurnal bias, which is caused by stem shrinkage from transpiration. The measurements were corrected for temperature effects and dendrometer thermal expansion (11.2 x 10⁻⁶ mm/ºC). Finally, girth increment data
were transformed to radial increments based on a hypothetic cylindrical tree shape.
Figure 7. Band dendrometer installed in maritime pine-oak mixed forest stands
3.2.3.High-resolution point dendrometers
34
Table 5. Main characteristics of sampled trees with high-resolution dendrometer for the two study sites. Data shown are mean values and standard deviation in brackets. DBH: diameter at breast height; Hm: mean height. Letters
denote significant differences between species and sites at the 0.05 significance level.
DBH (mm) Hm (m)
WAI-0.22 WAI-0.65 WAI-0.22 WAI-0.65 Pinus pinaster 262.7 (21.2)b 274.7 (5.5)b 10.9 (0.9)b 11.5 (0.5)b
Quercus pyrenaica 90.7 (9.1) a 98.3 (2.5) a 7.0 (0.3) a 8.0 (0.6) a
In autumn 2011, we installed electronic point dendrometers (Depfor, University of Huelva, details are available in Vázquez-Piqué et al., 2009) in the selected trees to measure stem radial variation at breast height with a resolution of 1 µm (Figure 8). Dead outermost layers of the bark were carefully removed to avoid cambium damage and to eliminate hygroscopic influences from bark (shrinking and swelling due to change in air humidity) on dendrometer measurements. Data loggers were programmed to record measurements every 15 min for the entire 2012-2014 study period.
Figure 8. Electronic high-resolution point dendrometer installed in maritime pine-oak mixed forest stands
3.2.4. Weather devices and climatic information
35
temperature, precipitation and radiation records were compiled using hourly data from the AEMET automatic network stations (Lubia-Ceder 2044B and San Pablo de los Montes 3298X) located 6 km and 5 km from the WAI-0.22 and WAI-0.65 sites, respectively, to fill gaps in the climate information. Correlation between on-site meteorological records and network station was 0.978 and 0.969 for WAI-0.65 and WAI-0.22 sites respectively. The percentage of records filled from network stations with respect to the total was 9.2 % (9.729 hourly records) and 29.6% (31.169 hourly records) for WAI-0.65 and WAI-0.22 respectively. Mean vapor pressure deficit was also estimated from former weather measurements. We applied indirect method described by Zweifel et al., (2005), to calculate tree water deficit by tree and year, using dendrometer records to quantify drought stress based on potential linear growth (Zweifel et al., 2016).
Drought was limited during the summer of 2010 (dotted red area in Figure 9 and 10), but low autumn rainfall in 2011 and scarce spring precipitation revealed a severe summer drought in 2012 at both sites. 2013 and 2014 years had high winter and autumn rainfall, so summer drought was moderate, but more accused in WAI-0.65 site.
36
Figure 10. Climograms of sampling years for maritime pine-oak mixed forest in WAI-0.65 site. Digits sited on the left side of y-axis are average of daily maximum temperatures of warmest month and average of daily minimum temperatures of coldest month from top to bottom respectively
Temperature and precipitation records were compiled using data from the AEMET automatic network stations (León, Virgen del Camino, 2661). The weather of sampling years (2016-2017) for Scots pine-oak mixed stand was characterized by severe summer drought (Figure 11). However, 2017 was a very dry year due to a low precipitation at the beginning of spring (March-April) and at the end of autumn (October). Besides, average of daily maximum temperatures for warmest month was higher than mean historical records (29.4-28.4 vs. 27.4ºC).
37
Methods
4.1. Spring radial increment onset
With the aim of check species differences and from high-resolution dendrometer data., we defined radial increment onset for trees in maritime pine-oak mixed stands as the first increment observed in the spring season and after that continuous positive daily radial increment took place. Radial increment onset observations generally occurred immediately after a negative radial increment period, which could be driven by the beginning of active water movement in the stem towards upper crown areas (Oberhuber et al., 2014; Zweifel et al., 2000). Conversely, radial increment onset could be masked by rehydration processes, though this generally takes place within a short period of time. We also compared radial increment onset with leaf phenological phases to uncover species functional adjustments. Species differences in radial increment onset were tested by applying non-parametric statistic for the Behrens-Fisher problem, which computes simultaneous confidence intervals and adjusted p-values based on a studentized permutation test for small samples.
4.2. Stem radial variation cycle approach
The sub-hourly values from high-resolution point dendrometers were averaged to hourly resolution to link them with environmental variables, as well as to identify and correct errors or wrong measurements. Gaps of short duration (lower than a day) and abrupt jumps were corrected using an ARIMA model for the trend series from the same tree and season (Van der Maaten et al., 2016). Longer gaps remained unfilled.
Daily radial variation series for each tree and year were processed individually according to the stem cycle approach (Deslauriers et al., 2011; Drew and Downes, 2009; Van der Maaten et al., 2016, 2013), which splits radial variation cycles into three different phases: (1) contraction, the period between the first maximum radius and the next minimum radius; (2) expansion, the period from the minimum to the next morning maximum; and (3) stem radial increment, part of the expansion phase from the time when the stem radius exceeds the morning maximum until the subsequent maximum (Figure 12).
38
Figure 12. Schematic representation of stem daily radial variation cycle, divided into three distinct phases: contraction (grey dots), expansion (white and black dots) and stem radial increment (black dots). Daily amplitude coincides with the magnitude of radial expansion (Rmax - Rmin). Period is the duration of full cycle.
To better describe stem radial variation throughout the year, dendrometer series were divided into five periods or seasons according to Vieira et al., (2013): winter dormancy, during which radius variation was around zero; spring growth, from the start of positive radial increment until the spring maximum; pre-summer contraction, when the daily increment was negative; summer dormancy, when radial increment ceased and autumn, when rehydration occurred and radial increment increased rapidly in a short period of time. Radial variation cycles were defined as a symmetrical sinusoidal waveform for better visualization of daily seasonal cycles.
Species and season differences in amplitude and period for full daily cycles were calculated by applying non-parametric statistics based on global rankings, which compute simultaneous confidence intervals and adjusted p-values based on Tukey contrasts for repeated measurements. Similarly, we calculated species and year differences in magnitude (mm), duration (hours) and number of cycles with the radial increment phase.
4.3. Weather effect on stem radial variation
4.3.1.Weather effect on daily radial variation cycle and increment phase
39
necessary), maximum, and minimum values of meteorological variables were calculated and explored for full daily cycles.
Additionally, previous scatter plots were analyzed to check for possible non-linear relationships between response and weather variables. In this way, exponential model was estimated by means of a logarithmic transformation for respond variable which reduces the model to a linear form. Besides, when logarithm transformation of temperature was considered into account, the value of 5 was added to temperature variable to avoid that the minimum mean hourly temperature value (above -5 ºC) forced a mathematical indeterminacy. We considered three nested random effects: tree nested in site which is nested in year. They are assumed to be with mean 0 and variance defined as positive constant into a diagonal variance-covariance matrix. The final structure for the linear mixed model was as follows:
[1]
where is the amplitude (mm), period (hours) of full radial variation cycle or daily radial
increment (mm), for tree i in site j and year k (mm); and are the intercept regression coefficients for pine and oak, respectively; is a linear function of weather variables; oak is a dummy variable with values of 1 for oak and 0 for pine; ~N (0, ) is the year random effect; ~N (0, ) is the site random effect; ~N (0, ) is the
tree random effect and ~N (0, ) is the error term for each individual i in each site j
for year k.
4.3.2.Weather effect on radial increment rate
Linear mixed models were fitted per species and site to estimate weather and thinning effect on intra-annual radial increment rate based on band dendrometer measurement from maritime pine-oak mixed stand. Meteorological variables were calculated for different ranges of days before the sampling measurement: cumulative or mean weather variables over five, ten, fifteen, and twenty days before each measurement. Multicollinearity was controlled by variance inflation factor values, autocorrelation was assessed by autocorrelation function plot and AIC was employed to find the most parsimonious model. The final structure of the linear mixed model was as follows:
[2]
where ririjk is the radial increment rate for tree i in plot j and year k (mm); are the regression coefficients; and are dummy treatment variables; dbhij is the diameter at breast height (mm); is a linear function of weather variables; ~N (0, ) is the year random effect; ~N (0, ) is the plot random effect; ~N (0, ) is the tree random effect and ~N (0, ) is the error term for each individual i in each plot j