Status Quo of the Influence of Fiscal
Decentralization on Economic Growth
Sonia Esteban Laleona1, Pablo de Frutos Madrazo2, Ma Jos´e Prieto
Jano3
1,2,3
Departamento de Econom´ıa Aplicada, Universidad de Valladolid, Spain.
Abstract Traditionally, the academic debates about the benefits that the
ex-istence of multilevel government structures provide have been directly related to
the gains in efficiency that derive from the processes of decentralization of the
Public Sector. However, as of the last decades, the Public Finance has broadened
its analysis towards other questions, one of them being if the fiscal
decentraliza-tion influences positively in the economic growth of a country. The objective of
this document is to provide a “reading guide” for this new line of investigation
on the influence of fiscal decentralization on economic growth.
Keywords Fiscal Decentralization, Economic Growth.
JEL ClassificationH41, H77, Q26.
1. Introduction
The relationship between fiscal decentralization and economic growth is a
rela-tively new line of investigation. The traditional vision of the Theory of Fiscal
Correspondence to: Sonia Esteban Laleona (e-mail:[email protected]), Pablo de Frutos Madrazo (e-mail:[email protected]),
Federalism, only emphasizes the largest gains of efficiency that derive from the
processes of decentralization of the Public Sector. Nevertheless, in the last decades
a new line of investigation arises that tries to discover if the processes of fiscal
decentralization can, equally, promote the economic growth of a country.
More concretely, this new field of analysis is inspired by the reflections made
by Oates (1993). Oates (1993) argues that if from a static perspective, the main
benefits that derive from the installation of multilevel government systems are
expressed in terms of economic efficiency; then from a dynamic perspective the
potentialities of the fiscal decentralization can be translated in terms of economic
growth.
The transcendency of this document resides in the fact of being able to offer
a “reading guide” that serves as a reference point to be able to investigate how
fiscal decentralization contributes to economic growth and explains the
mecha-nisms involved. In consequence, a rigorous analysis has been made on the most
outstanding empiric investigations about the impact that the existence of
mul-tilevel government structures have on the economic growth of a country. This
document summarises the main results that are derived of all these
investiga-tions, examining, both the temporal and space horizons selected in these studies,
comparing the conceptual framework and the methodology used by the different
authors, evaluating the indicators used in the construction of the “fiscal
decen-tralization” variable and the especification of the growth dependent variable.
2. Conceptual Framework on the Connection between Fiscal
Decen-tralization and Economic Growth
Many of you have discussed the costs and benefits that the establishment of
multilevel government structures provides. In fact, the developed focus up until
recent dates has been centered in analyzing how, from a static perspective,
de-centralization can promote the economic efficiency of the system. The possibility
the individuals of their jurisdictions have been the main argument fenced in
fa-vor of the decentralization of those public goods and services whose benefits have
clear space delimitations. Equally, for the sake of reaching bigger bench marks
of efficiency, the existence of certain public services whose benefits expand along
the whole national territory advises that the government level responsible for its
supply should be at the central level.
It is also necessary to remember that the main issue in the Theory of Fiscal
Federalism is not simply the dichotomy between centralization and
decentraliza-tion. Each government level has an important role to carry out. The challenge
that should be reached is to assign the responsibilities and the authority for
government’s functions to the appropriate levels. From this perspective, fiscal
institutions should be designed to be able to incorporate incentives so that the
governing class can select policies that promote the economic growth of their
regions. In this sense, the traditional vision of the Theory of Fiscal Federalism
develops new lines of investigation, amongst those we can outline if fiscal
decen-tralization promotes economic growth.
Concretely, in the last decades, one of the most concerning matters, in
differ-ent international organizations is to determine if the economic activity of inferior
units of government can, to a certain point, foment the economic growth of a
country. To this respect, the intents to establish a connection between the
phe-nomena of the economic growth and the fiscal decentralization have been more
an intuitive question than a normative work.
The idea that underlies in this branch of the analysis of the Fiscal
Federal-ism is that, if from a static front, the fiscal decentralization of the Public
Sec-tor promotes the economic efficiency, from a dynamic one it is able to promote
economic growth (Oates (1993)). The sub-central administrators know the
ne-cessities of infrastructures of their territories better than the central government
and, therefore, they can satisfy them, in a greater measure. Equally, economic
economic growth and of fiscal decentralization: interpreting this last idea as a
superior good (Bahl and Linn 1992). Only in countries with relatively high per
capita income levels decentralization ends up being attractive, in the sense that
its benefits can be much more exploited that their disadvantages. Nevertheless,
like Oates (1999) exposes, the relationship among the income level per capita of
a country and the grade of decentralization of its Public Sector should not be
interpreted as a monolithic relationship. It is not true that the decentralization
is intensified without limits depending on level of income of a country but rather
an optimal level of fiscal decentralization has to exist to be able to maximize the
economic growth of a country.
3. Theoretical Reference Model on the Connection between Fiscal
Decentralization and Economic Growth
Currently, economic literature provides two approaches for the impact that
fis-cal decentralization provokes one country’s economic growth versus endogenous
growth models. According to this classification, the previsions of the different
models of economic growth are conditioned, mainly by the hypothesis of the
function of production used and by the endogenous character or not of certain
economic variables. While neoclassical economists granted a small space to the
public intervention, endogenous models growth support that public policies can
affect long-term growth rates.
In a neoclassical environment, where variables economic determinants of growth
are considered as exogenous determinants, Solow’s, model (1956) and the changes
posed by Mankin, Romer and Weil (1992) is presented as the more
representa-tive to identify analytically the possible influence of the tax decentralization on
economic growth. Using a production function with perfect substitution among
en-gine of long term growth is only determined by exogenous technology changes1.
Therefore, in the neoclassical model of Solow, the instrumentation of policies to
encourage savings and investment has no place and therefore, positive impact on
the long-run rate2. Income on a declining scale in capital accumulation are key in
these models after setting up the connection exclusive between the rate of growth
and technological progress.
This framework is used by Thieben (2003), Eller (2004), Martinez Vazquez
and Macnab (2003), among others, to determine if there is a connection between
the tax decentralization and economic growth. The cornerstone of these works is
to admit that the exogenous parameter reflects not only technological aspects of
the economy but also an economic performance of the Public Sector.
For its part, the emergence of endogenous growth models in the mid 1980s
gives way to a new wave of research on the impact that results in the performance
of the Public Sector on the rate of growth of the economy. The main difference
of these models from neoclassic approaches is that these new models of economic
growth show a positive long-term growth rate without having to assume that some
of variables of the model increase in an exogenous way but in an endogenous one.
In an environment of endogenous growth, the theoretical models that analyze
the influence causing the processes of fiscal decentralization in economic growth
are supported analytically by the model initially developed by Rebelo (1991)
and it is known as the AK’s technology3. The Most relevant feature of the AK’s
1
The model provided by Solow (1956) uses an economy characterized by perfectly competitive markets of capital and labour, flexibility in pricing, the existence of full employment and a production function with constant returns to scale aggregated where productive factors are diminishing , allowing a perfect replacement between capital and labour.
2 Greater savings alone will affect product level but not the rate of growth insteady
state. Steady state is characterized by a time when the economy is situated at a specific level, it stops the process of capital accumulation the technological development is the only source of economic growth.
3
model is that they maintain the neoclassical assumptions of perfect competition
and constant returns to scale and is reflected in diminishing returns to capital4.
From a perspective of endogenous economic growth, the model that supplies
Barro (1990) becomes the starting point of this new wave of research. The main
characteristic of Barro (1990) model is to incorporate in its role.
The production of public services as a productive input for private production.
The productive role of public services is precisely that creates a direct connection
between spending and economic growth. Nevertheless, and despite the relevance
of the contributions of Barro (1990), endogenous growth models developed to
date did not stopped in determining whether a Government, characterized by a
multilevel governance structure, could affect the economic progress of a country.
It will be in the last nineties of the last century when different authors used
the contribution of Barro (1990) to extend the analysis of economic growth to an
extension of the literature of fiscal federalism. Zhang and Zou (19998) Davoodi
and Zou (1998), Xie, Zou Davoodi (1999), Zhang and Zou (2001), Akai and Sakata
(2002) are among others, the authors who have tried to establish whether there
really is a connection between the process of decentralization of public spending
and economic growth. All agree the use of the model of Barro (1990) as an
analytical tool to demonstrate the contribution of decentralization in economic
growth5.
zero. The characteristic more important of these models is that many of the factors under the neoclassical model only affecting the level of income, now also affect the rate of growth of this. In addition, these models provide freedom for the policies that affect savings and investment have an effect on the countries’ long-run growth rate.
4
AK model is the simplest contribution endogenous growth theory. This approach is attributed to Rebelo (1991) who considered that the only way to achieve positive growth rates in a model with constant returns to scale, was to present the production function with constant returns to scale in relation to the factor which must be accumulated.
5
Under this specification, Zhang and Zou (1998) used in their model a
pro-duction function where public input is assigned by the central Government and
by local and intermediate levels6. According to the model developed by Zhang
and Zou (1998), fractions of public expenditure to be allocated to each level of
Government in order to maximize economic growth in a country are equal to
the ratios of individual productivity over the aggregate productivity. So that, if
current spending shares do not correspond with these growth-maximizing shares,
the Government should proceed to a reallocation between the three levels of
Government to improve the country’s growth.
4. Empiric Evidence on the Connection between Fiscal
Decentraliza-tion and Economic Growth
The intuition that the processes of decentralization can potentialize the economic
growth of a country has originated, by the middle of the nineteen-nineties,
differ-ent works whose purpose was to contrast its empiric validity. With the purpose
of making the interpretation of the results reached in different studies easier, we
can establish the following classification. On one hand, the investigations that
center their interest in analyzing the relationship between fiscal decentralization
and economic growth from an international focus. On the other hand, studies
that limit themselves to verify the impact that multilevel government structures
causes in the growth of a certain country.
From an international perspective (studies among countries), there are a range
of studies that reflects in quantitative terms the existent relationship between
fiscal decentralization and economic growth. The most outstanding contributions
correspond to Oates (1995); Phillips and Woller (1997); Davoodi and Zou (1998);
Yilmaz (1999); Thieben (2000; 2003; 2005) Mart´ınez-V´azquez and M. McNab
6
(2003); Iimi (2006); Bodman and Ford (2006) and Thornton (2007), such and
like it is shown in the Table 1.
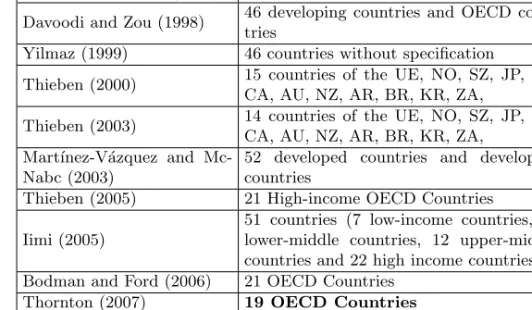
Table 1: Data coverage - Status Quo of the studies among countries. Source: self-elaboration.
Author Space field Time field
Oates (1995) 40 countries without specification 1974-1989
Phillips and Woller (1997) 23 countries LDC 1974-1991
Davoodi and Zou (1998) 46 developing countries and OECD
coun-tries 1970-1989
Yilmaz (1999) 46 countries without specification 1971-1990
Thieben (2000) 15 countries of the UE, NO, SZ, JP, US,
CA, AU, NZ, AR, BR, KR, ZA, 1975-1995
Thieben (2003) 14 countries of the UE, NO, SZ, JP, US,
CA, AU, NZ, AR, BR, KR, ZA, 1973-1998 Mart´ınez-V´azquez and
Mc-Nabc (2003)
52 developed countries and developing
countries 1972-1997
Thieben (2005) 21 High-income OECD Countries 1973-1998
Iimi (2005)
51 countries (7 low-income countries, 10 lower-middle countries, 12 upper-middle countries and 22 high income countries.
1997-2001
Bodman and Ford (2006) 21 OECD Countries 1981-1998
Thornton (2007) 19 OECD Countries 1980-2000
LDC = Least Developed Counries; OECD = Organisation for Economic Co-operation and Develop-ment; UE = European Union; NO =Norway; SZ = Switzerland; JP = Japan; US = United States; CA = Canada; AU = Australia; NZ = New Zealand; AR = Argentina; BR = Brazil; KR =Korea; ZA = South Africa.
The remaining investigations center their interest in determining the
connec-tion of both processes from a regional or naconnec-tional perspective (the single country
analysis), as one can observe in Table 2:
1. The behavior of the Chinese economy is analyzed in the studies of Zang and
Zou (1998); Jin, Quian and Weingast (1999); Lin and Liu (2000); Zhang
and Zou (2001) and Jin and Zou (2005)
2. The influence of the process of fiscal decentralization in the economic
Davoodi (1999), Akai and Sakata (2002) and Akai, Nishimura and Sakata
(2004).
3. Behnisch, B¨uttner and Stegarescu (2003) analyze the German experience.
4. The repercussion of fiscal federalism in the economic performance of the
Swiss Cantons is studied in Feld, Kirchg¨assner and Schaltegger (2004).
5. The behavior of regions of India in connection with economic growth is
interpreted by Zhang and Zou (2001).
6. The evidence of regional growth in Russia is studied in the investigation of
Desai, Freinkman and Golberg (2003).
7. Finally, Carrion-i-Silvestre, Espasa and Mora (2006), P´erez and Cantarero
(2006), Sol´e-Oll´e and Esteller-Mor´e (2006) and Esteban (2006) are among
the most recent studies, and they indicate the effect that fiscal
decentral-ization has caused in the economic growth of the Spain.
5. Chosen Variables
The previous spatial grouping is fundamental when examining the suitability of
the variables used by the different authors. The Table 3 picks up the dependent
and fiscal variables used, as well as the statistical sources that this data proceeds
from.
5.1. Dependent variable
As depicted in Table 3 the dependent variable used in the majority of the
stud-ies among countrstud-ies is the growth rate of real Gross Domestic Product (GDP)
per capita, coming from International Financial Statistics of the international
Monetary Fund or of World Development Indicators of the World Bank (GDP).
Nevertheless, exceptions are Phillips and Woller (1997), Mart´ınez-V´azquez and
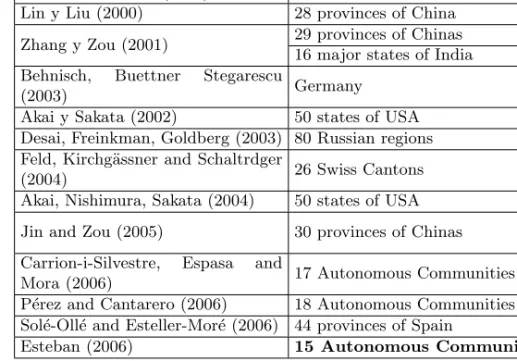
Table 2: Data coverage - Status Quo of the single country analysis. Source: Self-elaboration.
Autor Space field Time field
Zhang and Zou (1998) 28 provinces of China 1980-1992
Jin, Quian y Weingast (1999) 29 provinces of Chinas 1982-1992
Xie, Zou, Davoodi (1999) 50 states of USA 1948-1994
Lin y Liu (2000) 28 provinces of China 1970-1993
Zhang y Zou (2001) 29 provinces of Chinas 1987-1993
16 major states of India 1970-1994
Behnisch, Buettner Stegarescu
(2003) Germany 1950-1990
Akai y Sakata (2002) 50 states of USA 1992-1996
Desai, Freinkman, Goldberg (2003) 80 Russian regions 1996-1999
Feld, Kirchg¨assner and Schaltrdger
(2004) 26 Swiss Cantons 1980-1998
Akai, Nishimura, Sakata (2004) 50 states of USA 1992-1997
Jin and Zou (2005) 30 provinces of Chinas 1979-1993
1994-1999
Carrion-i-Silvestre, Espasa and
Mora (2006) 17 Autonomous Communities
1980-1998 1991-1996
P´erez and Cantarero (2006) 18 Autonomous Communities 1986-2001
Sol´e-Oll´e and Esteller-Mor´e (2006) 44 provinces of Spain 1976-1998
Esteban (2006) 15 Autonomous Communities 1997-2001
GDP per capita (GDP´). Alternatingly, Thieben (2000;2003;2005) uses different
indicators to reflect the growth rate of the economy of a country. This is,
aver-age growth rate of real gross fixed capital formation - deflated by the producer
price index - (GKAP), total factor productivity growth derived as a component
of a macroeconomic production function, (TFPG) and average gross investment
share of GDP (INVGDP). On the other hand, Iimi (2005) and Thornton (2007)
use the average growth rate real of GDP per capita for each country (GDP).
With the same approach, in single-countries studies, the dependent variable
used is the growth rate of real province (state) income (GYPREG) that comes
from the Official Institutes of Statistic of the considered country (Table 4).
Nev-ertheless, Behnisch, B¨uttner and Stegarescu (2003) opt to use “the rate of total
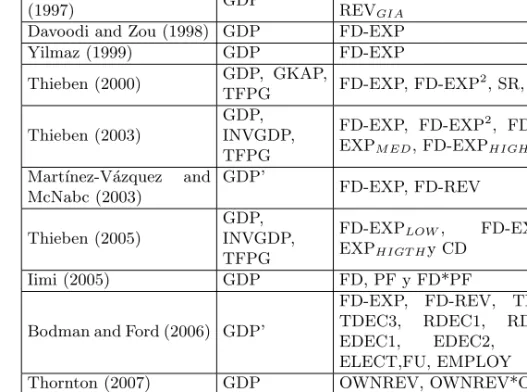
se-Table 3: Chosen Variables - Status Quo of the studies among countries. Source: Self-elaboration.
Author Dependent
variable
Explanatory variable of the fiscal de-centralization
Oates (1995) GDP FD-EXP, SR
Phillips and Woller
(1997) GDP’
FD-EXP, FD-EXPN DEF, REV, FD-REVGIA
Davoodi and Zou (1998) GDP FD-EXP
Yilmaz (1999) GDP FD-EXP
Thieben (2000) GDP, GKAP,
TFPG FD-EXP, FD-EXP
2
, SR, CHSR
Thieben (2003)
GDP, INVGDP, TFPG
FD-EXP, FD-EXP2, FD-EXPLOW,
FD-EXPM ED, FD-EXPHIGH, FD-REV, SR
Mart´ınez-V´azquez and McNabc (2003) GDP’ FD-EXP, FD-REV Thieben (2005) GDP, INVGDP, TFPG
FD-EXPLOW, FD-EXPM ED, FD-EXPHIGT Hy CD
Iimi (2005) GDP FD, PF y FD*PF
Bodman and Ford (2006) GDP’
FD-EXP, FD-REV, TDEC1, TDEC2, TDEC3, RDEC1, RDEC2, RDEC3,
EDEC1, EDEC2, FD, NSGUT,
ELECT,FU, EMPLOY
Thornton (2007) GDP OWNREV, OWNREV*OWNREV
GDP= Rate Gross Domestic Product per capita; GDP’= logarithm real of rate Gross Domestic Product per capita; GKAP= average growth rate of real gross fixed capital formation; TFPG = total factor productivity growth; INVGDP = average gross investment share of real gross domestic product; FD-EXP/ FD-REV = share of sub-national government expenditures/revenues in general government expenditures/revenues, net of intergovernmental transfers; SR = share of own revenues of lower levels in their total revenues; FD-EXPN DEP= ratio of local government expenditures to total government
expenditures minus defense and social security expenditures; FD-REVGIA= ratio of local revenues
minus grants-in-aid to total government revenues; FD-EXP2 = transformation indicator FD-EXP to test for “hump-shared” relationships between economic performance and fiscal decentralization; CHSR = indicator to test whether increasing self-reliance of subnational governments have effects on economic growth; FDLOW/ FDM ED/ FDHIGH= theree dummy variables that are denoted for “low
lect “industrial output of the iit region” deflated by the regional price deflator.
And lastly, in the Spanish case, Sol´e-Oll´e and Esteller-Mor´e (2006) elaborate two
indicators that pick up investments by all the levels of government divided by
the previous year‘s capital stock. These indicators reflect two different types of
spending categories: roads (Iitr/Rit−1) and education (Iite/Eit−1).
5.2. Explanatory Variables
As for the explanatory variables that reflect the growth rate of an economy, the
main divergences are in the definition of the fiscal decentralization indicators.
In the studies among countries, picked up in the Table 3, the database more
widely used is The Government Finance Statistics (GFS) of the International
Monetary Fund (IMF). Most authors choose the budget data approach and they
approximate the degree of fiscal decentralization using the share of sub-national
government expenditures/revenues in general government expenditures/revenues;
net of intergovernmental transfers (FD-EXP or FD-REV).
Nevertheless, in certain investigations, together with these indicators, other
types of statiscal are included. This way, Oates (1995) uses an alternative
mea-surement for the independence of sub-national levels. This author employs the
“self-reliance” ratio (SR), as the share of own revenues of lower levels in their
total revenues.
Phillips and Woller (1997), on the other hand, build two additional variables
of fiscal decentralization. On one hand, the ratio of local government expenditures
to total government expenditures minus defense and social security expenditures
(FD-EXPN DEP). On the other one, they design a variable (FD-REVGIA) by
means of the transformation of the conventional indicator of tributary
decen-tralization (FD-REV). Concretely, FD-REVGIA is defined as the ratio of local
revenues minus grants-in-aid to total government revenues.
In turn, Thieben (2000) chooses different measures of fiscal decentralization.
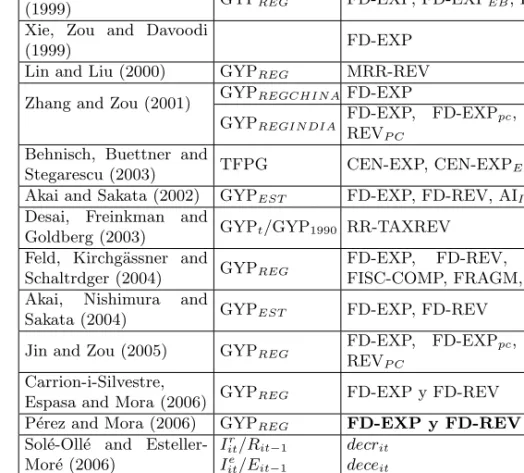
Table 4: Chosen Variables - Status Quo of single-country analysis. Source: Self-elaboration.
Author Dependent
variable
Explanatory variable of the fiscal decentralization
Zhang and Zou (1998) GYPREG FD-EXP, FD-EXPEB, FD-EXPB+EB Jin, Quian and Weingast
(1999) GYPREG FD-EXP, FD-EXPEB, FD-EXPB+EB
Xie, Zou and Davoodi
(1999) FD-EXP
Lin and Liu (2000) GYPREG MRR-REV
Zhang and Zou (2001) GYPREGCHIN A FD-EXP
GYPREGIN DIA FD-EXP, FD-EXPpc, FD-REV, FD-REVP C
Behnisch, Buettner and
Stegarescu (2003) TFPG CEN-EXP, CEN-EXPEP&SC Akai and Sakata (2002) GYPEST FD-EXP, FD-REV, AII, AIII, PRI Desai, Freinkman and
Goldberg (2003) GYPt/GYP1990 RR-TAXREV Feld, Kirchg¨assner and
Schaltrdger (2004) GYPREG
FD-EXP, FD-REV, MAT-GRANTS, FISC-COMP, FRAGM, URBAN Akai, Nishimura and
Sakata (2004) GYPEST FD-EXP, FD-REV
Jin and Zou (2005) GYPREG FD-EXP, FD-EXPpc, FD-REV, FD-REVP C
Carrion-i-Silvestre,
Espasa and Mora (2006) GYPREG FD-EXP y FD-REV P´erez and Mora (2006) GYPREG FD-EXP y FD-REV
Sol´e-Oll´e and Esteller-Mor´e (2006)
Ir it/Rit−1
Iite/Eit−1
decrit
deceit
Esteban (2006) GYPREG DESCgasto
GYPREG= the growth rate of real state income; TFPG = the rate of total factor productivity growth;
Ir it/R
;
it−1Iite/Eit−1= two indicators that pick up investments by all the levels of government divided by the year’s capital stock ; FD-EXP/FD-REV = share of expenditures/revenues by each level of government in consolidated government expenditures/revenues across all levels; FD-EXPEB,
FD-EXPB+EB, FD-REVP C, CEN-EXP, CEN-EXPEP&SC= derivations of the indicator
FD-EXP/FD-REV; MRR-REV = the marginal retention rate of locally collected budgetary revenue; AII= the ratio
of government’s own revenue to total revenue, with revenues excluding federal grants; AIIII= the
ratio of local government’sown revenue to total revenue with revenues including federal grants; PRI = the decentralization measure that incorporates both revenues and expenditure shares. The indicator is defined as the mean of FD- EXP and FD-REV; RR-TAXREV = the tax revenue retention rate; MAT-GRANTS = the matching grants per capita received in each Swiss Canton; FIS-COMP = the indicator indicates that the higher difference of average tax burden of the neighboring cantons, the higher the pressure of tax competition on the cantonal and local tax authorities; FRAGM = the number Communes in a Canton divided by population; URBAN = the share of people living in urban areas;decrit/deceit= two indicators that reflect the moment in that decentralization took place
in the responsibilities of road (decrit) and education (deceit)in each one of the Spanish regions;
SR). On the other hand, it makes a simple transformation indicator of FD-EXP
to test for “hump-shaped” relationships between economic performance and
fis-cal decentralization (FD-EXP2). Finally, he elaborates an indicator (CHSR) to
test whether increasing self-reliance of subnacional governments have effects on
economic growth.
Additionally, Thieben (2003; 2005) uses in an alternative way,together with
the indicators of fiscal decentralization already employed in the year 2000, three
dummy variables that are denoted FD-EXPHIGH for “high degree of fiscal
de-centralization”, FD-EXPMED for “medium degree of fiscal decentralization” and
FD-EXPLOW for “low degree of fiscal decentralization”. In turn, for Thieben
(2005) the model is augmented with a variable dummy (CD), which is assumed
as 1 if the governmental system is centralised and 0 if it is federal.
Iimi (2005) incorporates a measure of “political freedom” (PF) that reflects
the degree of political devolution at the municipal level. The reason is that
po-litical freedom is closely linked with decentralization mechanisms and thus with
economic growth in the following sense. “Firstly, one might think that the
ben-efits of fiscal decentralization depend on how much political freedom to country
enjoys. If freedom is low, the benefits based on the Tiebout mechanism may not
be strongly realized. If freedom is high, the benefits may be realized” (Iimi 2005,
453). According to this perspective, an interaction term FD*PF should be of
par-ticular interest, since it allows us to test the hypothesis of fiscal decentralization
and political freedom as complementary.
Bodman and Ford’s (2006) analysis incorporates traditional measures of
fis-cal decentralization (FD-EXP and FD-REV) and a number of new measures that
attempt to account for different degrees of sub-national fiscal autonomy. The
di-mension of fiscal decentralization considered in this study, and the most
impor-tant dimension, is the extent to which fiscal decision-making is decentralised. This
paper presents three measures of tax revenue (tax-only) decentralization:
total subnational tax revenue (TDEC3), all calculated as the share of general
government tax revenue. On the other hand, own taxes refer to those taxes for
which the sub-national government can determine the tax rate or tax bases or
both (RDEC1, RDEC2 and RDEC3).
Bodman and Ford’s (2006) study also provides two measures of expenditures
decentralization. These measures are based on total sub-national expenditure
and lending, minus loan repayments, as a percentage of consolidated general
gov-ernment expenditures, without social security payment (EDEC1 and EDEC2).
EDEC1 excludes transfers to other levels of government, whereas EDEC2 includes
transfers to other levels of government net of received transfers.
Futhermore, Bodman and Ford’s (2006) paper uses “hump-shaped”
indica-tores based on the traditional budget dates measures. The countries were divided
into five equal sized groups, denoting very low, low, medium, high and very high
decentralization (FD).
Finally, a number of other measures of government decentralization, omitted
from previous studies of federal decentralization and growth, are considered in
the Bodman and Ford’s (2006) paper:
1. The number of sub-national jurisdictions in the intermediates and lower
tiers of government is considered (NSGVT);
2. An indicator was included to account for electoral decentralization (ELECT).
Taking the value of 0 if there are no sub-national elections, 1 if either local
or intermediate tiers of government are elected, or 2 if both are subject to
elections;
3. The indicator of constitutional structure is an index of federalism, one to
five - point scale(FU): (1) unitary and centralized; (2) unitary but
decen-tralized; (3) semi-federal; (4) federal but centralized and (5) federal and
decentralized;
4. Resource decentralization is considered using the ratio of sub-national
And, lastly, the independent variables of decentralization of Thornton’s (2007)
study are the average tax revenue of sub-national governments stemming from
the tax bases and tax rates over which they have full discretion, OWNREV, and
a variable to test for the notion of “hump-shaped” relation between fiscal
decen-tralization and growth proposed in Thieben’s (2003) study, which is a quadratic
indicator of OWNREV, (OWNREV)*(OWNREV).
If we center in single-countries studies, reflected in Table 4, the indicators
that are used mostly are the shares of spending/revenues by each level of
gov-ernment in consolidated govgov-ernment spending/revenues across all levels, both in
absolute terms as in values per capita, or their derivations (FD-EXP; FD-REV).
Nevertheless, in Akai and Sakata (2002), apart from the conventional
indica-tors of revenues (FD-EXP) and expenses (FD-REV), they also elaborate three
additional statistical. On one hand, those that seek to reflect the grade of
fis-cal autonomy of a sub-central government in a State (“AI” and “AII”). On the
other hand, a normalized statistical one (PRI) which reflects both revenue and
expenditure aspects of fiscal decentralization.
“AI” is defined as the ratio of local government’s own revenue to total revenue,
with revenues excluding federal grants; “AII” is the ratio of local government’s
own revenue to total revenue, with revenues including federal grants; and “PRI”
represents a decentralization measure that incorporates both revenue and
expen-diture shares. The production-revenue indicator (PRI) is defined as the mean of
FD-EXP and FD-REV.
On the other hand, Lin and Liu (2000) and Desai, Freinkman and Goldberg
(2003) apply an alternative focus of the measure of decentralization fiscal applied.
In the first study, the fiscal decentralization measure is “the marginal retention
rate of locally collected budgetary revenue” (MRR-TAXREV). In this study, the
fiscal decentralization measure is determined by how much of the revenue
in-crements were kept by provincial governments. Whereas Desai, Freinkman and
reten-tion rate” (RR-TAXREV). This variable reflects only official taxes, collected and
accounted for in regulating government budgets.
In an alternative way, Feld, Kirchg¨assner and Schaltegger (2004) depict the
grade of fiscal decentralization by means of the application of six alternative
statisticals. These authors use the habitual indicators of revenues and expenses
used in the literature (FD-EXP and FD-REV) and four more that capture
con-crete aspects of the Swiss model of decentralization. The first statistical
(MAT-GRANTS) reflects the matching grants per capita received in each Swiss Canton.
This variable reflects the financial importance that the matching grants have in
the model of cooperative federalism in Switzerland. The second indicator
(FISC-COMP) indicates that the higher the difference of average tax burden of the
neighboring cantons, the higher the pressure of tax competition on the cantonal
and local tax authorities. More concretely, this variable is measured by the
differ-ence of canton’s tax, in the highest income tax bracket of a million Swiss francs
annual taxable income, and the average of its neighboring cantons’ tax burden
in that bracket. On the other hand, the variable fragmentation (FRAGM) is
constructed by the number Communes in a Canton divided by population. It is
supposed to capture the lack of exploiting economic of scale. Lastly, Urbanization
(URBAN), measured by the share of people living in urban areas, is included to
represent the new field of economic geography that reflects that urban economic
centres develop more strongly that the periphery.
On the other hand, Sol´e-Oll´e and Esteller-More (2006) opt, for the Spanish
case, for the definition of two variable Dummies. These indicators reflect the
moment in that decentralization took place in the responsibilities of road and
education in each one of the Spanish regions. “dcrit” is a dummy equal to 1
if the regional government has the responsibility of providing regional roads.
Alternatively, “decei”t is weighted sum of a dummy equal to 1 if the regional
government has the responsibility of providing primary and secondary education,
providing higher education, with the weights being the average share of both
education levels in total education investment.
Finally, Esteban (2006) uses as a variable of fiscal decentralization the
per-centage of public expense attributed to Spanish Autonomous Communities with
respect to the total of government expenditure in these Communities (DESCgto).
6. Conceptual Framework Employed
The theoretical model mostly backed by economists has been that of Davoodi and
Zou (1998). The theoretical framework in which these authors sustain is the
en-dogenous growth model of Barro (1990), where the production function has
mul-tiple inputs including private and public spending. This perspective is adopted by
Davoodi and Zou (1998); Zhang and Zou (1998); Xie, Zou and Davoodi (1999),
Zhang and Zou (2001)7; Akai and Sakata (2002), Akai, Nishimura and Sakata
(2004)8 Iimi (2005); Jin and Zou (2005); Carri´on-i-Silvestre, Espasa and Mora
(2006); P´erez and Cantarero (2006); Esteban (2006). Concretely, in the model of
Davoodi and Zou (1998), the public spending is divided in three government
lev-els and the spending shares are determined assigned at the different government
levels with the macroeconomic objective of maximization of the growth. The
model’s essential implication is that for a given share of total government
spend-ing to GDP, the growth-maximizspend-ing government budget shares are proportional
to the relative productivity of federal and local level governments9.
7
In turn, Zhang and Zou (2001) outline a greater complexity in the question of the sub-central government expenditure, that augments the aforementioned approach and develops a model that links multiple sectors of public spending by multiple levels of government to economic growth.
8
Equally, Akai, Nishimura and Sakata (2004) referring to Barro (1990) developed a model, which considers differences in the quality as well as complementarities of public services.
9
On the other hand, the studies of Lin and Liu (2000), Mart´ınez-V´azquez and
M.Mcnab (2003), Thieben (2003; 2005)); Feld, Kirchg¨assner and Schaltradger
(2004) and Bodman and Ford (2006) use a different approach. Following Mankiw,
Romer and Weil (1992), these authors use the model of exogenous growth of Solow
(1956) and they introduce the fiscal decentralization as a variable explanatory of
the growth rate of output per capita. The cornerstone of these last works is to
admit that the exogenous parameter not only reflects technological aspects of the
economy but also a measure of the economic performance of the decentralized
Public Sector. i.e. the level of technology reflects not just technology but also
differences in resource endowment and institutions across countries/regions and
over time, as well as in other non-observable countries/region-specific
character-istics. This disintegration of the term “technological progress” is consistent with
the economic literature about the growth and with the hypotheses of conditional
convergence (Barro, 1991; Sala-i-Martin, 1994).
In any case, the previous studies probably use a theoretical framework ad-hoc,
since they don’t allow to identify the causes of the estimated effect of
decentral-ization in the economic growth of a country. In this sense, the procedure used by
Soll´e-Oll´e and Esteller-Mor´e (2006) is quite different to that employed in
previ-ous investigations. Soll´e-Oll´e and Esteller-Mor´e (2006) consider the assignment
process among alternative investments and, then, they compare it with the effect
that this assignment process causes in decentralized decision-taking scenario as in
another centralized. In this point of the analysis, if the assignment process differs
among the two contexts of decision-taking, they are able to identify the
ineffi-ciency taken place under the centralized government structure. Also, combining
the obtained results with the estimates of the effects of the outlined alternative
investments (roads and education) on the economic growth, they can determine
the gain from the output due to the better assignment in the investments in the
decentralized decision-taking scenario.
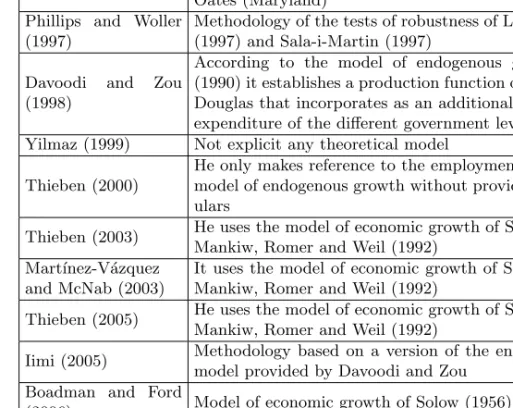
Table 5: Analytical Framework - Status Quo of the studies among countries.Source: Self- elaboration.
Author Analytical Framework
Oates (1995) Dissertation of the investigation made by Sang Loh Kim and Oates (Maryland)
Phillips and Woller (1997)
Methodology of the tests of robustness of Levine and Renett (1997) and Sala-i-Martin (1997)
Davoodi and Zou (1998)
According to the model of endogenous growth of Barro (1990) it establishes a production function of the type Cobb-Douglas that incorporates as an additional input the public expenditure of the different government levels
Yilmaz (1999) Not explicit any theoretical model
Thieben (2000)
He only makes reference to the employment of a theoretical model of endogenous growth without providing more partic-ulars
Thieben (2003) He uses the model of economic growth of Solow enlarged by Mankiw, Romer and Weil (1992)
Mart´ınez-V´azquez and McNab (2003)
It uses the model of economic growth of Solow enlarged by Mankiw, Romer and Weil (1992)
Thieben (2005) He uses the model of economic growth of Solow enlarged by Mankiw, Romer and Weil (1992)
Iimi (2005) Methodology based on a version of the endogenous growth model provided by Davoodi and Zou
Boadman and Ford
(2006) Model of economic growth of Solow (1956) Thornton (2007) Not explicit any theoretical model
Among the two most backed theoretical focuses, models of endogenous court
vs. models of exogenous court, it seems that there is a clear preference to
con-trast the influence of the processes of fiscal decentralization empirically on the
economic growth from an environment of endogenous growth. Concretely, like it
is reflected in the Tables 5 and 6, the fact stands out that most of the studies
(1990), where the government expenditure assigned at each government level is
added to the production function as one more productive input.
7. Empiric Methodology
The econometric specifications that are used, mainly refer to two particular
proce-dures in the treatment of the data: regressions with cross-section data as opposed
to those that are solved on a panel of data.
In the panels of data the variables of annual frequency are usually used.
Although, it is true that, it is possible to establish panels with data averages
of more than a year of frequency, with the purpose of grasping the possibility
of the long term effects. This is the case detected in Davoodi and Zou (1998)
and Phillips and Woler (1997) who use a panel with data averaging a five-year
or decenal frequency, in the first case; and of annual frequency, triennial and
five-year, in the second case.
The pros and contras of these two types of data treatment are discussed in
the investigations of Thieben (2000; 2001). This author grants, in both studies,
a bigger priority to the regressions of cross-section with data annual averages.
However, in spite of most authors lean for the methodology applied on panel
data, Akai and Sakata (2002) use regressions with cross-section data and they
introduce a variable dummy that picks up the specific characteristics of each
country.
Regarding the estimator used by different authors, the estimador of Ordinary
Least Square (OLS) is the one that prevails in most of studies. Nevertheless, the
exceptions of this estimator appear depicted in Tables 7 and 8. For example,
Zhang and Zou (1998), Yilman (2000) and Thieben (2000) use the estimator of
General Least Square (GLS); Akai, Nishimura and Sakata (2004) opt for
Max-imum Likelihood (ML) estimation; Desai, Freinkman and Goldberg (2003) use
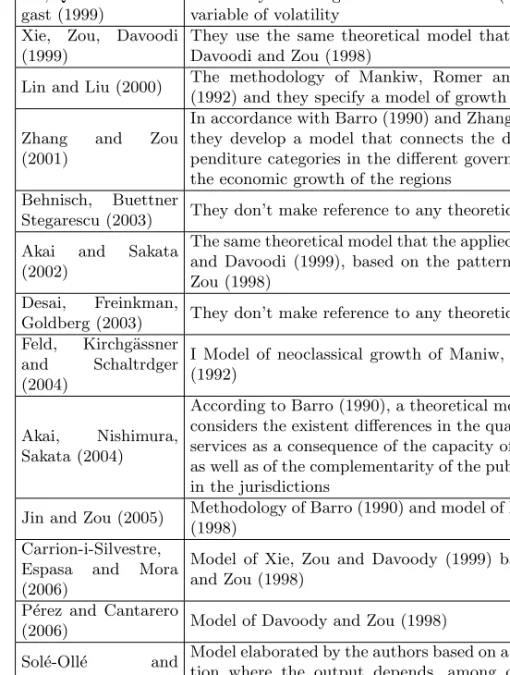
Table 6: Analytical Framework - Status Quo of single-country analysis. Source: Self-elaboration.
Author Analytical Framework
Zhang and Zou (1998)
Methodology of Barro (1990), Levine and Renelt (1992) and Davoodi and Zou (1998).
Jin, Quian and Wein-gast (1999)
The study of Zhang and Zou reexamine (1998) including a variable of volatility
Xie, Zou, Davoodi (1999)
They use the same theoretical model that is elaborated in Davoodi and Zou (1998)
Lin and Liu (2000) The methodology of Mankiw, Romer and Weil continue (1992) and they specify a model of growth of Solow (1956)
Zhang and Zou (2001)
In accordance with Barro (1990) and Zhang and Zou (1998), they develop a model that connects the diverse public ex-penditure categories in the different government levels with the economic growth of the regions
Behnisch, Buettner
Stegarescu (2003) They don’t make reference to any theoretical pattern
Akai and Sakata (2002)
The same theoretical model that the applied one for Xie, Zou and Davoodi (1999), based on the pattern of Davoodi and Zou (1998)
Desai, Freinkman,
Goldberg (2003) They don’t make reference to any theoretical pattern Feld, Kirchg¨assner
and Schaltrdger (2004)
I Model of neoclassical growth of Maniw, Romer and Weil (1992)
Akai, Nishimura, Sakata (2004)
According to Barro (1990), a theoretical model is given that considers the existent differences in the quality of the public services as a consequence of the capacity of the bureaucrats as well as of the complementarity of the public services given in the jurisdictions
Jin and Zou (2005) Methodology of Barro (1990) and model of Davoodi and Zou (1998)
Carrion-i-Silvestre, Espasa and Mora (2006)
Model of Xie, Zou and Davoody (1999) based on Davoodi and Zou (1998)
P´erez and Cantarero
(2006) Model of Davoody and Zou (1998)
Sol´e-Oll´e and Esteller-More (2006)
Model elaborated by the authors based on a production func-tion where the output depends, among other factors, on “Ait”, wich is a positive and neutral efficiency parameter
endogenousity of some explanatory variables that can be the case of the transfers
received by the subcentral governments.
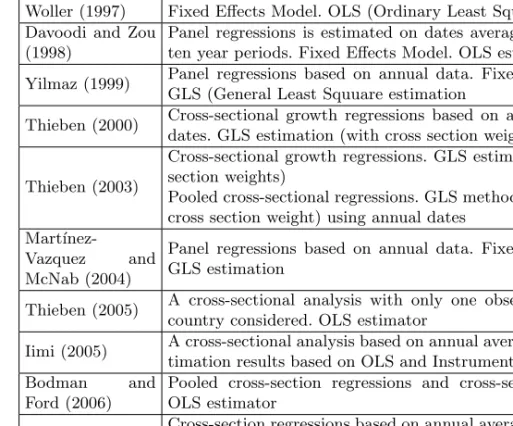
Table 7: Empiric Methodology - Status Quo of studies among countries.Source: Self-elaboration.
Author Empiric methodology
Oates (1995) No details available Phillips and
Woller (1997)
Panel regressions based on annual, three and five year average. Fixed Effects Model. OLS (Ordinary Least Square) estimation Davoodi and Zou
(1998)
Panel regressions is estimated on dates averaged over five and ten year periods. Fixed Effects Model. OLS estimation
Yilmaz (1999) Panel regressions based on annual data. Fixed Effects Model. GLS (General Least Squuare estimation
Thieben (2000) Cross-sectional growth regressions based on annual average of dates. GLS estimation (with cross section weights)
Thieben (2003)
Cross-sectional growth regressions. GLS estimation (with cross section weights)
Pooled cross-sectional regressions. GLS method is applied (with cross section weight) using annual dates
Mart´ınez-Vazquez and
McNab (2004)
Panel regressions based on annual data. Fixed Effects Model. GLS estimation
Thieben (2005) A cross-sectional analysis with only one observation for each country considered. OLS estimator
Iimi (2005) A cross-sectional analysis based on annual average date. The es-timation results based on OLS and Instrumental Variables (IV)
Bodman and
Ford (2006)
Pooled cross-section regressions and cross-sectional analysis. OLS estimator
Thornton (2007) Cross-section regressions based on annual average of dates. OLS estimator
More specifically, and among the most recent investigations, Bodman and
Ford (2005) go even further in Thieben´s (2000; 2001) analysis of the
relation-ship between fiscal decentralizaton and the components of the growth equation.
His study uses pooled cross-section regression. On the other hand, in Thieben
(2005) the simple Ordinary Least Square method is used with the assumption
that the independent variables are exogenous. The estimate is a pure cross-section
enable only the long-term effects to be measured. Equally, in Thornton (2007),
given the relatively small sample size, the estimation technique was Ordinary
Least Squares with average data for the period. Whereas the use of Ordinary
Least Squares in this context implies that the explanatory variable is exogenous,
which may be problematic, the relatively small sample prevents the use of an
al-ternative Instrumental Variable (IV) method. In the same way, in Iimi (2005) and
Esteban (2006) the estimation results are based on the Ordinary Least Square
and Instrumental Variable technique using data averages for the period of
ref-erence. Jin and Zou (2005) use a panel data set for 30 provinces in China. The
regression analysis in this study uses the panel data sets combining time series
and cross section. All coefficients are estimated with fixed-effects with corrections
for panel heteroskedasticity and panel serial correlation.
8. Main Results
In theory, it is expected that decentralization leads to efficient provision of local
public services and results in rapid economic growth but the empirical evidence
between fiscal decentralization and economic groth is ambiguous.
The results of the studies on the impact of fiscal decentralization on economic
growth that have been conducted on a cross-country analysis, indeed end up with
controversial results (Table 10).
Iimi (2005) finds that fiscal decentralization has a significant positive impact
on per capita growth, implying that the transfer of fiscal functions to sub-national
governments is condicive to economic growth.
Thieben’s (2005) studies can conclude that decentralization does generally
have a positive influence on growth. The results show that fiscal decentralization
can promote growth to limited extents. Countries with medium decentralization
have a slightly higher investment ratio and slightly higher growth in total factor
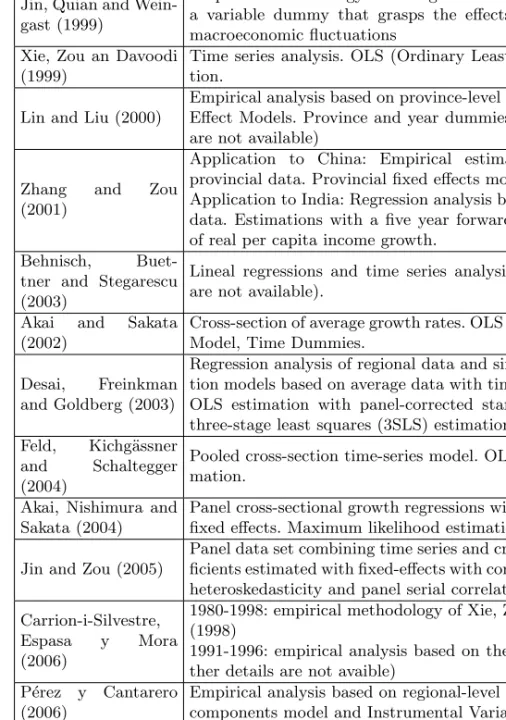
Table 8: Empiric methodology - Status Quo of single-country analysis. Source: Self-elaboration.
Autor Empiric Methodology
Zhang and Zou (1998)
Cross-province estimations based on provincial annual data. Fixed Effect Models. GLS (General Least Square) estimation
Jin, Quian and Wein-gast (1999)
Empirical methodology of Zhang and Zou (1998) including a variable dummy that grasps the effects of the national macroeconomic fluctuations
Xie, Zou an Davoodi (1999)
Time series analysis. OLS (Ordinary Least Square) estima-tion.
Lin and Liu (2000)
Empirical analysis based on province-level panel data. Fixed Effect Models. Province and year dummies. (further details are not available)
Zhang and Zou (2001)
Application to China: Empirical estimations based on provincial data. Provincial fixed effects model.
Application to India: Regression analysis based on the panel data. Estimations with a five year forward-moving average of real per capita income growth.
Behnisch, Buet-tner and Stegarescu (2003)
Lineal regressions and time series analysis (further details are not available).
Akai and Sakata (2002)
Cross-section of average growth rates. OLS and Fixed Effects Model, Time Dummies.
Desai, Freinkman and Goldberg (2003)
Regression analysis of regional data and simultaneous equa-tion models based on average data with time specific effects. OLS estimation with panel-corrected standard errors and three-stage least squares (3SLS) estimation
Feld, Kichg¨assner and Schaltegger (2004)
Pooled cross-section time-series model. OLS and TSLS esti-mation.
Akai, Nishimura and Sakata (2004)
Panel cross-sectional growth regressions with time and state fixed effects. Maximum likelihood estimation
Jin and Zou (2005)
Panel data set combining time series and cross section. Coef-ficients estimated with fixed-effects with corrections for panel heteroskedasticity and panel serial correlation.
Carrion-i-Silvestre, Espasa y Mora (2006)
1980-1998: empirical methodology of Xie, Zou and Davoody (1998)
1991-1996: empirical analysis based on the panel data (fur-ther details are not avaible)
P´erez y Cantarero (2006)
Empirical analysis based on regional-level panel data. Error components model and Instrumental Variables (IV) Sol´e-Oll´e y
Esteller-Mor´e (2006)
Panel data technique. OLS and GMM (Generalizad Method of Moments) estimators
Similarly, Bodman and Ford (2006) suggest that whilst little evidence of a
direct relationship between fiscal decentralization and economic growth is found,
some evidence is found to support the hypothesis that a medium degree of fiscal
decentralization is positively related to growth in the capital stock and level of
human capital.
At the same time, the empirical results presented in Thornton (2007) suggest
that when measures of fiscal decentralization are limited to the revenue over which
sub-national governments have real autonomy, there is no statistically significant
relationship betwen fiscal decentralization and economic growth. Whereas, when
revenue decentralization is measured by only those own-revenue, over which
sub-national government have full discretion, fiscal decentralization does not appear
to effect economic growth in mid to high income countries. Thornton (2007)
indi-cates that “A serious problem with much of the literature on the macroeconomic
impact of fiscal decentralization is that it fails to make an appropriate distintion
betwen administrative and substantive decentralization by not recognizing that
high sub-national revenue and spending shares do not necessarily indicate high
local autonomy”.
On the other hand, the empirical results concerning the impact of
decentral-ization on economic growth for individual countries are not less ambiguous than
those detected in the studies among countries (Table 9). As Jin y Zou (2005)
suggest, the effects of fiscal decentralization in any given case depend critically
on the nature of fiscal institutions and the political system in place. These
au-thors suggest that expenditure and revenue decentralization levels should further
diverge to benefit provincial growth. In the first phase (1979-1993), provincial
economic growth is negatively associated with expenditure decentralization and
positively associated with revenue decentralization. The negative association
be-tween expenditure decentralization and provincial real GDP growth rate is
con-sistent with Zhang and Zou’s (1998) results. Hence, their interpretation that “the
with nation-wide externalities in the early stages of economic development” is
supported by this result. In the second phase (1994-1999), the regression results
testing the relationship between fiscal decentralization and growth for the
pe-riod after 1994, when the tax assignment system was applied, suggest that there
is no significant association between expenditure decentralizaton and provincial
economic growth. Meanwhile revenue decentralization is found to be negatively
associated with provincial economic growth, with a high level of statistical
sig-nificance.
On the other hand, in the case of the Indian economy, Zhang y Zou (2001)
find a positive and significant relationship between the per capita fiscal
decen-tralization shares and state economic growth in India; While in the case of the
Chinese economy the results of Zhang y Zou (1998) reproduce themselves.
Jin, Qian and Weingast (1999), however, find a weakly significant positive
effect of expenditure decentralization on the economic growth of the same sample
of Chinese provinces over time. The most important difference between these
studies consists in the fact that Zhang y Zou (1998) do not use time dummies10.
Lin and Liu (2000) corroborate the result of a positive impact of decentralizaton
on economic growth in Chinese provinces for the period 1970 to 1993.
Desai et al. (2003) find that an increase in the retention tax (as a share of
locally generated taxes that are left with the regional budget), for most Russian
regions is generally accompanied by stronger economic growth.
From another perspective, Feld, Kichg¨assner and Schaltegger (2004) indicate
that matching grants have a negative impact on economic performance while tax
competition is at least not harmful to economic performance. Tax competition
appears to induce Swiss Cantons to allocate public funds more efficiently in such
a way that economic performance of a canton improves.
10
Exploring the American economy, Xie et al. (1999) also find for the US states
insignificant coefficients on local and state spending shares, but they argue that
these insignificant fiscal decentralization shares indicate consistency with growth
maximization. Akai and Sakata (2001) demonstrate that the expenditure
tralization positively affects economic growth of the US states. However,
decen-tralization on the revenue side and the indicators for fiscal autonomy of
sub-national levels do not have a significant impact. Equally, Akai, Nishimura and
Sakata (2004) underline the positive influence on economic growth. These authors
test the hypothesis of a “hump-shaped” relationship between fiscal
decentraliza-tion and economic growth and find that US states with a low degree of fiscal
decentralization tend to grow stronger.
Examining the impact on growth from the perspective of centralization,
Bh-nisch et al. (2003) report a statistically significant positive effect of overall
cen-tralization on the German growth of productivity.
In turn, in the case of the Spanish economy, Carrion-i-Silvestre, Espasa and
Mora (2006); P´erez and Cantarero (2006); and Esteban (2006), emphasize on the
fact that the contribution that the Spanish fiscal decentralization process has had
positive effects on regional economic growth.
Equally, the analysis of the Spanish economy done by Sol´e-Oll´e and
Esteller-Mor´e (2006) confirm the hypothesis of the “Decentralization Theorem”
concern-ing the greater responsiveness of sub-central government to local needs. Their
results show the need of decentralizing investment in order to maximize the rate
of economic growth. This way, roads and educational investiments made by
sub-central governments in Spain is much more sensitive to changes in output than
the investiment made by central government. As Sol´e-Oll´e and Esteller-Mor´e
(2006) suggest, if sub-central governments are more responsive to needs than the
central government, the composition of the capital stock under centralization is
not efficient. Therefore, the Spanish fiscal decentralization process would have
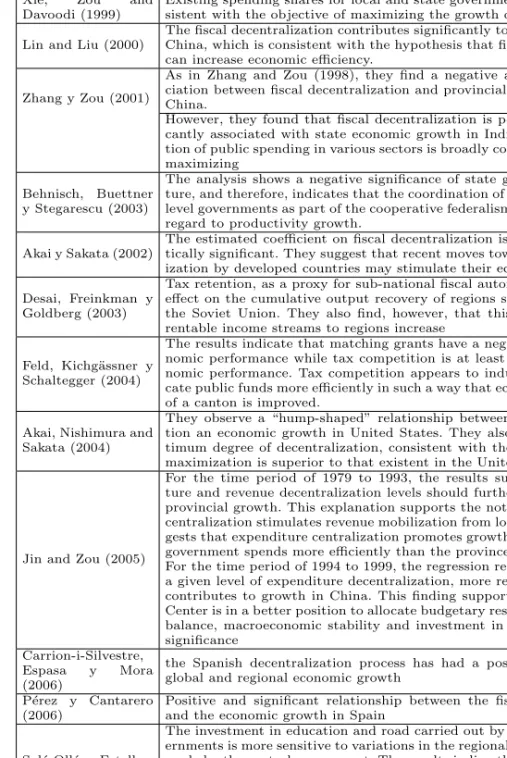
Table 9: Main results- Status Quo of single-country analysis.Source: Self-elaboration.
Author Main results
Zhang and Zou (1998)
They find a negative and significant impact of the fiscal decentralization on the economic growth of Chinese provinces.
Jin, Quian and Weingast (1999)
The fiscal decentralization promotes the economic growth of Chinese provinces.
Xie, Zou and Davoodi (1999)
Existing spending shares for local and state governments in USA are con-sistent with the objective of maximizing the growth of the economy.
Lin and Liu (2000)
The fiscal decentralization contributes significantly to economic growth in China, which is consistent with the hypothesis that fiscal decentralization can increase economic efficiency.
Zhang y Zou (2001)
As in Zhang and Zou (1998), they find a negative and significant asso-ciation between fiscal decentralization and provincial economic growth in China.
However, they found that fiscal decentralization is positively and signifi-cantly associated with state economic growth in India. The state alloca-tion of public spending in various sectors is broadly consistent with growth maximizing
Behnisch, Buettner y Stegarescu (2003)
The analysis shows a negative significance of state government expendi-ture, and therefore, indicates that the coordination of policies among state level governments as part of the cooperative federalism is not efficient with regard to productivity growth.
Akai y Sakata (2002)
The estimated coefficient on fiscal decentralization is positive and statis-tically significant. They suggest that recent moves toward fiscal decentral-ization by developed countries may stimulate their economic growth.
Desai, Freinkman y Goldberg (2003)
Tax retention, as a proxy for sub-national fiscal autonomy, has a positive effect on the cumulative output recovery of regions since the break-up of the Soviet Union. They also find, however, that this effect decreases as rentable income streams to regions increase
Feld, Kichg¨assner y Schaltegger (2004)
The results indicate that matching grants have a negative impact on nomic performance while tax competition is at least not harmful to eco-nomic performance. Tax competition appears to induce Cantons to allo-cate public funds more efficiently in such a way that economic performance of a canton is improved.
Akai, Nishimura and Sakata (2004)
They observe a “hump-shaped” relationship between fiscal decentraliza-tion an economic growth in United States. They also detect that an op-timum degree of decentralization, consistent with the objetive of growth maximization is superior to that existent in the United States
Jin and Zou (2005)
For the time period of 1979 to 1993, the results suggest that expendi-ture and revenue decentralization levels should further diverge to benefit provincial growth. This explanation supports the notion that revenue de-centralization stimulates revenue mobilization from local sources, it is sug-gests that expenditure centralization promotes growth because the central government spends more efficiently than the provinces.
For the time period of 1994 to 1999, the regression results suggest that at a given level of expenditure decentralization, more revenue centralization contributes to growth in China. This finding supports the view that the Center is in a better position to allocate budgetary resources for horizontal balance, macroeconomic stability and investment in projects of national significance
Carrion-i-Silvestre, Espasa y Mora (2006)
the Spanish decentralization process has had a positive effect on both global and regional economic growth
P´erez y Cantarero (2006)
Positive and significant relationship between the fiscal decentralization and the economic growth in Spain
Sol´e-Oll´e y Esteller-More (2006)
The investment in education and road carried out by the sub-central gov-ernments is more sensitive to variations in the regional output that the one made by the central government. The results indirectly suggest that in the centralized regimen the composition of the capital stock differs from the growth-maximizing one, and so economic growth is enhanced by means of decentralization
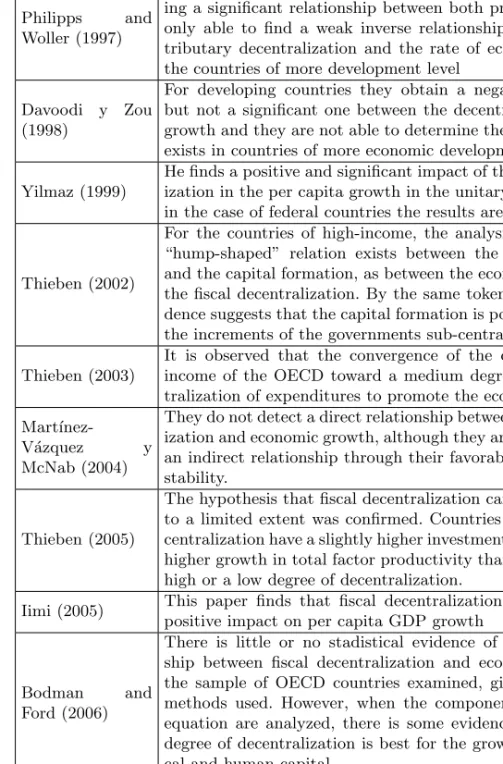
Table 10: Main results - Status Quo of studies among countries.Source: Self-elaboration.
Author Main results
Oates (1995) He detects a positive and significant correlation between fiscal decentralization and the rate of growth per capita
Philipps and Woller (1997)
For less developed countries, they fail in the intent of determin-ing a significant relationship between both processes. They are only able to find a weak inverse relationship between level of tributary decentralization and the rate of economic growth in the countries of more development level
Davoodi y Zou (1998)
For developing countries they obtain a negative relationship, but not a significant one between the decentralization and the growth and they are not able to determine the relationship that exists in countries of more economic development
Yilmaz (1999)
He finds a positive and significant impact of the fiscal decentral-ization in the per capita growth in the unitary countries. While in the case of federal countries the results are not conclusive.
Thieben (2002)
For the countries of high-income, the analysis suggests that a “hump-shaped” relation exists between the economic growth and the capital formation, as between the economic growth and the fiscal decentralization. By the same token, the empiric evi-dence suggests that the capital formation is positively related to the increments of the governments sub-centrales’ self-reliance. Thieben (2003)
It is observed that the convergence of the countries of high-income of the OECD toward a medium degree of fiscal decen-tralization of expenditures to promote the economic growth
Mart´ınez-V´azquez y McNab (2004)
They do not detect a direct relationship between fiscal decentral-ization and economic growth, although they are able to establish an indirect relationship through their favorable impact in price stability.
Thieben (2005)
The hypothesis that fiscal decentralization can promote growth to a limited extent was confirmed. Countries with medium de-centralization have a slightly higher investment ratio and slightly higher growth in total factor productivity than countries with a high or a low degree of decentralization.
Iimi (2005) This paper finds that fiscal decentralization has a significant positive impact on per capita GDP growth
Bodman and Ford (2006)
There is little or no stadistical evidence of a direct relation-ship between fiscal decentralization and economic growth for the sample of OECD countries examined, given the data and methods used. However, when the components of the growth equation are analyzed, there is some evidence that a medium degree of decentralization is best for the growth in both physi-cal and human capital
Thornton (2007)
9. Conclusions
In theory, it is expected that decentralization will lead to efficient provision of
local public services and will result in rapid economic development. However, the
studies presented here suggest that the relationship between fiscal
decentraliza-tion and economic growth is ambiguous.
More concretely, in cross-country analysis the main conclusion that can be
extracted is that a hump-shaped relationship seems to exist between the
pro-cesses of fiscal decentralization and economic growth. Also, due to the specific
problem in developing countries, it is necessary to limit the empirical analysis
only to high income-countries. In high income-countries, the results suggest that
the gains in growth that can be achieved through decentralization are limited.
Successive increase of a relatively low degree of fiscal decentralization does
stim-ulate investment and then so promotes economic growth. But there seem to be to
point beyond which, further decentralization no longer results in progress. The
economic explanation that emerges from these results is that if the grade of fiscal
decentralization is too high, intervention by central governement that would
pro-mote growth is not performed, and public goods with clear spatial delimitations
of its benefits will not have spillover effects with their repercusions. In the same
way, too low a degree of decentralization can lead to loss of economic growth
because the local government offices would not have sufficient incentives to
pro-duces public goods as efficiently as possible, as a consequence of such knowledge
not sufficiently taken into account.
While in studies within a single country, the effects of fiscal decentralizaton in
any given case depend critically on the nature of the fiscal institution and political
system in place. Nevertheless, the results seem to lean towards the hypothesis
that a medium degree of fiscal decentralization tends to best promote economic
growth. In other words, an optimal grade of decentralization would be able to
capitalize a country´s economy at a larger pace than it would be at inferior levels
As a final conclusion, cross-country studies as well as single-country
anal-ysis, tend to be inconclusive and they offer ambiguous and differents results.
Among the factors that can cause these ambiguous and differents results, the
ones that stand out most are, the different methodological approaches, the
an-alytical unit applied (studies among countries vs. studies single country) and
the diverse designs of the variable fiscal decentralization. In this sense, future
research may consider developing more disintegrated measures of fiscal
decen-tralization. The degree of decentralization should not be measured by the share
of expenditure/revenue of lower level governments as of that of total government
expenditure/revenue. In turn, it seems necessary to measure the differences in
current autonomy among jurisdictions. It is necessary to elaborate measures of
fiscal decentralization that represent changes in fiscal decentralization or grasp
qualitative restrictions of subnational autonomy. In equal manner, it would be
advisable that those publicly responsable for each country´s Official Institute of
Statistics draw up better and wider ranged time series data. Finally, it is
impor-tant to note that new investigations, based on theoretical models that are able
to verify the relationship that lies between fiscal decentralization and economic
growth are very necessary.
References
1. Akai, Nobuo and Masayo Sakata (2002): Fiscal Decentralization Contributes to
Economic Growth: Evidence from State-Level Cross-Section Data for the United
States,Journal of Urban Economics, 52, 93-108.
2. Akai, Nobuo, Yukihiro Nishimura, and Masayo Sakata (2004): Complementarity,
Fiscal Decentralization and Economic Growth, 59thCongress of the International
Institute of Public Finance, Prague.
3. Alcaide Inchausti, Alcaide, J. y P. (2003): Balance Econ´omico Regional
(Au-tonom´ıas y Provincias) A˜nos 1995 a 2002. FUNCAS, Madrid, Espa˜na.
4. ´Alvarez, J.; L. Orea and A. Alvarez (2003): La productividad de las