Understanding
the
effects
of
transit
benefits
on
employees’
travel
behavior:
Evidence
from
the
New
York-New
Jersey
region
Paola
Carolina
Bueno
,
Juan
Gomez
,
Jonathan
R.
Peters
,
Jose
Manuel
Vassallo
Keywords: Transport benefits Mode choice Travel behavior
Travel demand management Commute trips
a b s t r a c t
Implementing effective travel demand management measures provides an opportunity to reduce transport dependence on the private car. There is growing acknowledgement that the strategy of implementing transit benefits may boost transit ridership and reduce per-sonal vehicle use. This research contributes to the understanding of this issue by examining the relationship between commuter benefits and mode choice for commuting trips in the states of New York and New Jersey (US). Based on individual data from the Regional Household Travel Survey conducted by the New York Metropolitan Transportation Council and North Jersey Transportation Planning Authority, we adopted a multinomial logit model to identify the extent to which transport benefits to employees – including public transport-related, private transport-related and benefits for walking and cycling – promote changes in commuters’ modal split. The analysis shows that commuter benefits play a significant role in explaining observed travel patterns. Benefit programs that pay for auto expenses (e.g. toll payments, mileage reimbursement, free parking) are negatively correlated with transit, biking, and walking, while employer-funded benefit programs for transit passes and bike reimbursements increase their respective mode shares. This result confirms that promoting these types of measures is an effective policy to encourage the use of public transport modes, thus increasing efficiency and sustainability in daily mobility patterns.
1. Introduction
Since their first implementation in the 1970s, transportation demand management (TDM) programs have been used as policy mechanisms to tackle transportation-related problems such as air pollution or traffic congestion. In its broadest sense, they include a wide range of measures that are geared towards improving the efficiency of travel demand. As pointed out by
Meyer (1999), TDM programs can be regarded as either actions that are implemented at specific sites, or strategies that are implemented at an area-wide level. In this paper, we focus on the first dimension of these policy tools: TDM programs at employer worksites.
sense, commuter benefits can be defined as any option or set of options which employers provided to employees aimed at influencing their travel behavior, including benefits for driving (e.g., toll payments, subsidized parking), using public trans-portation (e.g., monthly passes, universal passes, or vouchers), and walking or cycling (e.g., financial incentives for bicycling or walking, or secure bike parking).
Ever since these benefits were put into effect, there has been an increasing recognition that these options may effectively persuade and induce workers to change their transportation habits. Consequently, several evaluations have sought to explain the effect of employer-paid benefits such as free parking (Hess, 2001; Shoup and Willson, 1992) and free and discounted transit pricing on commute mode choice (Boyle, 2010; Zhou and Schweitzer, 2011).
However, as pointed out by theTransit Cooperative Research Program (2005), ‘‘the impacts on employee travel behavior are not as well understood and little rigorous research has been conducted on the topic at a national scale”. In addition, although commuter benefit packages are supposed to influence mode choice decisions, some authors have acknowledged that only few contributions on commuter mode choice concurrently include variables measuring benefits for driving, public transportation, walking, and cycling (Hamre and Buehler, 2014). Furthermore, according to the authors themselves, the rela-tionship between commuter benefits and the likelihood to walk and cycle has been scarcely explored until very recently.
By recognizing the potential of commuter benefits to promote more sustainable transportation habits, this paper investigates the links between them and modal selection for commuting trips in the states of New York (NY) and New Jersey (NJ) in the US. Particularly, this research is aimed at determining to what extent employee benefits can incentivize changes in daily travel behavior. This study contributes to the literature in three ways. First, it covers an interesting case in the international context given that it is among the most populated and transit-intensive areas in the US, not studied in great detail before. In this respect, the results of this paper come up with useful policy implications regarding the promotion of sustainable transport behavior. Second, to our knowledge, this is among the few works concurrently exploring commuter benefits for driving as well as walking, cycling and public transportation, as factors influencing individual decisions to commute by using revealed preference data via a household travel survey. Finally, it comparatively analyses the effect of the benefits with other research previously conducted. This is particularly useful to contrast our results with the existing literature.
The document is structured as follows. Section2provides a literature review on the topic, concluding with some research gaps, and outlines also the expected contributions of the present work. Section3briefly summarizes the main socioeconomic characteristics and mobility patters for the states of NY and NJ. Section4describes the methodology adopted to model indi-viduals’ choices for commuting trips, and shows the RHTS survey and the explanatory variables considered for the analysis. Finally, Section5presents and discusses the results, and establishes a set of conclusions and recommendations for additional research in this field.
2. Literature review
Ever since sustainability emerged as a key priority in transportation planning, there has been growing interest in promot-ing sustainable transportation policies. Consequently, several travel demand management measures have been proposed in many different contexts —a complete overview at this point can be found inLoukopoulos (2007). Some of these strategies are sure means of changing travel related choices. As acknowledged byGarling et al. (2002), they lie from those measures that discourage car use to those policies encouraging the use of alternative modes. The latter are often called pull measures—i.e. improving public transport, improving infrastructure for cycling and walking or increasing the level of public transport sub-sidies—while the former are generally referred to as push measures—i.e. restricting parking availability, taxation on cars and fuel, decreasing speed limits, implementing road pricing mechanisms.
An important TDM strategy has been providing transportation subsidies and benefits to employees including toll/mileage reimbursements, public transport payments, free car parking and incentives for walking and cycling such as the provision of showers, lockers and bike parking. The literature review in this section will be mainly focused on these benefits as potential determinants of transport mode choice. Furthermore, we point out some useful insights of recent developments and mention some gaps found in the literature.
Employer TDM programs are sometimes difficult to evaluate because they are diverse in scope and involve individual behavior patterns, which are complex and difficult to model (Dill and Wardell, 2007). Overall, commuter benefits have been examined by using surveys as part of programs evaluation and a variety of statistics reported after or before introducing commuter benefits. For example,Herzog et al. (2006)conducted a survey of firms acknowledged as best workplaces for com-muters in the metropolitan areas of Denver (Colorado), Houston (Texas), San Francisco (California) and Washington, DC. The study was aimed at determining the differences between the commuting patterns of individuals who receive employee com-muter benefits and those who do not. This relevant research concluded that employees being offered public transportation benefits are significantly less likely to drive alone.
Another important contribution exploring the influence of transit benefits offered to employees was conducted under the
Practical studies focused on the effects of different employer-based TDM programs are too numerous to be completely reviewed here.Table 1presents a descriptive summary of some of the most relevant and latest studies evaluating the impact of commuter benefits addressed to public transport, private transport, walking and cycling on travel choices. In order to limit the present review to a manageable scope, we present only two examples per kind of benefit. Many other examples aimed at understanding the role of transportation demand management policies on commuters are found in the literature (see for instanceCass and Faulconbridge, 2016; Habibian and Kermanshah, 2013; Rotaris and Danielis, 2015).
Previous transit benefits assessments suggest a shift to more sustainable transport modes (bicycling, walking and public transport) for commuting trips as a consequence of the implementation of employer transit benefits. However, as mentioned byZhou and Schweitzer (2011), most of these studies are focused on relatively homogeneous groups of people such as uni-versity students. In addition, as pointed out byHamre and Buehler (2014), few contributions on commuters mode choice jointly include benefits for driving, public transportation, and walking or cycling. Finally, most of these studies only quantify ridership growth once benefits are applied, but they hardly ever study commuter benefits as a driver that may influence transport mode choice.
Despite the increasing attention devoted to the study of the impact of commuter benefits by transportation researchers, the current literature has certain gaps that have motivated this research:
First, previous studies – with few exceptions, such as the one conducted byHamre and Buehler (2014)for the case of Washington – are based on surveys conducted to transit benefits recipients instead of wider revealed preference travel data from regional household surveys. In our study, the sample presents higher variability because respondents of the household survey were not limited to those individuals receiving a transport benefit, thus reducing potential bias in the results. The approach adopted here allowed us to examine throughout a statistically significant model, to what extent individual characteristics, household attributes and, certainly, transport-related factors such as commuter benefits influ-ence the willingness to switch or stay from driving alone. Moreover, given the fact that the model is built on the basis of a completely disaggregated survey, this study is able to capture, simultaneously, the separate effect of benefits for driving, public transportation, and walking or cycling on commuter mode choice. As a result, the model provides more detailed information on shifts in travel behavior.
Second, the analysis developed in this research explicitly considers the influence that residence location may have on employees’ mode choice. At this point, it is necessary to estimate context-specific effects by accounting for the spatial clustering of individuals within the whole area under analysis. Particularly, we may expect that commuters living in the urban center—better served by transit services—may show different mobility patterns when compared to those living in inner suburbs. The model hence is able to capture whether the variability of the dependent variable—commuter mode choice—is attributable to individual circumstances, or is a result of the group effect—the county of residence within the NY/NJ metropolitan area. To that end, the multinomial logit model developed in this paper was complemented with a multilevel model extension.
Lastly, most previous studies in this field have included some ways to incorporate transit access as a variable explaining mode choice. Generally, this aspect was introduced through either dummy variables indicating whether people live near or not to a transit station, or proxy variables based on the number of transit stations located in the residential traffic anal-ysis zone (Dill and Wardell, 2007; Hamre and Buehler, 2014). In this research, we extend this analysis by conducting a more thorough approach for assessing accessibility. This involves the integration of existing geographical information systems and a detailed city street map.
3. The case of New York and New Jersey
American cities represent a case of particular interest when exploring the determinants of travel mode choice. In order to develop this analysis, we have selected two regions of particular interest: the states of New York (NY) and New Jersey (NJ), which are among the most populated areas within the United States. Below, a brief summary of the main characteristics of these regions is presented, with an emphasis on population, income distribution and some mobility patterns.
The population of NY and NJ states is dynamic and growing. Data from the 2010 Census reveal that more than 19 million inhabitants live in the NY metropolitan area while the New Jersey State has a total population of around 8 million inhabi-tants. According to the 2013 American Community Survey, the State of NJ is the second-wealthiest state within the nation, while NY State remains in the 18th position. When analyzing the income distribution of both states, the essential finding is their similarity with the national distribution, thus a trend towards inequality can be observed. At this point, a lower con-centration of households at the high end of the earnings distribution is noticeable in both states as well as in the nation as a whole.
at least in the case under study, the higher the household income the higher the car ownership rate, and thereby vehicle property may be capturing the income effect at a certain point.
The public transport system in the State of NY mainly consists of three modes: subway, bus and commuter trains. Despite New York has the highest transit usage rate in the United States, many communities are underserved by public transit—espe-cially for many of New Yorkers who live outside Manhattan. On the other hand, the public transport system in the State of New Jersey consists of three main modes (commuter rail, bus and light rail), completed by a number of ferry services. According to theNew Jersey Department of Transportation (2008), almost one in every ten workers in New Jersey uses public transit to get to work, twice the national average.
Another aspect that deserves consideration is related to the accessibility to public transport. AsPeters and Kramer (2012)
reported, good quality public transport is not universal in this region. For the case of New York City, they concluded that the outer boroughs are relatively underserved by mass transit relative to Manhattan. In particular, 99% of persons living in Man-hattan are within half a mile of train stations. By contrast, other boroughs such as Staten Island or Queens reported signif-icant lower percentages of accessibility (31% and 52%, respectively). Despite the importance of this topic, studies specifically focused on accessibility are particularly limited in these contexts and, consequently, it has not been thoroughly defined. We therefore decided to look more closely at transportation accessibility in order to later incorporate this variable into our research (see Section4). Our analysis on this matter is in line with previous studies. Particularly, we found a huge difference in the accessibility to the subway, rail and bus system together for houses located in different counties. For example, 100% of the Manhattan residents have acceptable walking distances for transit services, while in other areas this percentage falls in the range of 20–30%, such as in Monmouth-Ocean, Hunterdon-Sussex-Warren and Mercer.
Finally, since there is a need to promote a more sustainable commuting pattern in major urban centers in the United States, commuter benefits in the New York and New Jersey metropolitan area and their impacts on employee travel behavior becomes a case study of great interest in the international context. Furthermore, under the new law (effective from January 2016), employers with 20 or more full-time employees have the obligation to offer commuter benefits to their workers. According to the ForbesMagazine (2016), it means that an estimated 450,000 more New York City-based employees will have access to these programs, in addition to the 700,000 employees who already participate in these types of programs.
Table 1
Overview of previous studies.
Author Context Title Main characteristics and results
Letarte et al. (2016) Canada The Impacts of Universal Bus Pass on University Student Travel Behavior
Origin-destination surveys before and after the imple-mentation of the benefit.
Programs implemented had the expected results of increasing the public transit share and decreasing the car share. However, the walk share to campus decreased importantly.
Zhou and Schweitzer (2011)
USA Getting Drivers to Switch: Transit Price and Service Quality among Commuters
Based on two surveys. 568 respondents.
Try-transit and fare-free programs followed with dis-counted passes are likely to get some drivers to switch mode.
Washbrook et al. (2006)
Canada Estimating commuter mode choice: A discrete choice analysis of the impact of road pricing and parking charges
Based on a stated preference method. 650 respondents. Results suggest that policy makers interested in reducing
auto travel should create financial disincentives for auto use while improving the supply of alternative travel modes.
Scott et al. (2012) New Zealand
Company cars and fringe benefit tax: understanding the impacts on strategic transport targets
Based on travel plans. 5770 employees were examined. his research indicates that employees who receive
signif-icant parking subsidies are more likely to drive than use alternative modes of transport.
Heinen et al. (2013) The Netherlands
The effect of work-related factors on the bicycle commute mode choice in the Netherlands
Based on a survey with over 4000 respondents. Results indicate that an individual’s working situation
increase the likelihood of being a commuter cyclist (the presence of bicycle storage inside; having access to clothes changing facilities, etc.).
Hamre and Buehler (2013)
USA Role of Commuter Benefits in Shaping Decision to Walk, Cycle, or Ride Transit to Work in Washington, DC, Region
Data about full-time workers originate from the Washing-ton, DC Household Travel Survey. 4630 respondents. Results indicate that free car parking is significantly
4. Data sources, variables and model development
In order to explore the effects of transit benefits on employee travel behavior in the NY and the NJ region, we estab-lished a multinomial logit model based on data from the 2010–2011 Regional Household Survey (RHTS). The survey is rep-resentative of the region and requested participants to complete diary records of their daily travel over a 24-h period for each household member. All households within the counties constituting the NY/NJ metropolitan area were eligible for inclusion in the survey. In total, 18,965 households (43,558 persons) completed travel diaries. As previously done in the literature (Buehler, 2012; Hamre and Buehler, 2014; Dill and Wardell, 2007), our research focuses on commuters (n= 21,771 persons).
The survey is particularly useful for studying the relationship between commuter benefits and individual’s commute mode choice. It collected information on the provision of commuter benefits which can be grouped into: (i) public transport-related (public transport fares reimbursement), (ii) private transport-related (toll payment, mileage reimburse-ment, free parking available for the employee at the working place, provision of company cars or take-home vehicles, etc.), or (iii) soft transport modes-related (secure bike parking, workplace showers and lockers or shared-use paths).
The variables initially included in the modelling approach are shown inTable 2. The dependent variable refers to the com-muter’s reported usual mode to get to work (driving, public transport, walking, and cycling). All available options have been grouped into these four categories. Firstly, private transportation includes car, motorcycle and taxi, the latter having the same characteristics from a transportation point of view (motorized door-to-door service, used by a single or small group of passengers). By contrast, public transportation includes shared passenger transportation services, such as subway, local/-express buses, light rail, etc. Finally, walking and cycling comprise non-motorized door-to-door options, typically for short distances. In those cases where more than one type of transport mode has been used, only the one covering the higher share of the total trip distance has been considered in the analysis.
The explanatory variables comprise attributes at both the individual and household levels (seeTable 2). Individual char-acteristics include gender, age, race, work location, travel time to work, etc. Within this group, the key variable of interest regards to the transportation benefits/subsidies provided by the employer. The second group of variables is related to house-hold characteristics, such as the househouse-hold income, the househouse-hold structure or the househouse-hold vehicle size. Within this group of variables, it was considered necessary to incorporate the accessibility to public transport as a potential key explanatory variable of mode choice. To that end, we defined a new variable indicating the household accessibility to public transport services (bus, subway and rail lines). While this is still a limited measure due to the lack of detailed geographic information for bus routes, it is a good proxy of transit access and it is expected to be positively correlated with public transport use. The details regarding how we obtained this variable are reported inTable 2. Finally, we incorporated the variablecounty grouping
levelto capture specific issues dependent on the location of residence, e.g. the commuter lives in the urban core or in inner
suburbs of the NY/NJ region. For instance, this variable may capture that residents of the urban core are likely to be provided with better public transport services. In addition, households located in NYC are wealthier than the average for the state and maybe more aware of pedestrians and cyclist.
Regarding the descriptive statistics of the sample, a balanced proportion of men (51.1%) and women (48.8%) were sur-veyed, with a higher presence of people aged between 35 and 54 (47.2%). We observed the income typically lying above $75,000, and a vast majority of driving license holders (91.6%) and white ethnicity people (76.4%). Due to the nature of the database, it is also noticeable that the majority of respondents are full-time employed (73.3%). According to the sample, representative of the region, more commuters drive to work (61.3%) than use public transportation (21.9%). In addition, 23.8% reported to receive benefits including toll payment or reimbursement, public transit payment or reimbursement, free parking or reimbursement or secure bike parking, among others. Finally, the majority of respondents (87.5%) reported the availability of a car in their household. Some variability is also found in other explanatory variables such as the work loca-tion, household size or household structure. Further information about the descriptive statistics of explanatory variables included in this research can be found inTable 2.
As mentioned before, the research adopts a multinomial logit model (MNL) in order to explore the influence of transit benefits programs on employee travel behavior. The model can also be useful to examine other explanatory factors poten-tially affecting commuters’ mode choice. Particularly, respondents reported in the RHTS survey the transport mode they chose for commuting purposes. As mentioned above, these answers were grouped into four different categories (public tran-sit, private transport, walking and cycling), and represented the dependent variable of the multinomial choice specification. In this respect, the MNL approach adopted in this research represents an appropriate framework to explore and explain choice processes comprising more than two alternatives (Ben-Akiva, 1985).
A detailed description of the multinomial logit model is beyond the scope of this paper, and the reader is referred to Ben-Akiva and Bierlaire (1999), Ben-Ben-Akiva (1985), and Ortúzar and Willumsen (2011), among others. The original formulation of the logit model is derived from the utility maximizing behavior, assuming that decision makers are utility maximizers. Then, according to the economic theory, the individual will choose the option with the highest utility, each one determined by a number of explanatory parameters related to both personal attributes of the individual (I) and other characteristics of the household itself (H). The utility (Unj) gained by individualnfor choosing alternativejcan be written as:
Unj¼f Inj;Hnj
Table 2
Descriptive statistics for the independent variables.
Variable Categories Respondents % Sample
Dependent variable
Mode of transport to work Private transportation 13,338 61.3%
Public transportation 4764 21.9%
Walk 839 3.8%
Cycle 107 0.5%
Missing values (MV)a
2723 12.5%
Explanatory variables
Individual characteristics Gender Male—base reference (BC) 11,133 51.1%
Female 10,624 48.8%
MV 14 0.1%
Age Under 24 years (BC) 1335 6.1%
From 24 to 34 years 2701 12.4%
From 35 to 54 years 10,262 47.2%
From 55 to 64 years 5704 26.2%
Above 64 years 1434 6.5%
MV 335 1.5%
Driver’s license status Positive 19,962 91.6%
Negative (BC) 1786 8.3%
MV 23 0.1%
Race/ethnicity White (BC) 16,622 76.4%
Non-whiteb 4755 21.8%
MV 394 1.8%
Life cycle status Full-time employed (BC) 16,086 73.3%
Part-time employed 5481 24.9%
MV 204 1.8%
Work location Fixed (BC) 17,107 78.6%
Varies 4664 21.4%
Employer transportation benefits Do not use any subsidies (BC) 13,601 62.5%
Private vehicle-related 3604 16.5%
Public transport-related 1350 6.2%
Bike-related 43 0.2%
Other 189 0.9%
MV 2984 13.7%
Typical travel time in minutesc
Non-categorical variable Mean: 35.98 Sd: 29.05 Number of person trips per dayc Non-categorical variable Mean: 3.64 Sd: 2.54
Household characteristics Residence type Single-family (BC) 14,622 67.2%
Other 7129 32.8%
MV 20 0.0%
Household income Under $14,999 (BC) 580 2.7%
From 15,000 to $29,999 1373 6.3%
From $30,000 to $74,999 5688 26.2%
From $75,000 to $99,999 3139 14.4%
Above $100,000 9631 44.2%
MV 1360 6.2%
Household size 1 member (BC) 3350 15.4%
2 or more members 18,421 84.6%
Household vehicle size No vehicle (BC) 2728 12.5%
1 or more vehicles 19,043 87.5%
Household structure Above 2 Workers with Child(s) (BC) 4815 22.1% Above 2 Workers no Children 9375 43.1%
1 Worker with Child(s) 1574 7.2%
1 Worker no Children 6007 27.6%
Public transport accessibilityd Not accessible(BC) 6373 29.3%
Accessible 15,398 70.7%
County grouping level Manhattan (BC) 1688 7.8%
Other NYC 4222 19.4%
Long Island 3021 13.9%
Mid-Hudson 1761 8.1%
Mid-Hudson (other) 1007 4.6%
Bergen Passaic 1835 8.4%
Essex-Hudson union 2745 12.6%
Middlesex-Morris-Somerset 2231 10.3%
Then, the utility obtained by the decision maker from alternativejcan be divided into two additive parts as follows:
Unj¼Vnjþ
e
nj¼bjXnjþe
nj ð2ÞThe average utility (Vnj) is made up of explanatory variables known by the researcher while
e
njare the disturbances or ran-dom components associated with the choice option.Xnjis a vector of observed variables relating to alternativejthat define individual or household characteristics such as age, race, level of income or travel time.bjis a vector of coefficients to be estimated (Louviere et al., 2010).As explained byBen-Akiva (1985), the probability that respondentnwill choose alternativejcan be expressed as shown in Eq.(3). According toTrain (2009), the multinomial choice is a simple extension of logit models for binary responses. With respect to the choice between different transportation mode alternatives, the multinomial logit regression model is thus given by the following equation, whereP(Yn=j) equals the probability that the individual with characteristicxnchooses thejth category of the dependent mode choice variable.
PðYn¼jÞ ¼
eVnj P
jeVnj
¼PJebjXn j¼1ebkXn
forj¼1;. . .J ð3Þ
Then, the MNL models the odds1of each category relative to a baseline category as a function of covariates (Kohansal and
Firoozzare, 2013). Regarding the interpretation of the results, thebcoefficient indicates that for a unitary increase in a certain explanatory variable Xi, the odds ratio in favor of happening Y = 1 increases by ebj.
In addition, we calculated the marginal effects (MEs) of the explanatory factors of the model, interpreted differently depending on whether the explanatory variable is continuous or categorical. For categorical variables, the MEs show the dif-ference in the predicted probabilities for cases in one category relative to the redif-ference category (e.g., white respondent instead of non-white respondent). On the other hand, MEs for continuous variables measure the instantaneous rate of change. Finally, we used the validation technique to detect and prevent over-fitting. Based on a 10-fold cross-validation test, we estimated how accurately our predictive final model would perform in practice. To that end, we divided the data into two sets: a training set and a test set. The training set contains 90% of the sample, and was used to fit the multi-nomial model. The model was then applied to the test set (i.e. 10% of the remaining respondents). We then evaluated the accuracy of the prediction on the test set by means of a variable that counts the number of times the model correctly predicts the transport mode chosen by each individual. This procedure was repeated 5000 times, with randomly selected training and test sets.
As a complementary approach to the inclusion of the dummy variablecounty grouping level(see Section4), we decided to explore in more detail potential differences in mode choice across geographic counties of residence. As this analysis repre-sents an extension reinforcing the developed model, we applied the standard multilevel binary logit analysis based on ran-dom coefficients (Leew et al., 2008). In this sense, we account for potential correlation among responses due to hierarchical structures in the data, corresponding in our case to the county-group of residence. As in every multilevel approach, a signif-icant random intercept with regard to the county of residence indicates correlation among responses from same clusters.
5. Results
This section summarizes the main findings from the multinomial logit regression analysis conducted to examine the impact of transit benefits on commuters’ travel behavior. Before calibrating the model, we conducted some tests aimed at identifying potential multicollinearity problems between the explanatory variables included in the model, concluding no sig-nificant interactions. Regarding the goodness of fit of the estimated results, the model presents a pseudo R-square coefficient
Table 2(continued)
Variable Categories Respondents % Sample
Hunterdon-Sussex-Warren 1270 5.8%
Mercer 425 1.9%
aThis variable has a substantial number of cases with missing values, corresponding to the answers recorded as ‘don’t know’ or ‘refuse to answer’. We
also added those cases with transport modes that cannot be classified as public transport or private car.
b
This category includes: African American, Black, Asian, American Indian, Alaskan Native, Pacific Islander, Multiracial and Hispanic/Mexican.
c
The mean and the standard deviation are presented as descriptive statistics for non-categorical variables.
d
This variable was obtained by using Geographic Information System (GIS) techniques. Particularly, we created different buffers around the existing public transport network (subway and rail lines). We used a 600 m buffer for subway lines and a 1200 m buffer for rail lines. Due to the lack of detailed geographic information available for bus routes, accessibility to bus services was measured based on a proxy indicator at the county level, calculated as number of bus stations per county divided by the county area. Finally, households were classified as ‘accessible to public transport’ if their corresponding census tracts centroids were situated within a buffer or were located within a county where the number of stations per area is above the average value obtained for the rest of the counties.
1
of 0.54, which may be considered satisfactory for logit specifications according toHensher and Bradley (1993). This result is comparable to the fit accuracy achieved in similar studies (see for instanceBuehler, 2012; Dill and Weinstein, 2007; Thrane, 2015). In addition, the signs of the regression coefficients and their statistical and practical significance are in line with the expected results.
Final results coming from the modelling analysis are shown inTable 3. It should be noted that only those coefficients resulting statistically significant with 90%, 95% and 99% confidence intervals are displayed. Hence, explanatory variables included inTable 2but not listed inTable 3(i.e. gender, residence type, household structure, age, among others) were finally excluded out of the final model as being non-statistically significant (p-value > 0.10) because they showed irrelevant influ-ence on the overall model results. As commonly done for logit models analysis, slope coefficients of explanatory variables (bj)
are evaluated according to a twofold criterion: (i) the sign of the coefficient and (ii) its magnitude.
The results confirm that commuters’ mode choice is influenced by both individual and household characteristics. Among individual characteristics, providingtransport benefitswas found among the most significant determinants of commuters’ mode choice. In this respect, receiving subsidies that encourage private transport use (private vehicle-related) is found to be strongly negatively related to the likelihood of commuting by using public transport, walking or cycling. For instance, benefits such as toll payments, mileage reimbursements or free parking decrease the likelihood to commute by public trans-port over private car by 82%. This result is similar to the finding inPeters et al. (2011)with respect to toll payment by employers and the frequency of use of toll facilities. Moreover, we have found that private vehicle benefits are associated with a significant decrease in the probability of choosing alternative modes such as walking (57%) or cycling (60%) over driving, which reveals the importance of commuter benefits for promoting more sustainable options for short distances. In sum, employer-paid benefits for driving do not seem to effectively promote more sustainable commuting patterns pursued by TDM objectives.
In contrast, employer programs promoting the acquisition of public transport monthly passes, universal passes, vouchers or reimbursements significantly encourage employees to switch from drive-alone commuting. Commuters provided with public transportation benefits are about 9 times more likely to ride public transport than to drive alone and 3 times more likely to change their travel behavior towards walking or cycling. Therefore, incentives offered by employers have a great influence on employees’ choices, making it more convenient to e.g. ride transit to work than drive a car. It is worth mention-ing that our analysis identifiedpublic transport-relatedsubsidies as the primary determinant in explaining public transport choices, if we exclude the location of the county of residence within the NY/NJ area.
Finally, bike benefits are strongly correlated with an increased likelihood of commuting by bicycle. Compared to individ-uals receiving no subsidies, individindivid-uals with cyclist showers, lockers, or bike parking at work are 50 times more likely to commute by bicycle. In fact,bike-related benefitswere identified as the most important factor explaining the decision of cycling to work (over all other explanatory variables listed inTable 2). Nevertheless, the effect of bike-related benefits is expected to be significant mainly for short distances. Additionally, we should point out that the bike share for the area under study still remains rather low (0.5% in the sample).
In summary, the modelling results confirm that the provision of transport benefits to employees such as trip-end facilities for cycling at work, free car parking, incentives for private car use and public transportation reimbursements, can strongly influence commuters’ choices. In this respect, employer benefits should be acknowledged as a key component to be included and properly drawn when designing a sustainable transport policy package for daily mobility. However, it is worth to keep in mind that potential self-selection has not been explored in this study, which might leads to an overestimation of the impor-tance of these benefits in the model—seevan Wee (2009).
Based on the above results, we claim that, at least for commute mode choice, the conditioning influence of receiving sub-sidies prevails over other individual variables. In the following paragraphs, we present the main conclusions that can be drawn regarding the additional control variables which resulted statistically significant in the analysis (seeTable 3).
Regarding thedriver’s license status, it can be concluded that individuals having a driving license are less likely to ride pub-lic transport (=e1.933) and less likely to cycling (=e1.527) or walking (=e1.819) to get to work than individuals without it,
keeping the rest of variables constant. Furthermore, other individual variables are also related to commute mode choice, but their influence is less strong in practice. For instance, those workers who arepart-time employedand whosework location
varied, have a lower chance of commuting by public transport. The latter result may be an indication of the relationship between public transport and the regularity of the trips. Moreover, we found that white (Anglos) people are significantly more likely to commute by using private transport as compared to other races and ethnicities. Conversely, non-white people were also associated with reduced odds for walking and cycling to work. Furthermore, coefficient results forperson tripsand
travel timevariables pointed in the expected directions. An increase in the number of trips generates a decrease in public
transit usage, as it becomes less flexible to easily reach multiple destinations. Likewise, an increase in the travel time typ-ically increases the probability of using the public transport system – e.g. commuting by train when living far away from the NY/NJ metropolitan area – and decrease the probability of walking to get to work, especially for long-distance trips.
Results also suggest that household characteristics do also play a significant role in explaining travel behavior. In that respect, the commuting mode choice was found to be mostly determined bycar ownership. Having one or more vehicles greatly decreases the probability to commute by public transport (96%), walking (95%) and cycling (97%) when com-pared to the reference case (choosing private transport).
controlling for other potential explanatory factors. This result is in line with other papers found in the literature (Buehler, 2011; Hamre and Buehler, 2014; Lipps and Kunert, 2005; Schwanen and Mokhtarian, 2005). This finding could be explained by the fact that vehicle ownership may be capturing somehow the income effect. This assumption is supported by the rela-tionship previously observed between the level of income and vehicle ownership in NY and NJ (see Section3). At this point, it may happen that mode choice decisions in this area may be mostly influenced by other explanatory variables such as car ownership, in contrast to a limited effect of the income level. In fact, income may well be a catchall bucket for other eco-nomic variables that were omitted from the model, and with a well specified model the impact of income may be muted as other variables that directly impact demand may take the explanatory power away from a very gross metric of households ability to command goods (income).
Accessibility to public transport has also evidenced to be a relevant factor when explaining commuters’ mode choices. Particularly, individuals living in areas close to public transport facilities are about 127% more likely to commute by bus, sub-way or rail, compared to people with poor accessibility to the public transport network. Indeed, transit access is also asso-ciated with a greater likelihood of walking and cycling to work. This later result may be due to the fact that transit stations are interpreted by respondents as possible facilities for integrating bicycles (bike sharing stations or bike parking at rail sta-tions and bus stops, as well as bike racks on buses and short-term rental bikes). These findings provide evidence that the level ofpublic transport accessibilityin NY and NJ plays a significant role in determining public transport use, and promoting
Table 3
Summary of Model Results for commuters’ mode choice (base case: private transport).
Variables Public transport
(j= 1)
Walk (j= 2) Cycle (j= 3)
bj p-value bj p-value bj p-value
Individual characteristics Driver’s license status Negative (BC)
Positive 1.933 0.000*** 1.819 0.000*** 1.527 0.000***
Race/ethnicity White (BC)
Non-white 0.237 0.000***
0.148 0.149 0.765 0.007** Life cycle status
Full-time employed (BC)
Part-time employed 0.303 0.000***
0.167 0.140 0.297 0.384
Work location Fixed (BC)
Varies 0.268 0.003***
0.123 0.424 0.365 0.292
Employer transportation benefits Do not use any subsidies (BC)
Private vehicle-related 1.748 0.000***
0.847 0.000***
0.921 0.026** Public transport-related 2.157 0.000*** 1.198 0.000*** 1.096 0.006**
Bike-related 0.105 0.887 0.713 0.570 3.942 0.000***
Other 1.952 0.000***
0.702 0.286 1.201 0.273
Typical travel time in minutes 0.050 0.000***
0.084 0.000***
0.000 0.886 Number of person trips per day 0.095 0.000***
0.010 0.561 0.029 0.357
Household characteristics Car ownership No vehicle (BC)
1 or more vehicles 3.258 0.000***
2.871 0.000***
3.401 0.000*** Public transport accessibility
Not accessible (BC)
Accessible 0.820 0.000***
0.672 0.001***
0.337 0.867 County grouping level
Manhattan (BC)
Other NYC 1.472 0.000***
1.975 0.000***
1.611 0.000***
Long Island 3.431 0.000***
3.838 0.000***
3.584 0.000***
Mid-Hudson 2.545 0.000***
3.531 0.000***
4.036 0.000***
Mid-Hudson (other) 4.219 0.000***
3.680 0.000***
3.790 0.000**
Bergen Passaic 2.893 0.000***
3.890 0.000***
4.269 0.000*** Essex-Hudson union 2.174 0.000*** 2.897 0.000*** 2.851 0.000*** Middlesex-Morris-Somerset 3.819 0.000*** 4.568 0.000*** 2.555 0.000***
Monmouth-Ocean 3.777 0.000***
3.591 0.000***
3.503 0.000*** Hunterdon-Sussex-Warren 6.324 0.000***
3.692 0.000***
3.302 0.000***
Mercer 3.045 0.000***
3.289 0.000***
1.663 0.024**
Base outcome driving (private transport). Log likelihood5471.27.
Pseudo R2 0.548.
*
Significant at 10%.
**
Significant at 5%.
***
a more sustainable mobility in high-dense metropolitan areas. This is important from a planning perspective—as the access to good quality public transport is not universal in this region—, also applicable to other American cities. Therefore strategic expansions of the transit networks may have significant impacts on mode choice over time.
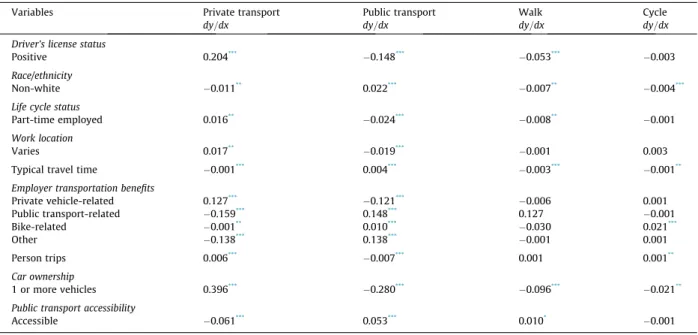
The influence of the explanatory factors can also be interpreted by taking into account the marginal effects in predicted probabilities. The main results obtained from this analysis are shown inTable 4. Among all the variables modelled, it is worth mentioning the case oftransport benefits, public transport accessibility,andcar ownership; since—as explained above—were found to have a greater impact on travel mode choice decisions compared to other personal and household characteristics. According to the results, setting all variables at their means reveals that if the employer transportation benefit changes from
no subsidiestoprivate vehicle-related subsidies, the probability of driving increases by 12% while the probability for public
transport use decreases in the same proportion. By contrast, a change towardspublic transport-related subsidiesreduces the probability of driving by 16% and increases the likelihood for riding public transport by 15%. Moreover, encouraging bike commuting throughbike-relatedtransportation benefits slightly increases the probability of cycling to work (+2%).
Similar findings for marginal effects were obtained for the variablespublic transport accessibilityandcar ownership.In case of owningone or more vehicles, the probability of choosing the private transport alternative increases by 40%. However, in this case, the probabilities for riding transit (28%), walking (10%), and cycling (2%) are strongly reduced. Conversely, having householdaccessibility to public transportslightly increases the probability of choosing transit modes (5%) and, to some extent, reduces the predicted probability for the cases of driving to work (6%). Further information about the mar-ginal effects reported for other explanatory variables included in this research can be found inTable 4.
Finally, we analyze the influence of residence location on commuters’ mode choice within the area under study. Estima-tion results show that residents of inner suburbs of the NY/NJ region are associated with a decreased likelihood of riding public transportation, walking, and cycling to work (seeTable 3, variablecounty grouping level). This suggests that people living in Manhattan commute more often by public transport and soft transport modes than residents of inner suburbs. This result may be a consequence of having higher transit access and/or living closer to their workplaces. To a lower extent, it seems to be also the case of the Essex-Hudson area, since it is fairly provided with public transport services. By contrast, outer regions such as Hunterdon-Sussex-Warren or other Mid-Hudson, with a poorer accessibility by transit modes, show higher percentages of individuals commuting by private car. This analysis was confirmed by exploring differences in mode choice across counties of residence through a multilevel specification, a suitable econometric technique for exploring geo-graphic differences from the sample. Through this process, we found the standard deviation of random intercepts for regions to be highly significant (p-value= 0.001). This fact evidences that, from a practical point of view, there are significant differ-ences among counties of residence regarding the mode choice. Results for random coefficients obtained for every county-grouping can be found in Annex 1. They confirm that individuals living in Manhattan show the highest use of public trans-port services. By contrast, residents of the counties Hunterdon-Sussex-Warren retrans-ported significant lower transit ridership levels. As can be seen, this result is strongly consistent with previous analysis based on the dummy variables included in the original multinomial model (seeTable 3).
Table 4
Marginal effects.
Variables Private transport Public transport Walk Cycle
dy=dx dy=dx dy=dx dy=dx
Driver’s license status
Positive 0.204*** 0.148*** 0.053*** 0.003
Race/ethnicity
Non-white 0.011**
0.022***
0.007**
0.004***
Life cycle status
Part-time employed 0.016**
0.024***
0.008**
0.001 Work location
Varies 0.017** 0.019*** 0.001 0.003
Typical travel time 0.001***
0.004***
0.003***
0.001**
Employer transportation benefits
Private vehicle-related 0.127***
0.121***
0.006 0.001
Public transport-related 0.159***
0.148***
0.127 0.001
Bike-related 0.001**
0.010***
0.030 0.021***
Other 0.138***
0.138***
0.001 0.001
Person trips 0.006*** 0.007*** 0.001 0.001**
Car ownership
1 or more vehicles 0.396***
0.280***
0.096***
0.021**
Public transport accessibility
Accessible 0.061***
0.053***
0.010*
0.001
*
Significant at 10%.
**
Significant at 5%.
As a final point, as explained in Section4, we tested the internal validity of the model by means of a 10-fold cross-validation method. According to this simulation analysis with 5000 random sets, we found that on average the model cor-rectly predicts 84% of the transport mode choices made by individuals in the sample. This test is further evidence that our model can accurately predict travel behavior.
6. Comparative analysis of the results and limitations
The results from the multinomial logistic regression presented above suggest a significant association between commuter benefits and transportation mode choice. This conclusion is consistent with relationships reported in most other studies found in the literature. There are however, some different findings across studies due to the effect sizes of the benefits. As pointed out byTransit Cooperative Research Program (2005), the results may vary, from cases with very minor impact to cases in which transit ridership more than doubled.
Although most studies suggest that commuters receiving private vehicle-related subsidies are less likely to use public transport, the magnitude of this effect slightly varies across case studies. As explained before, benefits such as toll payments, mileage reimbursements or free parking were found to greatly discourage public transportation use (82%). This finding is similar to that reported byHamre and Buehler (2014), who found car benefits related to a 90% decrease in the probability to choose public transportation than private car.
Moreover, private vehicle benefits are typically found in the literature to discourage cycling to work. For example,Buehler (2013)found that car facilities such as free parking at the workplace are associated with a lower likelihood for cycling to work (odds ratio of 0.303). In our analysis, these benefits are associated with similar magnitudes of decrease in the odds ratio in favor of other alternative modes such as walking (odds ratio of 0.43) or cycling (odds ratio of 0.39). Then, our findings are also consistent at this point with previous works, such asBuehler (2013)orShoup (2005). It is worth mentioning that the level of influence of these kind of benefits on the possibility of cycling to work does not considerably vary among the studies. Likewise, we found that commuters being offered public transportation benefits are about 9 times more likely to take public transportation than to drive and 3 times more likely to choose walking or cycling over driving. Other research such asHamre and Buehler (2014)obtained comparable results, particularly the effect sizes (11 times more likely for riding tran-sit and 2 times more likely for walking and cycling). However, our study found higher influence of bike benefits on the choice between cycling and driving (odds of 51.5) when compared to other effect sizes reported in the literature—for example
Hamre and Buehler (2014)orBuehler (2013). This difference may be interpreted on the basis of the small sample size of bike benefits recipients for the area under study.
Divergences found in this section might be explained by the unique nature of each case study and also by the differences in the methodology applied in the various studies mentioned before, including sample characteristics, the type of survey and the model development. Furthermore, findings may be not replicated in our context of study since we analyzed a very transit-intensive and large metropolitan area that may be not necessarily representative of other U.S. cities and regions.
Finally, several aspects for further research arise from the results and limitations of this paper. Firstly, additional efforts are needed to extend the current multilevel analysis in order to estimate more accurately how much of the variability observed in the mode choice variable is attributable to individual variables, and how much may correspond to a group effect (geographic area of residence). Future contributions should attempt to refine this analysis by adopting more complex econo-metric specifications such as multilevel multinomial logistic regression models. Secondly, additional research should delve more deeply into how self-selection may help to a better understanding of travel behavior. At this respect, more complex models such as structural equations modelling could be developed in order to address the potential self-selection bias effect on the results. Thirdly, the quality and quantity of the benefits provided should be examined in greater detail, particularly the influence of changes in the magnitude of benefits on mode choice. Additionally, since our research considered only the main mode in a multimodal trip, future studies should also explore the relationship between commuter benefits and the combination of several modes for origin-destination relationships.
7. Summary and conclusion
This study is aimed at exploring the effects of transport benefits programs on commuter travel behavior in the regions of New York and New Jersey. It addresses the question of whether packages that offer benefits for driving as well as walking, cycling, and using public transportation effectively promote sustainable travel behaviors. On the basis of individual data from the 2010–2011 Regional Household Travel Survey (RHTS), we have investigated to what extent commute mode choice is influenced by commuter transportation benefits and other relevant socio-economic and transport-related variables. To that end, we have developed a multinomial logit model to analyze the impact of different types of commuter benefits on mode choice by comparing motorists with public transport users, pedestrians, and cyclists. We also explored the relative importance of additional explanatory variables such as car ownership, accessibility to public transport or income. The anal-ysis yielded some interesting conclusions.
walk and cycle to work; our research provides insight to claim that these benefits may be an effective means to make public transport and soft modes more attractive to commuters, thus increasing efficiency and sustainability. Results of this analysis indicate that benefits such as public transport monthly passes, universal passes, vouchers or reimbursements constitute the most significant determinant for explaining the decision to ride transit.
At the same time, we found out that the provision of private transport-related benefits, such as free car parking or toll/ mileage reimbursement, is strongly associated with a low likelihood to choose public transportation and soft modes for com-muting trips. This finding confirms that, as expected, employer-paid benefits for driving do not contribute to promote sus-tainability objectives. Furthermore, bike-related benefits were found among the factors mostly influencing bicycle commuting. It means that trip-end facilities for cycling at work play a key role in determining the likelihood of bike com-muting, at least for short distances.
Then, increasing employer benefits to make public transport and soft modes alternatives more attractive, while reducing private vehicle benefits at the same time, may be an effective means of changing travel-related choices, particularly in metropolitan areas. Results of this analysis indicate that a comprehensive package of policies seems to be more effective than implementing them alone. Some level of pull measures—incentives for changing car use to non-automobile travel modes— along with push measures—decreasing benefits for automobile users—may have larger impacts on travel behavior.
The second conclusion is that modal choice is the result of a whole range of factors that are interrelated to a greater or lesser extent. For that reason, we also studied additional control variables regarding the characteristics of the trip maker as well as other household-related attributes potentially determining the choice of transport mode. On the basis of the results of this research we conclude that individuals with driver licenses and easy access to a car are less likely to commute by pub-lic transport, walking and cycling. By contrast, commuters living in areas close to pubpub-lic transport facilities have a higher chance of commuting by bus/subway/rail services. On the other hand, explanatory variables such as household income level were not found statistically significant to explain individuals’ decision for this case study.
Although there are many factors that affect employee travel behavior, the present study supports earlier findings that present transit benefits as a key driver of the mode choice adopted. As a consequence, we claim the need for implementing proactive policies that promote alternative and sustainable modes combined with policies that make car use less attractive. Through e.g. transit benefits programs, decision-makers can easily influence commuters travel behavior, whereas controlling other determinants such as car use (e.g. towards road charging, gasoline taxation, car purchase policies) may be more dif-ficult to implement or may result in negative public attitudes.
Acknowledgment
The authors wish to thank the Spanish Ministry of Economy and Competitiveness, which has funded the SUPPORT Project - EU support mechanisms to promote public–private partnerships for financing TRANSEUROPEAN TRANSPORT INFRASTRUC TURE—[TRA2012-36590]. Period: 1 January 2013–31 December 2016.
Appendix A. Random coefficients obtained through a multilevel model for the county groups
County grouping level Mean
Manhattan (BC) 3.081
Other NYC 1.639
Long Island 0.385
Mid-Hudson 0.581
Mid-Hudson (other) 1.193
Bergen Passaic 0.252
Essex-Hudson union 0.929
Middlesex-Morris-Somerset 0.794
Monmouth-Ocean 0.781
Hunterdon-Sussex-Warren 3.331
Mercer 0.094
95% confidence interval: 1.036–2.472. Std. error 0.355.
References
Ben-Akiva, M., 1985. Discrete Choice Analysis Theory and Application to Travel Demand. MIT Press.
Bhadra, D., 2010. Choice of aircraft fleets in the U.S. domestic scheduled air transportation system: findings from a multinomial logit analysis. J. Transport. Res. Forum 44 (3).http://dx.doi.org/10.5399/osu/jtrf.44.3.586.
Boyle, D. K., 2010. Transit fare arrangements for public employers: case studies. In: Transportation Research Board 89th Annual Meeting (No. 10-2866). Buehler, R., 2011. Determinants of transport mode choice: a comparison of Germany and the USA. J. Transp. Geogr. 19 (4), 644–657.http://dx.doi.org/
10.1016/j.jtrangeo.2010.07.005.
Buehler, R., 2012. Determinants of bicycle commuting in the Washington, DC region: the role of bicycle parking, cyclist showers, and free car parking at work. Transport. Res. Part D: Transp. Environ. 17 (7), 525–531.http://dx.doi.org/10.1016/j.trd.2012.06.003.
Buehler, R., 2013. Trip-end facilities at work and bicycle commuting in the Washington, DC, region. In: Transportation Research Board 92nd Annual Meeting. Cass, N., Faulconbridge, J., 2016. Commuting practices: new insights into modal shift from theories of social practice. Transp. Pol. 45, 1–14.http://dx.doi.org/
10.1016/j.tranpol.2015.08.002.
Dill, J., Wardell, E., 2007. Factors affecting worksite mode choice: findings from Portland, Oregon. Transport. Res. Rec.: J. Transport. Res. Board 1994, 51–57. http://dx.doi.org/10.3141/1994-07.
Dill, J., Weinstein, A., 2007. How to pay for transportation? A survey of public preferences in California. Transp. Pol. 14 (4), 346–356.http://dx.doi.org/ 10.1016/j.tranpol.2007.04.001.
Magazine, Forbes., 2016. More Employers Forced To Offer Commuter Benefits Retrieved from <http://www.forbes.com/sites/ashleaebeling/2014/10/ 08/more-employers-to-offer-commuter-benefits/#1319d5101807>.
Garling, T., Eek, D., Loukopoulos, P., Fujii, S., Johansson-stenman, O., Kitamura, R., Velhelmson, B., 2002. A conceptual analysis of the impact of travel demand management on private car use. Transp. Pol. 9, 59–70.
Habibian, M., Kermanshah, M., 2013. Coping with congestion: understanding the role of simultaneous transportation demand management policies on commuters. Transp. Pol. 30, 229–237.http://dx.doi.org/10.1016/j.tranpol.2013.09.009.
Hamre, A., Buehler, R., 2013. Role of commuter benefits in shaping decision to walk, cycle, or ride transit to work in Washington, DC, region. In: Transportation Research Board 92nd Annual Meeting.
Hamre, A., Buehler, R., 2014. Commuter mode choice and free car parking, public transportation benefits, showers/lockers, and bike parking at work: evidence from the Washington, DC region. J. Pub. Transport. 17 (2), 67–91.
Heinen, E., Maat, K., van Wee, B., 2013. The effect of work-related factors on the bicycle commute mode choice in the Netherlands. Transportation 40 (1), 23–43.http://dx.doi.org/10.1007/s11116-012-9399-4.
Hensher, D.A., Bradley, M., 1993. Using stated response choice data to enrich revealed preference discrete choice models. Market. Lett. 4 (2), 139–151. http://dx.doi.org/10.1007/BF00994072.
Herzog, E., Bricka, S., Audette, L., Rockwell, J., 2006. Do employee commuter benefits reduce vehicle emissions and fuel consumption? Results of fall 2004 survey of best workplaces for commuters. Transport. Res. Rec.: J. Transport. Res. Board 1956, 34–41.http://dx.doi.org/10.3141/1956-05.
Hess, D., 2001. The effects of free parking on commuter mode choice: evidence from travel diary data. Transport. Res. Rec.: J. Transport. Res. Board 1753 (8), 35–42.http://dx.doi.org/10.3141/1753-05.
Kohansal, M.R., Firoozzare, A., 2013. Applying multinomial logit model for determining socio-economic factors affecting major choice of consumers in food purchasing: the case of Mashhad. J. Agricult. Sci. Technol. 15, 1307–1317.
de Leew, J., Meijer, E., Goldstein, H., 2008. In: de Leeuw, J., Meijer, E. (Eds.), Handbook of Multilevel Analysis. Springer New York, New York, NY.http://dx.doi. org/10.1007/978-0-387-73186-5.
Letarte, L., Pouliot, S., Waygood, E.O.D., 2016. The impacts of universal bus pass on university student travel behavior. In: Transportation Research Board 95th Annual Meeting.
Lipps, O., Kunert, U., 2005. Measuring and Explaining the Increase of Travel Distance: A Multilevel Analysis Using Repeated Cross Sectional Travel Surveys (DIW No. Diskussionspapiere 492). Deutsches Institut für Wirtschaftsforschung (DIW), Berlin.
Loukopoulos, P., 2007. In: Garling, T., Steg, L. (Eds.), A Classification of Travel Demand Management Measures. Elsevier, Oxford OX2 8DP, United Kingdom (First).
Louviere, J.J., Flynn, T.N., Carson, R.T., 2010. Discrete choice experiments are not conjoint analysis. J. Choice Model. 3 (3), 57–72.
Meyer, M.D., 1999. Demand management as an element of transportation policy: Using carrots and sticks to influence travel behavior. Transport. Res. Part A: Pol. Pract. 33 (7–8), 575–599.http://dx.doi.org/10.1016/S0965-8564(99), 00008-7.
New Jersey Department of Transportation, 2008. New Jersey’s Long-Range Transportation Plan.
Ortúzar, J.D.D., Willumsen, L.G., 2011. Modelling Transport. John Wiley & Sons, Ltd, Chichester, UK.http://dx.doi.org/10.1002/9781119993308. Peters, J., Kramer, J., 2012. Just who should pay for what? Vertical equity, transit subsidy and road pricing: The case of New York City. J. Pub. Transport. 15
(2003), 117–136.
Peters, J., Shim, H., Kress, M., 2011. Disaggregate multimodal travel demand modeling based on road pricing and access to transit. Transport. Res. Rec.: J. Transport. Res. Board 2263 (1), 57–65.http://dx.doi.org/10.3141/2263-07.
Rotaris, L., Danielis, R., 2015. Commuting to college: the effectiveness and social efficiency of transportation demand management policies. Transp. Pol. 44, 158–168.http://dx.doi.org/10.1016/j.tranpol.2015.08.001.
Schwanen, T., Mokhtarian, P.L., 2005. What affects commute mode choice: neighborhood physical structure or preferences toward neighborhoods? J. Transp. Geogr. 13 (1), 83–99.http://dx.doi.org/10.1016/j.jtrangeo.2004.11.001.
Scott, R.A., Currie, G.V., Tivendale, K.J., 2012. Company cars and fringe benefit tax: understanding the impacts on strategic transport targets. NZ Transport Agency, Wellington, N.Z. <http://www.nzta.govt.nz/resources/research/reports/474/docs/474.pdf>.
Shoup, D., 2005. High Cost of Free Parking. APA Planners Press, Chicago.
Shoup, D., Willson, R., 1992. Employer-paid parking: the problem and proposed solutions. Transport. Quart. 46 (2), 169–192.
Thrane, C., 2015. Examining tourists’ long-distance transportation mode choices using a Multinomial Logit regression model. Tour. Manage. Perspect. 15, 115–121.http://dx.doi.org/10.1016/j.tmp.2014.10.004.
Train, K., 2009. Discrete Choice Methods with Simulation. Books.Google.Com (Second). Cambridge University Press.
Transit Cooperative Research Program, 2005. Analyzing the Effectiveness of Commuter Benefits Programs (Report 107). Washington, DC.
van Wee, B., 2009. Self-selection: a key to a better understanding of location choices, travel behaviour and transport externalities? Transp. Rev. 29 (3), 279– 292.http://dx.doi.org/10.1080/01441640902752961.
Washbrook, K., Haider, W., Jaccard, M., 2006. Estimating commuter mode choice: a discrete choice analysis of the impact of road pricing and parking charges. Transportation 33 (6), 621–639.http://dx.doi.org/10.1007/s11116-005-5711-x.