Quality of Experience of adaptive video streaming:
Investigation in service parameters and subjective quality
assessment methodology
Samira Tavakoli , Kjell Brunnstróm , Jesús Gutiérrez , Narciso García
A B S T R A C T
The usage of HTTP adaptive streaming (HAS) has become widely spread in multimedia services. Because it allows the service providers to improve the network resource utilization and user's Quality of Experience (QoE). Using this technology, the video playback interruption is reduced since the network and server status in addition to capability of user device, all are taken into account by HAS client to adapt the quality to the current condition. Adaptation can be done using different strategies. In order to provide optimal QoE, the perceptual impact of adaptation strategies from point of view of the user should be studied. However, the time-varying video quality due to the adaptation which usually takes place in a long interval introduces a new type of impairment making the subjective evaluation of adaptive streaming system challenging. The contribution of this paper is two-fold: first, it investigates the testing methodology to evaluate HAS QoE by comparing the subjective experimental outcomes obtained from ACR standardized method and a semi-continuous method developed to evaluate the long sequences. In addition, influence of using audiovisual stimuli to evaluate the video-related impairment is inquired. Second, impact of some of the adaptation technical factors including the quality switching amplitude and chunk size in combination with high range of commercial content type is investigated. The results of this study provide a good insight toward achieving appropriate testing method to evaluate HAS QoE, in addition to designing switching strategies with optimal visual quality.
1. Introduction
In recent years a great increase of video services has taken place which provided the ease of access for the consumer from almost any type of device and different location. This has made video streaming as the most dominant application in the Internet and this dominance
is prone to the temporal impairments such as long initial delay (in case where large playout buffers have to be filled initially) or stalling (i.e. playback interruption due to the empty playout buffer).
To overcome these problems, several service providers have implemented HTTP adaptive streaming (HAS). HAS makes it possible to switch the video quality during the playback in order to adapt to the current network condi-tions. In HAS, the video content is available in multiple bitrate (called adaptive streams or representations) on the server-side which may differ in terms of spatial resolution, temporal resolution (framerate), encoding quantization, as well as combination thereof. Each representation consists of independently decodable segments of a few seconds of video, termed chunk. The characteristics of the representa-tions are stored at the server-side in a file (or manifest) providing the client the required information for the adaptation process. After filling the buffer with the initial bitrate, the video playout is started. During the playback, the adaptation algorithm in the client-side measures the current bandwidth and/or buffer status in order to decide on the appropriate bitrate for the next video chunk request such that the available bandwidth is utilized best and stalling is avoided. Nevertheless, in terms of user perceived quality, another dimension, i.e. time-varying quality switching is introduced.
Apart from the benefit of dynamically adapting the current video bitrate to the available bandwidth, employ-ing HAS provides further advantages compared to the classical video streaming. For instance, offering multiple bitrates of the video enables service providers to adapt the delivered video to the users with different demands and network/device accessibility. Furthermore, based on the available video quality, different pricing schemes and service levels can be offered to the customers. All these advantages have made employing this technology more popular. Nevertheless, in regard to the adaptation behavior that should be decided in the client side, there is still no clear guideline about the performance of different scenar-ios in terms of the user's Quality of Experience (QpE).
Up to now, several research works in the HAS area have been conducted which can be differentiated along techni-cal and perceptual based quality assessment. Technitechni-cal analysis such as [1] mainly focuses on inquiring switching strategies to optimize the bandwidth utilization and other network related parameters. Whilst the perceptual based analysis concerns about the QoE impact of adaptation related parameters. Up to now, research has been mostly concentrated on technical aspects of HAS, but in order to optimize the user's QoE, it is crucial to deliberate more on the perceptual aspect.
There are different potential QoE influence factors related to client switching behavior which have been already addressed in the previous studies. Two of the most common ones are the switching frequency (i.e. number of switches per adaptation event1) and switching amplitude
1 Adaptation event denotes the period of video playback when the quality switchings from the current level to the target level occur.
(i.e. difference between the current and target quality levels in an adaptation event).
About the switching frequency, results presented in [2-6] show that frequency of the adaptation should be kept as low as possible. In the same time, the study presented in [3] indicates that if the duration spent on the high quality level is sufficiently long, higher switching frequencies do not signifi-cantly degrade the QoE. Considering the switching amplitude, most of the previous studies [3-7] conclude that gradual multiple variations are preferred over rapid variations. Never-theless, as highlighted in [4], this conclusion may not be applied to the scenarios where the quality levels' difference is very small.
Another possible QoE influence factor could be the chunk length considered for switching the quality between different representations. There are some concerns in regard to selection of chunk length which should be considered in different applications. For instance, in cer-tain scenarios like a live broadcast, using long chunk size may not be suitable as switching granularity is more considerable. Employing small chunks improves the client reaction time to network bandwidth variations but also increases the activity on the client side. To the best of our knowledge, studying the QoE impact of chunk size has not received much attention yet.
Characteristics of the content is another possible influ-ence factor on the user's perception of quality switches. Studied presented in [3,8] revealed that the effect of spatial and temporal switching varies depending on the content type. This was found to be even true for switches with the same amplitude so that it is difficult to spot quality oscillation when there are frequent scene changes while in steady shots they are more noticeable.
One of the common approaches to evaluate the impact of visual distortions on the user's perceived QoE is through subjective assessments. Extensive research related to sub-jective studies of audiovisual quality has brought up
several testing methodologies to obtain reliable results for development of multimedia technologies. There are different international recommendations provided by standardization organizations such as ITU-R BT.500 [9] and ITU-T P.910 [10] which give guidelines to assess the quality of television pictures. However, the novelties of adaptive streaming technology and corresponding visual degradations require research for a new assessment meth-odology that allows obtaining reliable conclusions regard-ing the HAS users' visual experience.
methodology that might be appeared more suitable for adaptive streaming evaluation is Single Stimulus Continu-ous Quality Evaluation (SSCQE) [9], where the observers provide instant ratings of the video quality in a continuous way during the sequence. However, the recency and hyster-esis effect of the human behavioral responses while evalu-ating the time-varying video quality would lead to an unreliable evaluation through this methodology [12].
In fact, research on new methodologies to improve the current subjective testing approaches has been already started. For instance, in our previous work [13] the evalua-tion of set of subsequent adaptaevalua-tion scenarios was made using long test sequences (around 6 min) selected from the content that is usually watched by the users at home (e.g., movies, news, etc.). Assessment methodology used in this study was firstly presented in [14] and subsequently named Content-Immersive Evaluation of Transmission Impair-ments (CIETI). The idea behind designing this method was to simulate realistic viewing conditions by using longer sequences so the observers become more engaged to the content as they would be in real life, rather than focusing on detecting impairments, which can happen using tradi-tional methodologies with the short and less entertaining test videos. In this sense, another study was presented in [8], where the effect of different switching strategies were investigated, such that each individual adaptation event was evaluated in a sequence of around 2 min.
Another new approach for immersive evaluation of audiovisual content was proposed in [15]. This method is based on the use of long test stimuli to simulate real situations of using audiovisual applications and encoura-ging the observers' engagement with the content. In this work, not only longer sequences are recommended for evaluating the video quality, but also using test sequences with audio (in spite of traditional standard recommenda-tions). This recommendation makes sense since video-only presentations poorly represent the users' experience of an audiovisual application, as people rarely watch videos without sound.
Summarizing, there are a broad investigations on adap-tive streaming, both technical and perceptual based assessment. However, many research questions are still open. This is because of different issues such as limited number of test conducted addressing a specific factor, results obtained from non-statistical analysis, or in some cases contradictory outcomes from different studies. In addition, there are some new research questions, specially in regard to HAS QpE testing methodology, that recently have got attention in the literature [16].
In response to this state of research, the novelty brought by this paper is two-fold: first it takes the open research question in regard to HAS QpE evaluation meth-odology into account. Second, it investigates the percep-tual influence of some of the important technical parameters for adaptive streaming in combination with high range of video content types.
The reminder of the paper is organized as follows. Section 2 describes the study factors and the experimental setting. The experimental results are described in Section 3 and further discussed in Section 4. Finally, in Section 5 the general conclusions are presented.
2. Study description
2.2. Study factors
Following aspects in relation to HAS perceptual quality and respecting the home viewing condition were consid-ered to study in this paper.
Perceptual performance of switching strategies: Among the possible technical switching parameters, the impact of switching amplitude and chunk size when decreasing and increasing the video quality was considered for this study. By employing short and long chunk size to change the quality in step-wise (gradually) and rapid way different adaptation scenarios were designed. In addition, the trade-off between the quality adapted video and constant quality video was investigated.
Effect of the content type on perceptual quality of switch-ing strategies: Effect of the content characteristics on perceptual quality of the test stimuli was highlighted in several previous works. This dependency can be based on the psychovisual factors such as objective characteristics of the content (e.g. spatial and temporal complexities) as the rate distortion performance of encoded video depends largely on these factors [17], in addition to psychological factors like user expectations and desirability of the video [18] which could be because of the content genera. To investigate the impact of these factors on perception of adaptation, the switching scenarios were applied on var-ious video sequences in different objective characteriza-tions and genera which are usually watched by the actual viewers in the real-world condition.
Evaluation methodology for quality assessment of adap-tive streaming: Another study factor was to investigate subjective methodology to assess the video sequences with time-varying quality.
To this aim, set of experiments were conducted in two laboratories. The stimuli and experimental setups were held constant across the labs but the evaluation metho-dology was varied: in one lab a standardized test method (ACR) was applied and in the other one a semi-continuous method developed to evaluate the perceptual quality in long test sequences (CIETI).
Moreover, the influence of audio presence on evalua-tion of the video-related impairments was investigated. For this purpose, the CIETI method was employed in two different experiments: one by showing the video-only stimulus and the other by showing the stimulus in the presence of audio.
2.2. Subjective experiments 2.2.1. Test materials and conditions
Choosing among commercial content, seven source videos (SRC) of approximately 6 min long were chosen as listed in Table 1. They were originally 1080p picture size and 24 or 50 fps. The spatial and temporal information of the content (SI and TI in order) which was determined using the metric provided by [10] covered a large portion of SI-TI plane.
Table 1
Source sequence description.
Content type Description
Movie 1 Action, adventure, fantasy; with some scene in smooth motion, some with group of walking people, some with camera panning Movie2 Drama, music, romance; mostly with the smooth motion in the static background, some scene with group of dancing people Movie3 Action, Si Fi, drama; with rapid changes in some sequences, cloudy atmosphere
Sport Soccer, 2010 World cup final, average motion, wide angle camera sequences with uniform camera panning. Documentary Sport documentary; mostly with handheld shooting camera
Music Music concert; high movement of the singer with some sudden scene change
News Spanish news broadcast; some scenes with static shooting camera with one/two standing/sitting people, some outdoor scenes
Table 2
Trasncoding parameters of quality levels
Stream code Framerate Resolution Target bitrate (kbps)
Q2 Q3 04
24 24 24 24
720p 720p 720p 720p
600 1000 3000 5000
Video: H.264, high profile, closed GOP, disabled scene change detection Ref. frame: 2, B frame: 2, CBR, adaptive QP Audio: AAC, 192kbps
streaming companies for the living-room platform. Fol-lowing the recommendation of [3], the compression domain was considered as the switching dimension. For each SRC, four quality levels were produced using Rhozet Carbon Coder with the setting summarized in Table 2. It was assumed that the network bandwidth varies along these levels.
For each of the status when client should request from the server lower bitrate chunk (down-switching) or higher bitrate chunk (up-switching) four Hypothetical Reference Circuits (HRC) were constructed. The gradual and rapid way of switching were simulated following the patterns presented in Fig. 1. For each of these switching behaviors, two chunk size, 2 sec and 10 sec length, were considered to be inline with current HAS solutions. To study the perceptual quality of adaption streams in different content, four HRCs were considered representing the constant quality level. All HRCs are listed in Table 3.
To produce the test video, each SRC was segmented using Adobe Premiere Pro CS6. The segmented videos were subsequently considered as either Processed Video Sequences (PVS) or voting-segment (VS). The PVS was made by applying one of the HRCs on the segment (for the adaptation HRCs this was done by concatenating the chunks from different quality levels as presented in Fig. 1). The subsequent segment with no degradation was considered as VS. In the same way, all HRCs were applied on the subsequent segments with the VS intervention. Because of the session time limitation and high number of the SRCs and HRCs, the full factorial design was not feasible.2 To respect the ITU-T recommended test session
2 To have a full factorial designed experiment and understand the perceptual difference of the 12 HRCs, each of the HRC had to be applied on every individual segment (cf. segments used to make PVS1, PVS2,... in
Fig. 2) from all SRCs. This would lead providing 12 variants for each content and subsequently over 360 hours long test session.
length, four out of seven SRCs (Moviel, Movie2, Sport and Documentary) were used in two different variants. By this way, relevant amplitude degradations (i.e. comparing GRx and RPx, cf. Fig. 1) as well as those constant quality HRCs with potential non-perceivable difference (i.e. comparing N3 and N5, as well as N600 and Nl) were compared in an individual video segment of the aforementioned content. As a result, 11 test sequences, i.e. for each individual HRC, 11 different video segments ( 4 x 2 + 3 ) , and consequently the total of 132 PVSs (11 x 12) were generated for evalua-tion. Length of the PVSs was variable depending on the HRCs, 40 sec for those considering the quality switching with 10 sec chunk, and 14 sec for the rest of the HRCs.
2.2.2. Evaluation method and experimental setup
Three laboratory experiments were conducted all eval-uating the identical PVSs but through different approaches. The first experiment was conducted in Aereo Swedish ICT's lab (denoted as 'Aereo' experiment). The randomized order of the PVSs was presented to the test subjects following the ACR methodology adapted from ITU-T Rec. P.910. After presentation of each PVS, the subjects were asked to evaluate the PVS by answering two questions: the overall quality of the PVS (rating on the five graded ACR scale Bad{\), Poor[2\ Fair(3), Good(4) and Excellent(5)), and if they perceived any change in the quality (options: Increasing, No change, Decreasing).
Two other independent experiments were carried out in Universidad Politécnica de Madrid's lab using CIETI method: one by presenting only the video stimulus (denoted as 'UPM-NoAudio' experiment), and the other one in the presence of audio3 (denoted as 'UPM-Audio' experiment). Fig. 2 shows an example of the test sequence (TS) used in UPM experiments. The first segment of TS had
Rapid switching (RPx) Gradual switching (GRx) Ql Increasing Ql Ql+k
r
j
i
Ql+k Ql+k Ql+k1
DecreasingH
Ql QlFig. 1. Quality switching pattern for rapid and gradual switching (RPx and GRx respectively where x stands on chunk size). Ql and Ql+k denote the quality levels (cf. Table 1).
Table 3
List of the test adaptation strategies (HRCs)
Status Possible behavior HRC code
Increasing quality Decreasing quality Constant Gradually Rapidly Gradually Rapidly
Whole PVS at £ Whole PVS a t : Whole PVS at 1
10 s chunk 2 s chunk 10 s chunk 2 s chunk 10 s chunk 2 s chunk 10 s chunk 2 s chunk Mbps Mbps Mbps Whole PVS at 600 kbps
IGR10 IGR2 IRP10 IRP2 DGR10 DGR2 DRP10 DRP2 N5 N3 Nl N600 No
Impairment PVS1 VS1
1
PVS 12 VS12
12
Fig. 2. Test sequence (TS) structure. In Aereo experiment, the randomized order of all PVSs was shown following ACR methodology. In UPM experiments, according to the CIETI methodology, the randomized order of TSs (including sequential PVS-VS) was presented such that the test subject was evaluating the PVS while continuously watching the 6 min video.
no degradation providing a reference of the video quality. '0' printed in the lower right corner of its frames indicated the start of the test. The following segments were the subsequence of PVS and VS. Frames of VS had printed a number indicating the former PVS number which was also the box number in the paper questionnaire to rate by the test subject. In the test session, the 11 TSs (each including 12 sequential PVS-VS pairs) were presented in a random order. For the PVS evaluation, the test subjects were asked to answer the same questions as in Aereo experiment and using identical rating scales. As a new task, after evaluating the 12 PVSs of each TS there was another question in the questionnaire asking about the overall quality of the whole sequence. 40 sec after terminating the evaluation of each TS the next one was played.
In order to allow for cross-lab comparison, the ambient and all the hardware and software used in UPM were adjusted similar to Aereo both complying with the recom-mendation ITU-R BT.500-11 [9]. A 46" in Hundai S465D display was used with the native resolution of 1920 x 1080
and 60 Hz refresh rate. The viewing distance was set to four times of display height. The TV's peak white lumi-nance was 177cd/m2 and the illumination level of the room was 20 lux. TSs (PVSs in Aereo experiment) were displayed in uncompressed format to assure that all observers were presented the same sequences. A compu-ter connected to the TV was used to play the sequences using VLC player. In order to avoid any temporal distortion introduced by the player, the videos were preloaded into the computer's RAM. The TV resolution was set to the resolution of the test videos (720p) to avoid scaling when displaying the videos.
In all experiments, prior to the test session the test subjects were screened for visual acuity and color vision. Later on, the test instruction and the rating scale provided in the observers' native language were given (mainly Spanish in UPM, Swedish in Aereo, and English for the international observers of each experiment). After reading the instruction, a training session was conducted by showing some TS/PVS samples specially prepared for training of each assessment method to familiarize the observers with the range of the qualities, quality variation and test procedure. The whole session was divided into three parts including two breaks of about 10 min when the subject was encouraged to leave the test room to minimize the fatigue effect on his evaluation. The total experiment lasted approximately 1 h and 10 min.
After post-screening of the subjective data in accor-dance with the latest recommendations from Video Qual-ity Experts Group [19], the scores of 23 observers from Aereo (7 female and 16 male, age from 18 to 68), 21 observers from UPM-Audio (6 female and 15 male, age from 27 to 50) and 22 observers from UPM-NoAudio experiment (5 female and 17 male, age from 24 to 54) were considered for evaluation. In each experiment, about 80% of the subjects had telecommunication background (engineer, researcher, etc.) and 4 to 6 of them had subscription from a media service providers.
3. Results
Fig. 3. Difference between the MOS in Audio and NoAudio
experiments (UPM). Fig. 5. Difference between the MOS in Aereo and UPM experiments.
8
3< 2
Experimental data Audio-NoAudio Diagonal
0 1 2 3 4 5
NoAudio MOS
Fig. 4. Relationship between Audio and NoAudio experiments (93% correlation).
the impact of evaluation methodology on observers' assessment, first the MOS of two UPM experiments were compared and later on the result was compared with Aereo experiment. Subsequently, the QpE of the test adaptation strategies was investigated.
3.1. Cross-experiment comparison
3.1.1. UPM experiments: impact of the audio presence Fig. 3 shows the difference between the MOS obtained from Audio and NoAudio experiments performed in UPM. It can be observed that in some of the PVSs (specially when increasing the quality in Sport, Music, and Movie2 which included scenes with dancing people) the presence of audio had positive influence up to 0.9 MOS value on evaluation of the observers. However, there are also some PVSs in other content (such as News) which perceived up to 0.6 MOS value better in NoAudio test. By computing the Pearson linear correlation coefficient between the MOS it was observed that the results of two experiments have a similar trend (correlation=93%). Fig. 4 shows this relation-ship having the results of NoAudio experiment on the
x-O Experimental data
— Acreo-UPM Diagonal
2 3 UPM MOS
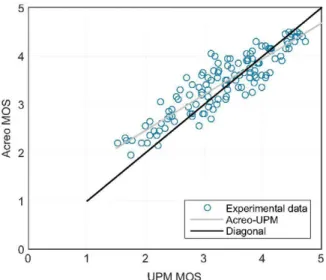
Fig. 6. Relationship between Aereo and UPM experiments (90% correlation).
axis and the Audio experiment on the y-axis. Considering the diagonal solid line as the main diagonal (indicating the ideal case in which both data sets would match to each other) and the dash-dash line as the regression mapping of Audio data to NoAudio, it is observed that the data have a small deviation upside of the reference which indicates the higher scores given in the Audio experiment. There was also slightly larger span in the MOS of NoAudio experi-ment (from 1.3 to 4.7) compared to Audio one (from 1.5 to 4.6).
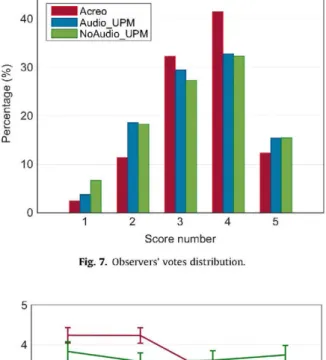
3.2.2. UPM vs. aereo: impact of the evaluation methodology Fig. 5 shows the difference between the MOS of Aereo and UPM experiments that in some of the PVSs is quite significant. From another side, the Pearson correlation between them shown in Fig. 6 was 90%. The repeated measure of ANOVA applied on two data sets, considering the same setting as the previous part, revealed no sig-nificant difference between the main effect of the evalua-tion methodology (p=0.31). Considering all the pairwise Tukey test comparing the Aereo data once with the individual UPM experiments and later on with the com-bined UPM data showed no single PVS significantly per-ceived different in any of the cases. However, by comparing the distribution of the votes in two studies, it was observed that the usage of the voting scale was different in two labs (Fig. 7). After applying the linear transformation of UPM's data to Acreo's using linear regression technique, the difference almost vanished and consequently the results of two studies were combined to be used as a single evaluation.
40
30
TO
<E 2 0
<D Q .
10
• Aereo ^ H Audio UPM ^ • N o A u d i o UPM
L
1
1 2 3 4
Score number
Fig. 7. Observers' votes distribution.
in ,
O 3
I
J
r i
,
[
L J
r
> s .
[
]
Decreasing Constant — Increasing
1 2 3 4
Adaptation Strategy
Fig. 8. Overall behavior of the adaptation strategies. Number 1 to 4 stand to GR10, GR2, RP10, RP2 for the decreasing and increasing quality status, and to N5, N3, Nl, and N600 for the constant quality state in order (cf.
Table 3).
3.2. Analysis of the QpE of adaptation strategies
Fig. 8 shows the overall perceived quality of the adaptation strategies and constant quality levels, having the HRCs on the x-axis and the average of MOS over all the content on the y-axis. For the increasing and decreasing status, numbers 1-4 stand to GR10, GR2, RP10 and RP2, and for the constant status stand to N5, N3, Nl and N600 in order (cf. codes in Table 3). To statistically analyze the results, the repeated measure of ANOVA was applied on the data considering 11 TSs, 3 test status (increasing, decreasing, and constant), and 4 conditions considered for each status as within factors. The result showed that the perceptual quality of constant 5 Mbps (N5) and 3 Mbps (N3) encoded videos are not significantly different ( p = l ) while both being significantly better compared to 1 Mbps (Nl) and 600 kbps (N600) encoded videos, and all increas-ing scenarios (p < 0.001). This outcome was also con-firmed by the Tukey test (p < 0.05 for all pairwise-comparisons). Furthermore, the QoE of all increasing scenarios was significantly better than 1 Mbps and 600 kbps encoded videos ( p < 0.001, also confirmed by the post-hoc test). By comparing the MOS of the increasing scenarios together, no difference was observed as the corresponded CIs were clearly overlapped. However, the post-hoc test revealed that the perceptual quality of IGR2 and IRP10 (interrelationship: p=0.99) is significantly lower than IGR10 and IRP2 (interrelationship: p=0.5) with p < 0.001. Regarding the decreasing scenarios, the result of both ANOVA and post-hoc test showed the significantly lower QoE of DRP10 compared to the other decreasing scenarios (p < 0.001).
3.2.2. Perceptual quality and detection of adaptation in different content
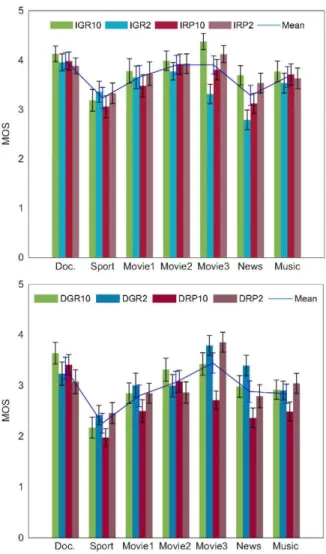
Fig. 9 presents the QoE of adaptation strategies in different content (for those SRCs examined in two variants, the average of two MOS obtained from two variants is presented). It can be seen that in general the quality switching was perceived differently in different content (cf. Mean in the plots) and this is more remarkable in Sport content. Considering the impact of amplitude and period of the quality switching and their interaction, although in most of the content no significant difference can be observed, in some of them those observations presented in the previous part (i.e. low QoE in IGR2, IRP10 and DRP10; cf. Fig. 8) are highlighted.
Doc. Sport Moviel Movie2 Movie3 News Music
Fig. 9. Perception of up-switching strategies (figure above) and down-switching strategies (figure below) in different content.
the 2 sec chunk. One possible reason could be that the step-wise changing the quality every 10 sec lets users to get used to the presented quality, and because of the human short-term memory effect as defined in [20], they might get less annoyed by changing the quality from two consecutive level. However, this cannot be the case when the quality changes every 2 sec. On the other hand, characteristic of the content could be another reason of obtaining different observations from the two aforemen-tioned test scenarios. Because the 'video segments' utilized from each SRC to evaluate the quality switching using 10 sec chunk were different than those using 2 sec chunk (cf. Fig. 2).
Fig. 11 shows the MOS in up-switching strategies and those PVSs encoded in constant quality. First of all, it can be observed that the PVSs with the constant quality were perceived differently so that in some content the quality gets extremely detracted when encoded in Nl and N600 (e.g. extreme MOS reduction in Nl perceived in Moviel and Movie2). Another interesting observation was the significantly better QoE of N3 compared to N5 in Music. By exploring in the corresponded results achieved from
Fig. 10. Perceptual impact of the switching amplitude (gradual vs. rapid) when decreasing (above) and increasing (below) the quality using small chunk (right side) and large chunk (left side) in different content
Doc. Sport Moviel Movie2 Movie3 News Music
Fig. 11. Perception of increasing strategies vs. constant quality. The data labeled as 'Increasing' represents the average MOS of all increasing scenarios.
Sport Moviel Movie2 Movie3 News Music
LS-LT HS-HT HS-LT LS-HT LS-LT HS-HT HS-LT LS-HT
Fig. 13. Impact of the spatiotemporal characteristics of the content on perception of switching amplitude (left) and chunk size (right). The content classes and MOS are presented in the x- and y-axes in order.
three experiments it was observed that the QoE of N5 obtained from Aereo experiment was about 0.9 MOS value lower than Audio and 0.25 value lower than NoAudio experiments. One possible reason could be the difference in the context of the 'video segment' in which N5 and N3 were applied that can be more effective in the single stimulus presentation of the PVS in Aereo (the former video segment mostly was showing the audience in the dark scenes with the smoke on the air which could be perceived as an impairment, while the later one showing the singing group in more bright ambient). From this figure, it is also observed that in some of the content (Documentary, Movie3, News and Music) increasing the quality does not provide better perceptual quality com-pared to the constant 1 Mbps encoded video (and of course to the constant 600 kbps).
The MOS related to detection of quality change in the PVSs including quality switching scenarios is presented in Fig. 12. It can be seen that finding the quality switching is also different in different content. Another interesting observation can be found about the switching scenarios using 2 sec chunk where in some of the content were voted as 'no change'. In an overall view (considering the Mean MOS for all the content) however, the test partici-pants accurately identified the sort of quality variation/ stability in all the HRCs.
3.2.2. Impact of spatiotemporal characteristics of the content in QoE of adaptation
Previously in [21 ] the impact of content characteristics on the user's perception of our test switching scenarios was studied. This was done by analyzing the MOS of adaptation scenarios in the PVSs which were classified by a combination of their amount of spatial-temporal (ST) complexities as formulated in [10]. Subsequently four PVS classes were resulted: low spatial- low temporal (LS-LT), low spatial- high temporal (LS-HT), high spatial- low temporal (HS-LT), or high spatial- high temporal activity (HS-HT). The statistical analysis of MOS showed that the QoE of both up- and down-switching in the content from HS-LT class is significantly lower compared to other
Table 4
Correlation between the MOS of whole seq. and mean MOS of the PVS, last 5 PVS in each sequence (UPM experiments).
Experiment Whole seq. vs. all PVS Whole seq. vs. last 5 PVS
Audio NoAudio
0.95 0.99
0.79 0.89
classes. In current study, we extended this idea by analyz-ing the impact of content characteristics on perception of different amplitude and chunk size for quality switching. To this aim, for each content class, the MOS were averaged once considering the amplitude related scenarios (DGR, DRP, etc.) and another time by considering the chunk size (DIO, D2, etc.). The results obtained from existing content classes presented in Fig. 13 showed that no matter about the switching amplitude and chunk size, impact of the adaptation in aforementioned content class is significantly lower than the content from other classes.
3.2.3. Overall quality of the adapted test sequences Table 4 shows the correlation between the MOS about the whole TSs voted by the subjects at the end of evaluat-ing the 12 PVSs in the UPM experiments, and the mean MOS of the last 5 and also all 12 PVSs in each of the sequences. It can be seen that the MOS about the quality of entire sequence was highly correlated with the average of 12 PVSs' scores in the sequence but also far less correlated with the average of last 5 PVSs' scores. For both cases, the correlation is lower in Audio experiment. On the other hand, it was observed that the scores gave for the quality of whole sequences in Audio experiment were up to 0.45 MOS value more than the ones obtained from NoAudio experiment (in 8 out of 11 sequences).
4. Discussion
the CIETI methodology developed for evaluating the long sequences to make mimicking the attribute of mentioned degradation possible. To study the impact of audio on evaluation of the test stimuli, one of the experiments was done in the presence of audio. It was observed that in some of the content (such as Sport, Music and one of the movie content including scenes with dancing people) the audio presence had positive effect up to 0.9 MOS value on the test subject's evaluation. Whilst a negative impact of audio presence up to 0.6 MOS value (in News) was also observed. One possible reason of lower subjective rating for this video could be the context of the presented news. As it has been addressed by the previous studies (e.g. [22]), the video context appeals to different psychological pro-cess (understanding, desire, engagement) which results in complex interaction with the users' perception. Here the presented news was about the usage of drugs by the young generation that perhaps in the presence of audio was more effectual for the observers.
In spite of the observed differences in two experiments, the high Pearson correlation (0.93) between the experi-mental results as well as the no significant difference resulted from ANOVA and post-hoc tests verified that two experiments can be combined. In addition, no large difference in the range of MOS values of two studies was observed (Fig. 7). This finding was different than what was previously discussed in [15] in regard to the impact of changing from video-only stimuli to audiovisual stimuli on our ability to distinguish between HRCs.
Comparing the UPM combined results with the results of Aereo, our previous study using ACR method, also indicated a relatively high correlation (0.9) and their non-significant difference was verified by ANOVA and this time also all the post-hoc tests of the same PVS in both cases. Because of the difference in the usage of voting scale in two studies, the Aereo data was linearly transformed to UPM's. The average of UPM and transformed Acreo's data was used to evaluate the switching strategies.
As mentioned, in spite of some large differences between MOS obtained from different methodologies, the result of statistical analysis did not show any signifi-cant difference between three experiments. This does not rule out that different methods can lead to different results, but with the number of subjects involved and the statistical variance in the data, the differences in the MOS values of the same PVSs were not big enough to show any statistically significant difference.
By statistically analyzing the combined results, it was observed that the perception of adaptation scenarios and also constant encoded test videos are different in different content. As it was observed in Music content, where the significantly better QoE of N3 was shown in comparison to N5 (cf. Fig. 11), the context of the video sequence could be an influence factor in this regard. From another side, this content dependency was also observed in detection of quality switching by the test subjects.
In respect to the content dependency, in general the analysis of this factor becomes more difficult when the subjective experiments are not based on a full matrix design, as was the case in this study and in Pinson et al. [15]. In principal, investigating the impact of content
characteristic is not the main goal in this type of studies, but rather getting the impact of degradations in general. However, it could be still interesting to get some indication of the impact of the content on the obtained quality ratings. To this aim, the influence of spatial-temporal complexities of the content in perceptual quality of the adaptation was analyzed. By studying the QoE of the PVSs which were classified based on their ST complexities, it was observed that the perceptual quality of adaptation in the content with high spatial and low temporal complex-ities is significantly lower compared to the other content. Since ST classification of the videos was done after the experiments, the number of content in each class was not homogenous and in some cases not enough to elaborate our analysis beyond all the test conditions. Even so, by investigating among those existing samples which were the two variables of identical SCR but from distinct content classes (i.e. the variable 1 and variable 2 of the SRCi, where HRCj was applied on, had different ST characteristics) it was observed that the amount of temporal complexity can cause up to 1.6 point improvement in MOS. This observa-tion was mostly highlighted in the up- and down-switching using 10 sec chunks.
The result also showed that the MOS of the entire sequence is highly correlated with the average of indivi-dual PVSs MOS in the sequence but far less correlated with the average of last 5 PVSs MOS. For both cases, the correlation was lower in the Audio experiment. Further-more, it was observed that the scores gave for the quality of whole sequences in Audio experiment were up to 0.45 MOS value more than the ones obtained from NoAudio experiment. However, it may not be ruled out that the subjects were affected by scoring the individual cases when giving their overall score.
It is worth to remind that the duration of PVSs was either 14 sec or 40 sec. Such a considerable difference on PVSs duration could affect the evaluation of the subjects, especially in Aereo study where the subjects watched the PVSs in single stimulus event, while in UPM study because of the continuous presentation of the video sequences, this issue might have had less effect. We believe, although the study could not show it, to assess the quality of adaptation events which in practice may last differently in different conditions, it is better to apply a continuous evaluation method rather than a clip by clip way like the ACR where the time difference easily noted by the subject.
5. Conclusions
In this study, we have compared two subjective testing methodologies, the standardized ACR method and CIETI semi-continuous method suggested by Gutierrez et al. [14] using video-only and audiovisual stimuli in two separated experiments; so in total three subjective experiments were performed. Through these experiments, we analyzed the impact of some important technical parameters for adap-tive streaming services.
rated by the two methods. The correlation was high (90%), which is, however, slightly lower than expected when repeating the same experiment twice with the same method and condition. Based on this, the subjective data was merged into one set for facilitating the analysis of the technical parameters. The key findings of the analysis of the technical parameters were as following.
• Overall, there was a statistically significantly higher QpE for the two increasing scenarios, IGR10 and IRP2, and significantly lower QpE for the decreasing scen-ario DRP10.
• The constant bitrate cases Nl and N600 had signifi-cantly lower QpE compared to increasing the quality by adaptation.
• We could not find any significant difference between the high constant bitrate cases, N5 and N3, which were both observed better than Nl and N600 as well as the increasing scenarios.
• Considering different results above, no main effect (from ANOVA and Tukey HSD post-hoc test) was obtained for any of the adaptation-related study fac-tors. In other word, in contrary to many of previous studies, using short chunk or abrupt quality switching do not necessarily degrade the QpE.
• The content had influence on the absolute MOS results especially in comparison between Nl and N600, increasing scenarios, and two chunk size. However, regarding the switching amplitude (gradual vs. rapid), no significant differences between different test con-tent could be found.
• Very strong correlation was found in NoAudio test: 99% between the overall quality of a whole 6 min video clip and mean of all the individually scored PVSs MOS that the video clip consisted of. This correlation for Audio experiment was slightly lower (95%).
We believe that this study provides an important step to optimize the perceptual quality in adaptive streaming services. In regard to the assessment methodology, although we did not find any statistical difference between conducted experiments, we think this would need to be investigated further involving a larger number of test subjects in order to statistically infer about any differences between the evaluation methods.
Acknowledgement
Many thanks go to Kun Wang and Bórje Andrén from Aereo Swedish ICT, and Muhammad Shahid from Blekinge Institute of Technology involved in design, execution and evaluation of the subjective tests. The work at UPM has been partially supported by the Ministerio de Economía y Competitividad of the Spanish Government under projects TEC2010-20412 (Enhanced 3DTV) and TEC2013-48453 (MR-UHDTV). The work at Aereo Swedish ICT AB was supported by VINNOVA (Sweden's innovation agency), which is hereby gratefully acknowledged.
Appendix A Supplementary data
Supplementary data associated with this paper can be found in the online version at http://dx.doi.Org/10.1016/j. image.2015.05.001.
References
[ 1 ] T. Arsan, Review of bandwidth estimation tools and application to bandwidth adaptive video streaming, in: Proceedings of 9th Inter-national Conference on High-Capacity Optical Networks and Emer-ging/Enabling Technologies (HONET 2012), Istanbul, Turkey, 2012, pp. 152-156.
[2] M. Zink, J. Schmitt, R. Steinmetz, Layer-encoded video in scalable
adaptive streaming, IEEE Trans. Multimed. 7 (1) (2005) 75-84.
[3] P. Ni, R Eg, A. Eichhorn, C. Griwodz, P. Halvorsen, Flicker effects in adaptive video streaming to handheld devices, in: Proceeding of the 19th ACM International Conference on Multimedia, MM'll, Scotts-dale, AZ, USA, 2011, pp. 463-472.
[4] A.K. Moorthy, L Choi, A.C. Bovik, G. de Veciana, Video quality
assessment on mobile devices: subjective, behavioral and objective studies, IEEE J. Sel. Top. Signal Process. 6 (6) (2012) 652-671.
[5] R. Mok, X. Luo, E. Chan, R. Chang, QDASH: A QoE-aware DASH system, in: Proceedings of the 3rd Multimedia Systems Conference, 2012, pp. 11-22.
[6] L. Yitong, S. Yun, M. Yinian, L Jing, L. Qj, Y Dacheng, A study on Quality of Experience for adaptive streaming service, in: Proceedings of the IEEE International Conference on Communications Work-shops (ICC), 2013, pp. 682-686.
[7] M. ¿ink, O. Kiinzel, J. Schmitt, R. Steinmetz, Subjective impression of variations in layer encoded videos, in: Proceedings of the 11th International Conference on Quality of Service, 2003, pp. 137-154.
[8] D.C. Robinson, Y Jutras, V. Craciun, Subjective video quality
assess-ment of HTTP adaptive streaming technologies, Bell Labs Tech. J. 16 (4) (2012) 5-23.
[9] ITU-R, Methodology for the Subjective Assessment of the Quality of Television Pictures, ITU-R Recommendation BT 500, January 2012. [10] ITU-T, Subjective Video Quality Assessment Methods for Multimedia
Applications, ITU-T Recommendation P.910, April 2008.
[11] N. Staelens, S. Moens, W. van den Broeck, I. Marien, B. Vermeulen,
P. Lambert, R. van de Walle, P. Demeester, Assessing quality of experience of IPTV and video on demand services in real-life environments, IEEE Trans. Broadcast. 56 (4) (2010) 458-466.
[ 12] C. Chen, L Choi, G. de Veciana, C. Caramanis, R. Heath, A. Bovik, Modeling the time varying subjective quality of HTTP video streams with rate adaptations, IEEE Trans. Image Process. 23 (5) (2014) 2206-2221.
113] S. Tavakoli, J. Gutierrez, N. Garcia, Subjective quality study of
adaptive streaming of monoscopic and stereoscopic video, IEEE J. Sel. Areas Commun. 32 (4) (2014) 684-692.
114] J. Gutierrez, P. Perez, F. Jaureguizar, J. Cabrera, N. Garcia, Subjective assessment of the impact of transmission errors in 3DTV compared to HDTV, in: Proceedings of the 3DTV Conference: The True Vision -Capture, Transmission and Display of 3D Video (3DTV-CON), 2011, pp. 1-4.
115] M. Pinson, M. Sullivan, A. Catellier, A new method for immersive Audiovisual subjective testing, in: Proceedings of the 8th Interna-tional Workshop on Video Processing and Quality Metrics for Consumer Electronics (VPQM), 2014.
116] M.-N. Garcia, F. De Simone, S. Tavakoli, N. Staelens, S. Egger, K. Brunnstrom, A. Raake, Quality of Experience and HTTP adaptive streaming: a review of subjective studies, in: Proceedings of the 6th International Workshop on Quality of Multimedia Experience (QoMEX), 2014, pp. 141-146.
[17] L. Janowski, P. Romaniak, QoE as a function of frame rate and resolution changes, in: Proceedings of the 3rd International Con-ference on Future Multimedia Networking, FMN'10, Springer-Verlag, Berlin, 2010, pp. 34-45.
118] P. Kortum, M. Sullivan, The effect of content desirability on
sub-jective video quality ratings, Hum. Factors: J. Hum. Factors Ergonom. Soc. 52(1) (2010) 105-118.
119] VQEG, Report on the Validation of Video Quality Models for High Definition Video Content, Video Quality Expert Group, Available:
<http://www.vqeg.org>, June 2010.
Proceedings of the 23rd International Teletraffic Congress (ITC), 2011, pp. 103-110.
[21] S. Tavakoli, M. Shahid, K. Brunnstrom, N. Garcia, Effect of content characteristics on quality of experience of adaptive streaming, in: Proceedings of 6th International Workshop on Quality of Multi-media Experience (QpMEX), 2014, pp. 63-64.