Engineering School
Design Engineering Research Group (GRID)
Solar beam radiation modeling for design and
simulation of V-Trough photovoltaic
applications
Graduation manuscript presented as partial requirement to obtain the
Master of Science in Engineering
(Draft Document: Version 22/08/2017)
AUTHOR:
Ing. Andrés Arias-Rosales
ADVISOR:
Ricardo Mejía-Gutiérrez, PhD.
Abstract
Photovoltaic V-Troughs use simple and low-cost non-imaging optics, namely flat mirrors, to increase the solar harvesting area by concentrating the solar rays towards the photovoltaic surface. Combined with stepped manual tracking, these devices can boost the performance of regular solar cells for residential and personalized scenarios in developing countries. The geometrical set-up of a V-Trough, related to its length and angular parameters, conditions the optical phenomena that occur as the solar beam radiation dynamically interacts with the surfaces of the device. These phenomena, such as shadows and consecutive reflections, determine the solar radiation that is effectively concentrated towards the photovoltaic area. To support the design and simulation of such devices, this research project proposes a theoretical model of their effective concentration, seeking a high flexibility in the geometrical inputs, a detailed output of the optical phenomena involved and a low computational demand. The model is based on the geometrical optics of beam solar radiation and it was experimentally validated in a statistical comparison against experimental measurements performed in a laser testing platform. Based on the model, several design performance indicators were established: i) Ce (the
average effective concentration); ii)Cost(the cost of materials); iii)Tsp(the space required). Moreover, from
the integration of these indicators in proportional comparisons, three multi-objective indices were proposed: a)ICOE (CeversusCost); b)M ICOE (CeversusCostandCeversusTspcombined); c)M DICOE (the same
comparison as the previous one but also including the discretization effects related to the solar cells). As tools for supporting the V-Trough set-up definition process, an interactive software and a series of genetic algorithms were developed based on these indicators and indices and the modeling framework developed. The proposed software, named “VTDesign”, allows a V-Trough designer to iterate and compare diverse design alternatives in real-time by means of a visualization of the optical performance, representations of the geometrical set-ups and a cost-effectiveness analysis. Among the genetic algorithms studied, a new genetic algorithm, named “GA-WA” (Genetic Algorithm - Weibull Arias), was proposed. This tool uses heuristic processes, based on biomimicry and Weibull probability distributions, in order to optimize the indicators and indices as fitness/objective functions. The intuition and the more holistic exploration of a trained engineer with VTDesign can be complemented with the broader and less biased evolutionary optimization of GA-WA. In a design case study, both VTDesign and GA-WA were implemented and found to be effective in the indices improvement, as well as efficient and flexible tools in the problem of defining the set-up of a solar V-Trough in a given personalized scenario.
Keywords: Solar Concentration, V-Trough, Manual Tracking, Modeling & Simulation, Geometrical Optics, Interactive Software, Genetic Algorithms
I would like to thank all the people who contributed, directly or indirectly, to the work of this research project and my graduate studies. I would like to express my gratitude to my advisor Ricardo Mejía–Gutiérrez for the useful comments, the support throughout my research trajectory and the freedom granted to pursue my scientific views and interests within this master’s project. Also to my advisor in wind energy projects, Gilberto Osorio-Gómez, who gave me the time I needed to accomplish this research project and encouraged me in my graduate endeavors. Special thanks to Thomas Motmans and Santiago Bernal Del Río, who assisted me in experimental ventures related to my research on solar V-Troughs.
I am grateful for the funding sources that allowed me to pursue my graduate studies and research projects: to Universidad EAFIT for the postgraduate studies grant “Undergraduate research excellence scholarship”. Also, special thanks to Colciencias (Colombian Administrative Department of Science, Technology and Innovation) and, again, Universidad EAFIT, who jointly sponsored the “Young Researchers and Innovators Program” in the 645-2014 and 761-2016 calls. I am also grateful to the Medellín’s major and Sapiencia (Superior Education Agency) for the “Award to Outstanding Undergraduate Students for their Research Engagement”, which encouraged me to pursue a research career.
Good research does not happen in isolation but in a healthy research community. Accordingly, I am deeply grateful to the Design Engineering Research Group (GRID). The casual debates, the insightful feed-back, and the funny distractions all enriched my graduate experience. Special thanks to the colleagues who shared their research projects with me and who trusted me enough to ask for advice. These were some of the most intellectually stimulating challenges. Moreover, thanks to all the“Primavera” team and all the people who made that project possible. In a country fueled by violence, Primavera was a flag of hope. The feeling of being part of something much bigger than me inspired me to choose renewable energies as the fabric of my days. In particular, special thanks to Jorge Barrera, who encouraged me to think big and to be crazy enough to believe that I can actually change the world for better.
A graduate program such as this one is highly time intensive and thus involves considerable personal sacrifices. I am grateful to the friends and family who supported me along the way at a personal level. To Laura, whose love has empowered me to face my struggles as a team effort. Thank you for patiently listening to my unnecessarily complex philosophical daily dilemmas. To my grandfather, “Vito”, who cultivated my love for engineering by teaching me how to assemble and fix all kinds of devices as a kid. To my mother, who has supported all my life decisions and made sure that everyone in the family is safe and pursues a purposeful life. You have always cultivated the creativity in me, which is nowadays my secret weapon for facing research endeavors from a different perspective. Lastly, I would like to dedicate this research project to the memory of my father, who raised me as a little scientist and made me fall in love with the quest for knowledge and a fascination for how the world works. I wish you could have known the scientist I am becoming. Perhaps in some other reality, we will discover something together.
Contents
1 Introduction 1
1.1 Background . . . 1
1.2 Research Problem Definition . . . 7
1.3 Research Questions . . . 10
1.3.1 General Research Question . . . 10
1.3.2 Specific Research Questions . . . 11
1.4 Research Objectives . . . 11
1.4.1 General Research Objective . . . 11
1.4.2 Specific Research Objectives . . . 11
1.4.3 Operationalization of the Research Objectives . . . 12
1.5 Research Scope . . . 12
1.6 Research Justification . . . 13
1.7 Methodological Framework . . . 13
1.8 Manuscript Organization . . . 15
2 State of the Art 16 2.1 Beam Radiation Modeling in V-Trough Devices . . . 16
2.2 Interactive Tools for V-Trough Design and Engineering . . . 21
2.3 Optimization Methods for V-Trough Devices . . . 22
3 Proposal of a Beam Radiation Model for V-Trough devices 25 3.1 Definition of the Conceptual Model . . . 26
3.2 Mathematical Construction of the Model . . . 35
3.3 Use and Interpretation of the Model . . . 41
4 Model Validation 44 4.1 Experimental Design . . . 44
4.2 Development of the Testing Platform . . . 47
4.3 Results and Statistical Analysis . . . 49
5 Parameters Definition in the Design Context 55 5.1 Performance Indicators and Indices in Design . . . 55
5.2 Interactive Tool: VTDesign Software . . . 59
5.2.1 Conceptual Structure in The Design Framework . . . 59
5.2.2 Interface and Usability . . . 61
5.3 Heuristic Optimization Tool: GA-WA Genetic Algorithm . . . 66
5.3.1 Heuristics Based on the Weibull Probability Distribution . . . 67
5.3.2 Proposed Scheme for GA-WA . . . 72
5.3.3 Optimization of the Genetic Parameters . . . 74
6 Case Study 78
6.1 Design Brief . . . 78
6.2 Design Goal I: Cost . . . 80
6.3 Design Goal II: Energy . . . 84
6.4 Design Goal III: Space . . . 88
7 General Analysis and Conclusions 93 7.1 Conclusions . . . 93
7.2 Scientific and Technological Contributions . . . 96
7.3 Scientific Publications . . . 96
7.4 Further Work . . . 97
List of Figures
1.1 (a) Sun-Earth radiation interactions. (b) Solar rays reach the Earth parallel to each other.
(c) Solar elevationα. . . 2
1.2 Sun’s apparent path and solar elevation (α). . . 3
1.3 Variation of the effective harvesting area of a solar panel without tracking in (a), (b) and (c); and with tracking in (d), (e) and (f). . . 4
1.4 Solar concentration methods. (a) Fresnel lens, (b) parabolic reflector, (c) compound parabolic reflector, (d) light-guide panel, (e) luminescent panel, and (f) V-Trough reflector. . . 5
1.5 Solar beam and diffuse radiation. . . 6
1.6 V-Trough photovoltaic devices for commercial or research use. 1.6(a) from Bahaidarah et al. (2015); 1.6(b) from Sangani and Solanki (2007); and 1.6(c)– 1.6(f) from Hermenean et al. (2009). . . 6
1.7 Convergence of the research context. . . 7
1.8 (a) Global cumulative PV installation (Fraunhofer Institute for Solar Energy Systems, ISE, 2016). (b) Global cumulative PV installation by Region in 2015 (Fraunhofer Institute for Solar Energy Systems, ISE, 2016). . . 7
1.9 Geometrical parameters of a V-Trough photovoltaic device. . . 8
1.10 An illustration of different contexts, V-Trough set-ups and tracking timings. . . 9
1.11 Placing research in the design context. Adapted from Imre (2007). . . 14
1.12 Research methodological framework. . . 14
3.1 Earth’s tilted axis and Sun-Earth radiation interactions. . . 26
3.2 Solar incidence at noon affected by latitude (Φ) and declination (δ). . . 27
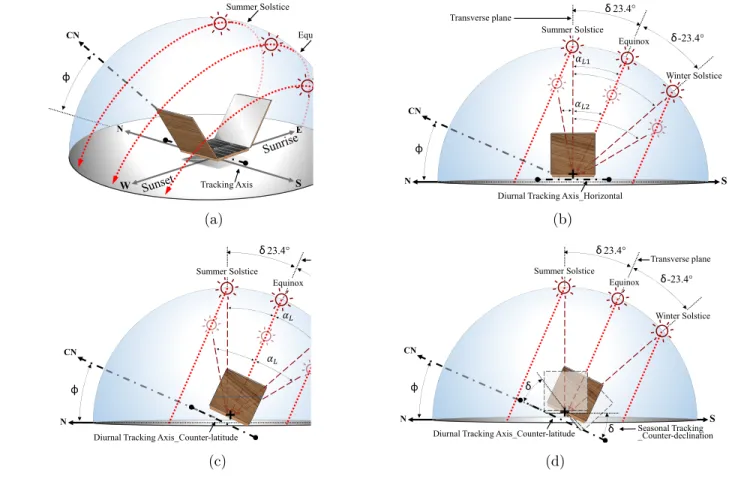
3.3 Solar paths from the perspective of a PV V-Trough located atφ= 23.4◦. . . 28
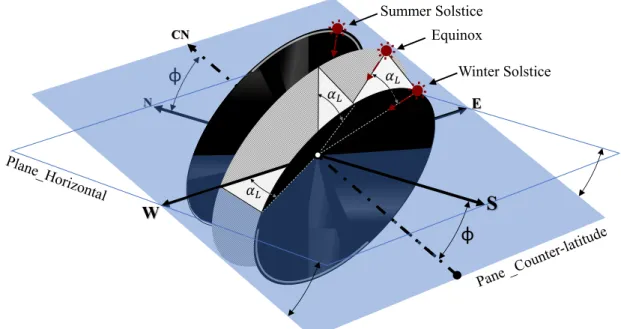
3.4 Solar incidence during summer solstice and winter solstice visualized with the analogy of symmetric cones. . . 29
3.5 V-Trough adjusted to counteract latitude (φ) and declination (δ). . . 29
3.6 Solar ray paths in a V-Trough and main geometrical parameters. . . 30
3.7 Variables describing a broad range of macro-optical phenomena in solar V-Troughs. . . 31
3.8 Diagram of the conceptual model. . . 32
3.9 Geometrical flexibility of the input parameters. . . 34
3.10 Illustration of variablespL andpR. . . 37
3.11 Boundary cases to consider when definingaLP V. . . 37
3.12 Example of cases where a portion of the rays reach the PV surface after two consecutive reflections (shadowed areas). . . 39
3.13 Boundary cases to consider when definingaLRP V. . . 40
3.14 Optical aperture lengths of a V-Trough and an equivalent flat panel at α= 70◦. . . 41
3.15 Optical aperture lengths of a V-Trough and an equivalent flat panel at α= 85◦. . . 42
3.16 Optical aperture lengths of a V-Trough and an equivalent flat panel at α= 120◦. . . 43
4.1 Visualization of the deliberately designed V-Trough set-ups for the experimental validation. . 46
4.2 Visualization of the randomly defined V-Trough set-ups for the experimental validation. . . . 47
4.3 Design of the testing platform for the experimental validation of the model. . . 48
4.4 Details of the real testing platform for the validation of the model. . . 49
4.5 Regression analysis and linear model. . . 50
4.6 Analysis of the regression residuals. . . 51
4.7 Monte Carlo test of hypothesis for the significance of the regression. . . 52
4.8 Bootstrapping 95% confidence intervals for (a), the slope, and (b), theY- intercept. . . 52
4.9 Percentage error between predicted and measured incident (C) and effective (Ce) optical concentration. . . 53
4.10 Percentage error between predicted and measured incident (C) and effective (Ce) optical concentration, in function of the Measurements. . . 54
5.1 Diagram of a V-Trough photovoltaic device shown in two different geometrical set-ups in (a) and (b). . . 56
5.2 Conceptual structure where the proposed software is contextualized. . . 60
5.3 Conceptual scheme of the modules and sub-modules. . . 60
5.4 Overall distribution of the Information module. This figure is not intended for a detailed inspection of each element, but for an overview. . . 61
5.5 Overall distribution of the Dashboard module. This figure is not intended for a detailed inspection of each element, but for an overview. . . 62
5.6 Visualization curves in the Dashboard module of VTDesign. . . 63
5.7 Visualization of the V-Trough geometries and tracking movements in the Dashboard module of VTDesign. . . 64
5.8 Visualization of (a) the potential reduction in PV area, and of (b) the linear space required for the device. . . 64
5.9 (a) Screen-shot of the Free Input module; (c) Screen-shot of the Output Data module; and (b) illustration of informative pop-ups in the Dashboard. . . 65
5.10 Overall distribution of the CAD Integration module. This figure is not intended for a detailed inspection of each element, but for an overview. . . 65
5.11 Preliminary CAD model of a given V-Trough set-up for four solar elevations. . . 66
5.12 Weibull Distribution controlled by the mean (µ). (a) k values calculated for a range of pµ. (b) The corresponding Weibull PDF curves adjusted for a range from 0 toT op= 50. . . 68
5.13 Weibull-distributed mutation values compared to a uniform and Gaussian distribution. . . 69
5.14 Weibull-distributed values for the initial population of a gene; compared to uniform and Gaussian distributions. . . 71
5.15 (a) Main scheme of the proposed genetic algorithm GA-WA.nis any positive integer greater than 0. (a) Scheme of a standard genetic algorithm. . . 73
5.16 Performance of the GA parameter combinations for (a) GAUniform, (b) GAGauss and (c) GA-WA. The combinations with the highest performance are highlighted with circles. . . 75
5.17 Worst and best parameter combinations for (a) GAUniform, (b) GAGauss and (c) GA-WA. . 76
5.18 Performance Box plots in function of the GA parameters for (a) GAUniform and GAGauss; and for (b) GA-WA. . . 77
5.19 Performance of the optimized parameter combinations for GAUniform, GAGauss and GA-WA. (a) Box plot. (b) Close-up of the evolution through the generations. . . 77
6.1 Real photos of the location inChaparral, Colombia, for the case study. (c) presents a map of the location and the average levels of radiation; modified from Ministerio de Ambiente, Vivienda y Desarrollo Territorial, Ministerio de Minas y Energía (2005). . . 79
6.2 Results of theDesign Goal I in terms ofCost. . . 81
6.3 Dynamic geometry representations of (a)V T1i, (b)V T1V T Db and (c)V T1icost. . . 82
6.4 PV area reduction of (a)V T1i, (b)V T1V T Dband (c)V T1icost. . . 82
List of Figures
vii
6.7 Results of theDesign Goal II in terms of Energy. . . 85
6.8 Dynamic geometry representations of (a)V T2i, (b)V T2V T D and (c)V T2ce. . . 86
6.9 PV area reduction of (a)V T2i, (b)V T2V T D and (c)V T2ce. . . 86
6.10 Optical performance curves of the set-ups (a)–(b)V T2i, (c)–(d)V T2V T D and (e)–(f)V T2ce. 87 6.11 (a) Preliminary CAD model and (b) realistic rendering of the fittest set-up achieved for Goal II (V T2V T D). . . 88
6.12 Results of theDesign Goal III in terms of Space required. . . 89
6.13 Dynamic geometry representations of (a) V T3i, (b)V T3V T D and (c)V T3itsp. . . 90
6.14 PV reduction of (a)V T3i, (b)V T3V T D and (c) V T3itsp. . . 90
2.1 Geometrical and optical capacities of reported beam analytical models for V-Troughs. See
the footnote.1 . . . . 19
2.2 Performance indicators and indices drawn from V-Trough analytical models. See the footnote.1 20 3.1 Minimum and maximum values allowable for the input parameters. . . 34
3.2 Relevant optical variables for the V-Trough set-up in Fig. 3.14 atα= 70◦. . . 41
3.3 Relevant optical variables for the V-Trough set-up in Fig. 3.15 atα= 85◦. . . 42
3.4 Relevant optical variables for the V-Trough set-up in Fig. 3.16 atα= 120◦. . . 43
4.1 Input parameters of the simulated V-Trough set-ups. Those designed with “D” and those randomly defined with “S”. . . 46
4.2 ANOVA table of the regression model. . . 50
5.1 Parameters for controlling GA-WA, GAGaussian and GAUniform genetic algorithms. . . 72
5.2 GA optimization parameters. . . 74
6.1 Basic consumption outline for a low-income family inChaparral, Colombia. . . 80
6.2 Geometrical set-up parameters defined for the genes in GA-WA heuristic optimization method. 80 6.3 Results of theDesign Goal I. . . 81
6.4 Results of theDesign Goal II. . . 85
6.5 Results of theDesign Goal III. . . 89
Chapter 1
Introduction
1.1
Background
This section contextualizes the research problem and describes the background convergence process that went from a topic of general interest to a specific context that delimits the research project. In this process, basic concepts are introduced which are essential to the understanding of the contributions of this research project.
As an opening for contextualization of the research problem, 1.2 billion people, almost one-fifth of the world’s population, still lack access to electricity at a household level (He and Victor, 2017; D’Amelio et al., 2016). An additional 1.5 billion people have an unreliable electricity service (He and Victor, 2017). 99.8% of these people are from developing countries and 84% come from rural areas (Shyu, 2014). Electricity is vital for accessing information, social services such as education and health, and modern life in general. In the nowadays digital age, lacking the access to it means living in isolation and being deprived of opportunities, which is in turn linked to poverty and human under-development. Moreover, the number of people in this deplorable conditions grew between 2010 and 2012, implying that population growth is actually outpacing the expansion of the electricity coverage (Panos et al., 2016).
This acute absence of basic living conditions contrasts with the rapid rate at which developing countries are becoming industrialized with fossil-fueled economies. Unfortunately, the accelerated industrialization has not accordingly reduced the inequality between urban and rural modern energy use (Herington et al., 2017). Such scenario has taken the world to a point where “Developing nations are driving the ongoing increase in global CO2 emissions”(MIT, 2015). This development has concentrated in dense urban areas
with ever increasing emissions of gases and particulate matter which can be associated with chronic health effects in the general population (Calderón-Garcidueñas et al., 2015; Johnson et al., 2017). Moreover, the developing fossil-fueled countries are accelerating the anthropogenic climate change (Lueking and Cole, 2017; Cook et al., 2014) and they are, ironically, the most vulnerable to its projected effects (Adger et al., 2003).
Therefore, it is of utmost importance to support the development of these countries based on safer and more sustainable energy sources and which can also be deployed in rural areas. Most of the developing world is located within the tropics (Kummu and Varis, 2011), where there is higher solar insolation and hence, higher solar harvesting potential. Solar energy is one of the most promising markets for a sustainable economic growth and has the potential to mitigate greenhouse emissions and fossil fuel dependence (Sampaio and González, 2017). In particular, solar photovoltaic (PV) devices based on silicon wafers are expected to dominate the energy landscape for the next decades due to their technological maturity, cost-effectiveness and the scalability needed to displace oil on a massive scale (MIT, 2015). PV devices are suitable for decentralized energy generation and can be used to provide energy to off-the-grid rural populations at a household or community level. For instance, off-the-grid solar home systems were considered vital in the Chinese quest to reach remote users (He and Victor, 2017). Where local governments have failed to provide solar energy to off-the-grid rural communities, solutions that can be implemented at a household level are crucial for the empowerment and energy independence of entire families. Additionally, household solar
devices offer the opportunity to generate an additional income for the family in the case of energy surplus, which is a major incentive for adoption of these kinds of technologies in developing countries (Otte, 2013).
However, conventional PV technology still faces engineering challenges for a widespread adoption in the developing world. Principally, the initial capital cost of residential solar Photovoltaic (PV) devices is still prohibitive for low-income families (Bahaidarah et al., 2015; Tina and Scandura, 2012; Sindhu et al., 2016; Qureshi et al., 2017; Sampaio and González, 2017). Also, the manufacture of solar cells has a high dependence on the state of technological development of the local industry (Sampaio and González, 2017; De La Tour et al., 2011). This increases the dependence on imported products, which increases the prices further. Moreover, even though solar PV energy has a comparatively low environmental impact, it still uses some toxic materials and there is not yet the proper infrastructure for large-scale recycling or disposal of solar panels (Gupta and Anderson, 1991; Miles et al., 2005). These issues may be mitigated if the photovoltaic material, needed to fulfill a household’s energy needs, is reduced. Therefore, it is crucial to develop solutions which have the potential to increase the amount of energy that can be harvested, per PV area, in a cost-effective and industrially accessible way.
The improvement of solar energy production can be approached at the level of the semiconductor ma-terial, the cell’s texturing, the panel lamination or the effective harvesting area of the device. By reducing internal losses in the semiconductor materials, it might be possible to further increase the photovoltaic ef-ficiency of silicon-based solar cells over the current record of 25.6% (Kowalczewski and Andreani, 2015). However, as the theoretical efficiency of silicon cells is around 29% (Kowalczewski and Andreani, 2015), research in this direction offers diminishing returns in the possible gains of energy production. Some of the efficiency losses in a solar panel are also caused by part of the sunlight being reflected back out from the surface. These efficiency losses can be reduced by implementing anti-reflection surfaces in the silicon cells themselves, with light-trapping nano-texturing (Salman, 2017), or in the lamination foils which are used to protect the bare silicon (Wang et al., 2017). However, the previous strategies depend on a high level of technological development in manufacturing (López, 2015) and even in nanotechnology in the case of light-trapping texturing. On the other hand, there are certain strategies which can increase the effective harvesting area of a solar panel without intervening the manufacturing of the panel itself, namely “solar tracking” and “solar concentration”; which are explained as follows.
The effective harvesting area of a solar panel, at a given time of the day, is the area of the panel projected to a plane which is perpendicular to the incident solar rays. In order to understand how the effective harvesting area is affected by the behavior of the solar rays, the Sun-Earth interactions can be considered as a reference perspective. As depicted in Figs. 1.1(a) and 1.1(b), the omnidirectional light rays emitted by the sun begin their journey so far away, that they are assumed to be parallel to each other when they reach the Earth’s atmosphere (Platt et al., 2007). Fig. 1.1(c) shows how the perceived solar elevation (α) depends on the longitude and time of a given location.
Earth
(a) (b)
Sunrise
Sunset
Noon
(c)
Figure 1.1: (a) Sun-Earth radiation interactions. (b) Solar rays reach the Earth parallel to each other. (c) Solar elevationα.
1.1 Background
3
sunrise and, as the Earth spins, it reaches α = 90◦ at noon and eventually the solar angular range ends withα= 180◦ at sunset. The solar elevation, as measured from a horizontal plane, is also affected by the latitude and the declination angle caused by the tilted rotation axis of the Earth; but these two factors are not considered in this first simplified example. From the perspective of the horizontal plane, the sun is following an apparent path through the sky-dome along the day and this is directly related to the solar incidence angle to a possible PV panel, as shown in Fig. 1.2.
Sunrise Sunset
Noon
Figure 1.2: Sun’s apparent path and solar elevation (α).
As the Effective Harvesting Area (EHA) is perpendicular to the solar rays, it might vary throughout the day with the apparent movement of the sun. Figs. 1.3(a), 1.3(b) and 1.3(c) illustrate this phenomena for a fixed horizontal solar panel. As the solar elevation differs from α= 90◦, the effective harvesting area gets reduced with the cosine of the angle of misalignment between the incoming rays and the normal to the panel (Taylor, 2000). This is crucial for energy production because a smaller effective area results in less solar radiation reaching the PV surface and thus, less electrical power can be generated.
On the other hand, Figs. 1.3(d), 1.3(e) and 1.3(f) illustrate how the inclination of a solar device (β) can be adjusted to maintain the EHA constant throughout the day. This process of adjusting the angular position of a device as a reaction to the sun’s apparent movement is known as “solar tracking”. Solar tracking strategies have been reported to increase the daily energy production in up to a 30-50% (Kelly and Gibson, 2009). In the case illustrated, the panel is performing a “perfect” tracking, so the solar incidence angle is 90◦ and the effective harvesting area is equal to the PV area.
Solar tracking can be performed by different kinds of actuation procedures, namely active, passive or manual. With active tracking the device automatically follows the sun by means of electric motors, microprocessors and electro-optical sensors (Rahimi et al., 2015). Active tracking can be performed in one (Mousazadeh et al., 2009) or two (Eldin et al., 2016; Mousazadeh et al., 2009) axis of movement, depending on the required precision. Due to the complexity and additional capital cost for an active tracking system, it might not be an appealing approach for household implementations in developing countries (Eldin et al., 2016). Passive tracking uses automatic processes based on matter re-distribution by means of evaporation (Rahimi et al., 2015; Mousazadeh et al., 2009) or progressive dripping (Foss, 2015). Seeking to favor the social adoption among non-industrialized societies, this research project focuses on manual tracking. This actuation method consists of performing manual adjustments of a device’s position in one or more steps in a day or season (Lubitz, 2011; Caton, 2014). As stated by Caton (2014), “Manual tracking is feasible for a developing community and could increase ownership”. Several studies have found that an actuation strategy, based on few stepped adjustments, might be enough to gain most of the tracking potential to maintain the effective area but with a simpler device (Hollands, 1971; Bannerot and Howell, 1979). However, it must be taken into account that a manual tracking strategy, at the household level, might introduce a disruption in the daily routines of the potential users.
(a) (b) (c)
(d) (e) (f)
Figure 1.3: Variation of the effective harvesting area of a solar panel without tracking in (a), (b) and (c); and with tracking in (d), (e) and (f).
concentration has the potential to reduce the capital cost of the device overall (Tang and Liu, 2011, 2010). Fig. 1.4 illustrates some of the solar concentration methods and optical elements.
The Fresnel method (see Fig. 1.4(a)) uses a compact and transparent lens with grooves that refract the sun rays towards a common focal point or line (Arias-Rosales et al., 2014). The parabolic troughs or dishes (see Fig. 1.4(b)) use a specular surface, curved in a parabolic shape, that reflects the sun rays towards a focal point or line (Karathanassis et al., 2017). Similarly, the compound parabolic concentrators (see Fig. 1.4(c)) use two parabolic reflectors at the ends of a solar absorber (Jaaz et al., 2017). Morgan Solar Inc. patented (Reis and Judd, 2000) a new kind of solar concentrator, so-called Light-guide Solar Optic, which redirects sunlight to a relatively small PV absorber by means of internal reflections and refractions within a compact panel (see 1.4(d)). Also with a transparent compact panel, luminescent concentrators (see 1.4(e)) use polymer sheets doped with luminescent particles which absorb and re-emit the sunlight (Wang et al., 2011; Assadi et al., 2016). On the other hand, V-Trough devices (see 1.4(f)) use flat mirrors adjacent to the borders of a PV absorber in order to reflect the sunlight towards its surface (Arias-Rosales and Mejía-Gutiérrez, 2016).
1.1 Background
5
PV
(a)PV
(b)
PV
(c)PV
(d)
PV
(e)
PV
(f)Figure 1.4: Solar concentration methods. (a) Fresnel lens, (b) parabolic reflector, (c) compound parabolic reflector, (d) light-guide panel, (e) luminescent panel, and (f) V-Trough reflector.
1979; Tang and Liu, 2011; Seitel, 1975; Bannerot and Howell, 1979; Fraidenraich, 1998, 1992). For instance, Sangani and Solanki (2007) used a V-Trough to increase the power output over 40% and reduce the cost of installed capacity by 24% as compared to a flat PV panel. V-Troughs can use regular commercial silicon cells, which contributes further to the accessibility of their technology (Tang and Liu, 2011; Maiti et al., 2012; Fraidenraich, 1998, 1992; Bahaidarah et al., 2015). Although the concentration of these devices may increase the temperature of the cells, which is detrimental for efficiency, the flat reflectors can be constructed from aluminum sheets for an effective heat dissipation (Tang and Liu, 2011). The described relative advantages of V-Troughs are crucial within the context of this research project, since the most critical barriers to the adoption of solar energy in developing countries have been reported to be the initial capital cost (Bahaidarah et al., 2015; Tina and Scandura, 2012; Sindhu et al., 2016; Qureshi et al., 2017; Sampaio and González, 2017), the reluctance of people to unfamiliar technology (Sindhu et al., 2016), technologies with reliability issues (Sindhu et al., 2016) and approaches with a high dependence on technological development (Sampaio and González, 2017).
Concentration and tracking strategies are closely related. The direction in which the solar rays are redirected, by the concentrating optical elements, depends on the solar incidence angle. This naturally generates the need to track the sun in order to keep focusing the solar rays into the PV absorber as much as possible. The higher the concentration level, the smaller the misalignment that can be tolerated (Famoso et al., 2015). Similarly, the higher the concentration level, the more the device will depend on clear weather. This is because clear skies have a greater proportion of beam solar radiation, as opposed to diffuse radiation; namely the sunlight that has been scattered by the atmosphere as shown in Fig. 1.5. Solar devices with a high concentration ratio are hence only capable of effectively using the beam radiation portion.
Beam
Diffuse
Figure 1.5: Solar beam and diffuse radiation.
Moreover, these devices do not get dangerously hot nor concentrate light in an intensely bright focal point, so they are considered to be safe for human direct manipulation. Therefore, V-Trough concentration is suitable to be combined with a stepped manual tracking, in order to increase the amount of energy per PV area, in a cost-effective and technologically simple approach. Fig. 1.6 shows photos of actual V-Trough PV devices for commercial or research use. These real-life implementations illustrate several different arranges and structures for supporting their elements and performing the tracking movements. The inherent simplicity of the main geometry of a V-Trough is evident.
(a) (b) (c)
(d) (e) (f)
Figure 1.6: V-Trough photovoltaic devices for commercial or research use. 1.6(a) from Bahaidarah et al. (2015); 1.6(b) from Sangani and Solanki (2007); and 1.6(c)– 1.6(f) from Hermenean et al. (2009).
1.2 Research Problem Definition
7
DEVELOPING COUNTRIES
Fast growth based on fossil fuels
Solar energy Household level
Photovoltaic silicon-based cells
Increase the Energy per PV area
Solar Concentration Solar Tracking
V-Trough Stepped-manual
TropicsSolar potential Lack of access to electricity
Figure 1.7: Convergence of the research context.
1.2
Research Problem Definition
In a 2015 report by Fraunhofer (see Fig. 1.8(a)) it is shown how the PV installed capacity has been growing globally at an accelerated rate. However, as also evidenced in Fig. 1.8(b), most of this installed capacity is concentrated in developed countries, such as Germany or Japan, and countries with a huge manufacturing industry, such as China. In comparison, regions of the world with a considerable proportion of developing nations, such as Africa and the Middle East, represent an almost negligible share of the market.
(a) (b)
Figure 1.8: (a) Global cumulative PV installation (Fraunhofer Institute for Solar Energy Systems, ISE, 2016). (b) Global cumulative PV installation by Region in 2015 (Fraunhofer Institute for Solar Energy Systems, ISE, 2016).
operated (Otte, 2013; Puzzolo et al., 2016). For solar devices in general, the lack of skilled professionals and training institutes (Sindhu et al., 2016), and the need for a relatively large area of installation (Sampaio and González, 2017), have also been found to be considerable barriers to adoption. On the other hand, if a rural family generates an energy surplus and manages to make an additional income from it, this may result in a major incentive for adoption (Otte, 2013). Likewise, if a considerable proportion of a solar device is built with local resources, the initial prices can drop and local employment can be generated (Otte, 2013). This can also increase the local availability of these devices; another barrier to adoption (Qureshi et al., 2017; Sampaio and González, 2017).
Consequently, it can be inferred that a solar PV device, for developing countries at a household level, may favor adoption if it can be adapted to the purchasing capacities of the family, the available space they have, their daily routines and if it can be built, operated and maintained mainly from local resources and with an acceptable level of technological familiarity. As described in Sec. 1.1, the simplicity and potential cost-effectiveness of V-Trough devices are an advantage when confronted with the described barriers to adoption. However, given the lack of widespread success of solar cookers as a reference perspective and the relatively small PV market in developing countries, it is reasonable to argue that more work needs to be done, from design and engineering, concerning the applicability of V-Trough PV solutions. In particular, the parameters that define the geometrical features of a V-Trough and the way in which they are to be adjusted for the manual tracking, can be tailored to the specific conditions and priorities of a given family. Such a democratization of this technology has the potential to make the most of the PV V-Trough concept in favor of a broader implementation.
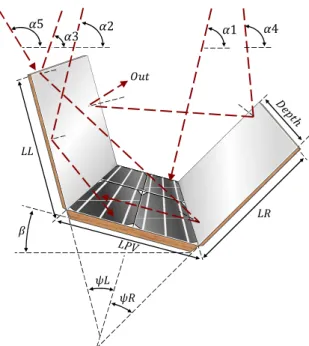
In order to get a deeper insight into what would take to personalize the configuration of PV V-Troughs, Fig. 1.9 illustrates the main geometrical parameters that define their set-up:
• LP V (the length of the PV absorber) • LL(the length of the left mirror) • LR(the length of the right mirror)
• Depth(the depth of the device)
• β (the angular position of the PV absorber) • ψL(the angular position of the left mirror) • ψR(the angular position of the right mirror)
𝛽 𝐿𝐿
𝐿𝑅 𝜓𝐿
𝜓𝑅
𝛼
Figure 1.9: Geometrical parameters of a V-Trough photovoltaic device.
1.2 Research Problem Definition
9
parameters can also be adjustable in order to maximize the effective harvesting area by means of the tracking strategy. Therefore, the flexibility of establishing those main geometrical parameters as independently fixed or dynamic is desirable for personalized design scenarios. The design scenarios can differ, for instance, in the available space for locating the device, the allowable materials cost, the energy needs, the timing and number of manual tracking adjustments that the family is willing to perform per day, and the possible shadows at the location that may limit the available solar elevation range. Fig. 1.10 illustrates how the described flexibility can allow for different V-Trough set-ups potentially tailored to different contexts and allowable tracking strategies, such as tilting (1.10(a) and 1.10(e)) or inverting (1.10(b)) the whole device, and/or independently tilting (1.10(c)), sliding (1.10(d)) or removing (1.10(f)) the mirrors. Despite the geometrical simplicity of these devices, as the lengths and angular positions in these parameters are continuous dimensions, there is an infinite number of possible V-Trough set-ups. For a more practical perspective, if each parameter is discretized into only ten possible values, and two tracking movements are allowed, then each parameter has to be defined for three positions, in which case there would be 1E15 (1015) possible set-ups.
+ + +
+
+ + +
+
+ + +
(a)
+ + +
+
+ + +
+
+ + +
(b)
+ + +
+
+ + +
+
+ + +
(c)
+ + +
+
+ + +
+
+ + +
(d)
+ + +
+
+ + +
+
+ + +
(e)
+ + +
+
+ + +
+
+ + +
(f)
Figure 1.10: An illustration of different contexts, V-Trough set-ups and tracking timings.
Given the vast number of possible V-Trough set-ups, how to support a further exploration of these devices for their implementation in personalized scenarios at a household level? One of the most critical aspects is to enable an understanding of the relevant macro-optical phenomena that results for a given set-up. According to the Oxford Dictionary of Weather (Dunlop, 2008), an optical phenomena is “phenomena caused by diffraction, reflection, refraction, or scattering by dry particles, water droplets, or ice crystals in the atmosphere or on the ground, or by the atmosphere itself”. Given the optics of V-Troughs, the term “macro-optical phenomena” will be used in this research project to refer to the reflection phenomena visible to the naked eye, such as shadows, blocked sunlight, reflected sunlight after one or two bounces off the mirrors, or the brightening of certain surfaces due to the level of concentration.
A mathematical understanding of the macro-optical phenomena involved can lead towards the calcula-tion of the optical performance of a V-trough device with any given set-up. Therefore, there is a need for a theoretical model that is capable of describing these phenomena and that establishes the effective concen-tration. This model must be geometrically flexible, as previously described, regarding the V-Trough input parameters. The geometrical flexibility and the focus on manual tracking is relevant because it demands the model to consider a broader spectrum of macro-optical phenomena which is usually ignored for more ideal conditions. For instance, if perfect continuous tracking is assumed, then there is no need to model the shad-ows that may be produced among the V-Trough’s elements and there is no need to implement asymmetric mirrors. Hence, the more flexible the model is, in its geometrical constraints, the more comprehensive it needs to be. Furthermore, given the wide space of possible solutions, this model must present a low compu-tational demand. This last requirement is also important in order to favor the democratization of V-Trough technology.
As V-Troughs interact with both diffuse and beam radiation (see Fig. 1.5), the macro-optical phenomena related to both kinds of solar radiation are expected to ultimately affect the effective concentration. How-ever, diffuse radiation behaves differently to beam radiation, so they are often modeled and conceptualized independently and their effects over optical performance are then added together (Bahaidarah et al., 2015; Kostić et al., 2010; Tina and Scandura, 2012). This project focuses on the more critical problem of beam radiation, which is typically taken as 90% of the global radiation on average (Kelly and Gibson, 2009). Once this problem is solved, it could then be complemented in further work with a diffuse model as it has been reported in the literature. Moreover, some V-Trough diffuse radiation models have been found to be an extension of a more fundamental beam model (Fraidenraich, 1992).
There are several reported theoretical models of the performance of V-Trough solar devices concerning beam radiation (see Sec. 2.1). These models are developed from the perspective of geometrical optics, which describes sunlight as projected rays that propagate in a straight path and behave according to the laws derived from Fermat’s “principle of least time” (Velzel, 2014; Chen et al., 2000). Geometrical optics is considered to be a practical tool for modeling the solar beam radiation since it offers a proper and comprehensive simplification of its macroscopic behavior. However, the reported models are not satisfactory in terms of their flexibility in the geometrical input parameters, the relevancy of their macro-optical considerations and/or their computational demand. Additionally, since the level of flexibility that this project proposes for V-Troughs is not yet found in the literature, there are no reported proposals, based on a theoretical model such as the one described, on how to guide the parameters definition process and effectively navigate the space of solutions.
1.3
Research Questions
1.3.1
General Research Question
The following research question is the backbone of this project:
How to model the macro-optical phenomena in photovoltaic V-Troughs with manual tracking, concerning beam radiation, to determine their effective concentration and support a flexible definition of their parameters in a personalized context at a household level?
For disambiguation, the following key terms are described as they are used in this research project:
• Macro-optical phenomena: It refers to the reflection phenomena visible to the naked eye, such as shadows, blocked sunlight, reflected sunlight after one or two bounces off the mirrors, or the brightening of certain surfaces due to the level of concentration.
1.4 Research Objectives
11
• Flexible parameter definition: Applied to the V-Trough design problem, this refers to the possi-bility of independently defining each of the main geometrical parameters and establish them as fixed or as dynamic. The main geometrical parameters are the lengths and angular positions of the mirrors and the PV surface.
• Personalized context: It refers to design scenarios that can differ in the available space for locating the device, the allowable materials cost, the energy needs, the timing and number of manual tracking adjustments that the family is willing to perform per day, the possible shadows at the location that may limit the available solar elevation range, and the priorities in terms of the system’s performance.
• Household level: This means that the system is intended to be deployed in or near a house, with an available clear space and operated by the family members in order to fulfill their energy needs.
1.3.2
Specific Research Questions
The following specific questions consist in a break-down of the general question. If answered satisfactorily, they are supposed to provide a solution to the general research question.
I Which are the independent and dependent variables involved?
II How are the identified variables mathematically related?
III How do the model’s predictions correspond to experimental measurements?
IV How to use the model to interactively guide the definition of a V-Trough’s parameters for a given personalized household context?
V How to use the model to optimize a V-Trough’s parameters for a given personalized household context?
1.4
Research Objectives
1.4.1
General Research Objective
The following research objective is intended to fulfill the general research question:
To propose a theoretical model of the macro-optical phenomena of beam radiation in photovoltaic V-Troughs with manual tracking, through geometrical optics, to determine their effective concentration and support a flexible definition of their parameters in a personalized household context.
For disambiguation on “geometrical optics”, refer to Sec. 1.2.
1.4.2
Specific Research Objectives
The following specific objectives consist in a break-down of the general objective. If carried out satisfactorily, they are supposed to provide a solution to the general research objective. Each specific research objective is directly aligned with the specific research question of the same number.
I To analyze the macro-optical phenomena, related to the effective concentration of beam radiation in V-Trough devices with manual tracking, in order to identify the variables involved.
II To mathematically relate the identified variables, through geometrical optics, in order to establish a theoretical model.
III To test the validity of the theoretical model by comparing it against an equivalent experimental model.
IV To propose an interactive tool, based on the theoretical model, intended to support the definition of a given V-Trough’s parameters in a personalized household context.
1.4.3
Operationalization of the Research Objectives
According to the Oxford University (2017), to operationalize is to “Express or define (something) in terms of the operations used to determine or prove it”. Accordingly, this section briefly describes variables and proce-dures that can be used to measure the fulfillment of the objectives. As the general research objective states, the motivation behind developing a theoretical model is to both “determine the effective concentration” and “support a flexible definition of [a V-Trough’s] parameters in a personalized household context”.
The effective concentration that will result from the model’s calculations concerns only beam radiation. Solar beam radiation can be experimentally modeled with laser devices which, for practical matters at this scale, follow the basic principles of geometrical optics in the same way as beam radiation (Pedrotti, 2012). Also, the effective concentration comprehends, in essence, a series of geometrical relations between the PV area and certain optical phenomena. Therefore, an experimental model can simulate those macro-optical phenomena with lasers, perform real measurements of their areas and/or lengths and compare them to the corresponding specific predictions drawn from the theoretical model. If the predictions are defined as a continuous independent variable and the experimental measurements are defined as a continuous dependent variable, it is possible to perform a statistical regression to assess the validity of the model. The residuals of this regression can be inspected looking for systematic deviations. If no systematic deviations are found, it can be assumed that the model does represent the relevant macro-optical phenomena involved. Furthermore, 95% prediction intervals can be calculated in order to assess the precision of the theoretical model.
The geometrical flexibility of the model parameters is a key feature of the research problem. To evaluate that this flexibility (defined in Sec. 1.3.1) is indeed achieved, it can be tested whether the model returns valid results without a human bias while selecting the values for the parameters. This can be achieved by delimiting each parameter to a reasonable range and selecting the corresponding values with a random generator algorithm. A number of V-Trough set-ups can be generated and modeled this way and then the theoretical predictions can be experimentally validated.
Once the model is tested for its validity and flexibility, there can be an exploratory evaluation of its practicality for supporting the parameters definition process for personalized household contexts. As it is stated in objectives IV and V, this will be assessed from both an interactive tool and a heuristic optimization tool. These will be evaluated in a case study, where it is possible to explore how suitable the model is for this matters in terms of: the time it takes to perform the simulations, the improvement of the performance results achieved over reference V-Trough set-ups and the convergence of results. In terms of the heuristic optimization tool, it is possible to measure its performance with the average fittest result achieved per every run of the algorithms.
1.5
Research Scope
The following points describe the limitations related to the scope of the research project.
• The performance of a real photovoltaic V-Trough is affected by the macro-optical interactions of beam and diffuse solar radiation, as well as by temperature-induced efficiency losses. However, as explained in Sec. 1.2, the theoretical focus of this project is concerned only with the more critical beam radiation. As it has been reported in the literature (see Sec. 1.2), this research project can be complemented in further research with diffuse radiation and temperature models.
• The validation of the theoretical model is performed through an experimental model of solar beam radiation with laser devices (see Sec. 1.4.3). Therefore, no V-Trough device is tested under real sunlight.
• It is assumed that the parameters regarding the manual tracking movements are carried out precisely by hypothetical users. Hence, no real potential users are analyzed in their capacity to perform such movements.
1.6 Research Justification
13
whether designers or engineers outside of the project are effectively guided by these tools in a V-Trough design scenario.
1.6
Research Justification
This section discusses the theoretical, practical and social relevance of this project.
This research project proposes a mathematical model that is new to the state of the art and transcends previously reported capacities regarding V-Trough modeling. This is the main theoretical contribution. As introduced in Sec. 1.2, there exists a knowledge gap which this project addresses, namely the capacity to model the beam effective concentration of V-Trough devices with a:
• Higher degree of flexibility in the input parameters • Higher detail in the macro-optical phenomena considered • Lower computational demand
The model pursued by this project, which is specifically for V-Trough solar concentrators, can also be used as a reference for developing new models for other kinds of concentrating optics. Moreover, the model can be extended, in further work, for modeling the interactions with diffuse radiation as well.
This project proposes to develop both an interactive tool and a heuristic optimization tool, based on the theoretical model, and to further explore their potential in a V-Trough design case study. Since this is the first study with such characteristics, it is in itself a theoretical contribution. The case study can provide insight into the versatile capacities that can be achieved through these tools for V-Trough design. This contribution can motivate further research in:
• An extension of the tools presented • The introduction of new similar tools
• A study of the real impact that those tools can have in a V-Trough design process with real users • A study to see if such tools can help democratize the V-Trough technology in a way that can push its
adoption forward.
The case study proposed by this project can help to illustrate the practical advantages of flexibly ex-ploring V-Trough set-ups for personalized contexts and performance priorities. Furthermore, this project intends to provide the needed theoretical framework and the tools to implement it. The interactive tool, complemented with the heuristic optimization tool, can be used by engineers and designers for real-life V-Trough implementations. Furthermore, the heuristic optimization tool could be developed into a portable application for automatically defining the geometrical parameters of a V-Trough without the intervention of a trained engineer.
The aforementioned theoretical and practical contributions of this research project can support a broader implementation of PV V-Trough devices in rural areas of developing countries. As presented in Sec. 1.1, this has a critical social relevance. V-Troughs can provide a clean and safe energy solution for families living in vulnerable situations. If these solutions result into a successful widespread adoption, it can favorably impact the access to electricity and empower energy independence. Also, V-Trough technology can help mitigate the anthropogenic climate change because it offers an alternative to a development based on fossil fuels.
1.7
Methodological Framework
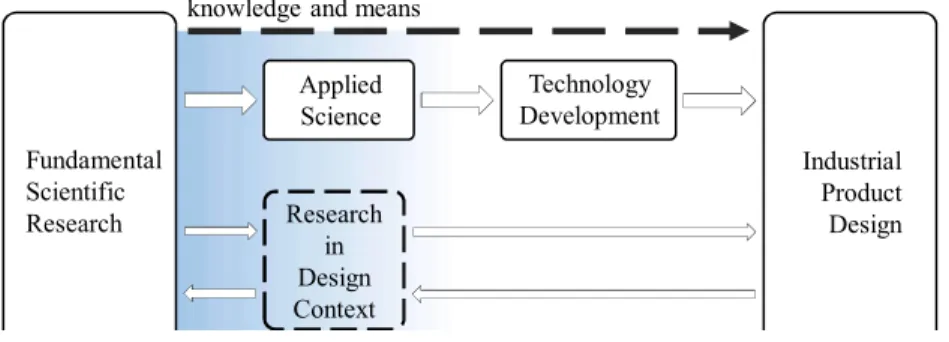
project. As stated by Imre (2007), “Contextualized research seeks to understand the semantic relationships (interplay) between the investigated phenomena, the related research variables, the concerns of design and the reflections on the concerns of design”. The methodological framework of this project, as inResearch in Design Context, is influenced by the design context in terms of the definition of the purpose of research; the circumstances in which the studied phenomena can be analyzed; the relationships that must be studied in a given context; and the interpretation of data.
Industrial Product Design Applied
Science
Technology Development knowledge and means
Purpose and Context Research
in Design Context Fundamental
Scientific Research
Figure 1.11: Placing research in the design context. Adapted from Imre (2007).
Based on the general structure of Research in Design Context (Imre, 2007; Horvath, 2008), Fig. 1.12 presents the main methodological phases for this project. The exploratory phase leads towards a
mathe-Literature Review Geometrical Exploration
Conceptual Model
Mathematical Model
Performance Indices in Design Experimental Validation
Interactive Tool Optimization ToolHeuristic
Case Study
Generalization
Exploration/Observation
Hypothesis
Theory
Validation
Exploratory Evaluation in Design
Figure 1.12: Research methodological framework.
1.8 Manuscript Organization
15
and a heuristic optimization tool. Both approaches are used in a case study for an exploratory evaluation of their capacities to support the definition of the V-Trough’s parameters in personalized design scenarios. Finally, the findings are generalized according to the theoretical and practical relevance of the project.
1.8
Manuscript Organization
State of the Art
This section presents a review of the most relevant state-of-the-art literature concerning solar V-Trough modeling and different approaches that can be used to guide or support the process of defining the geometrical parameters of these devices. These approaches were classified into two groups, namely interactive tools and optimization methods.
2.1
Beam Radiation Modeling in V-Trough Devices
The production of solar energy is all about harvesting the solar radiation. Therefore, when designing a solar device, it is of great interest to understand how solar radiation reaches the PV absorber and which factors influence its intensity at the PV surface throughout the day. This understanding can be achieved through a theoretical model that mathematically relates the variables which best describe the phenomena involved. The Oxford English Dictionary defines a model as “A simplified description, especially a mathematical one, of a system or process, to assist calculations and predictions” (Oxford University, 2017). Accordingly, this section is interested in the different models of the optical performance of solar V-Troughs and the limitations of those models when contextualized in the background of this project.
One way to model solar radiation is as quantized discrete photons (Grynberg et al., 2010) or as a propagating wave (Arriaga et al., 2004). For instance, Penttilä and Lumme (2009) used numerical wave-optical methods to simulate light scattering in porous materials. However realistic, these simulations at the level of electromagnetic waves or photons tend to lead to unnecessarily complex and computationally intensive processes when the dimensions of the simulated objects are orders of magnitude greater than the radiation’s wavelength of interest (Chen et al., 2000). As the main elements of a V-Trough are macroscopic objects with mostly smooth surfaces, there is no need to model the sunlight interactions at a quantum level. This is specially the case of this project because the ultimate objective, in terms of modeling, is the effective concentration, which relates areas and lengths pertaining to macro-optical phenomena (see 1.2).
A convenient modeling approach is hence to use geometrical optics as the conceptual and mathematical framework. Geometrical optics describes unperturbed sunlight as projected rays which propagate from a given light source in a straight path (Velzel, 2014; Chen et al., 2000). These rays, as formulated by Pierre de Fermat, follow the optical path between two points that can be traversed in the shortest time, so-called the Fermat’s “principle of least time” (Velzel, 2014). From this simple principle and taking into account the refractive index of the mediums involved, it is possible to derive the main laws that describe the behavior of a light ray, namely reflection, refraction and diffraction. In general, the predicted behavior of light by geometrical optics, when interacting with macroscopic objects and structures, is consistent with the more modern wave-theory of light (Velzel, 2014).The optical laws derived from Fermat’s principle can be described with basic geometry and yet provide a comprehensive simplification of the most relevant macroscopic be-haviors. Therefore, geometrical optics is considered to be a practical approach for modeling the unscattered solar rays, so-called beam radiation.
Beam radiation is not the only solar radiation component to be considered, especially when the simulated
2.1 Beam Radiation Modeling in V-Trough Devices
17
application is affected by a non-vacuum medium, such as Earth’s atmosphere. Nonetheless, this project focuses entirely on beam radiation because of its major role on concentration and PV energy production in general. In the design of solar concentrators, an emphasis is often put on modeling the beam component of solar radiation (Wong and Chow, 2001). This is arguable from the fact that the proportion of direct radiation is commonly taken as 90% of the global radiation as a general approximation (Kelly and Gibson, 2009). Besides, the deterministic nature of beam radiation allows for its geometrical analysis to turn into comprehensive design insights.
The modeling of beam radiation and its interactions with solar devices can be approximated numerically with ray-tracing algorithms which, in the case of solar beam radiation, are simulated with parallel light rays, that project themselves from the direction of solar incidence and behave according to the laws of geometrical optics. Ray-tracing algorithms follow the path of a large number of solar rays in order to calculate the light intensity at the PV surface (Duffie and Beckman, 2013). For instance, Bojić et al. (2015) modeled beam radiation in sea-shell shaped solar concentrators with specular ray-tracing methods. Burkhard et al. (1978) reported that numerical Monte Carlo models have been used to calculate the concentration factor of solar V-Troughs. Similarly, Maiti et al. (2012) developed a Monte Carlo ray-tracing model in order to study the effects of the angular variations of the V-Trough’s reflectors. Other studies used ray-tracing techniques to analyze the performance of asymmetrical V-Troughs with mirrors designed to be reversed twice a year for a seasonal solar tracking (Chiam, 1981; Selçuk, 1979).
Numerical models based on ray-tracing algorithms allow for a flexible exploration of the geometrical parameters of V-Troughs. The calculations are performed at the level of each singular light ray and these rays can be programmed to interact with any optical device regardless of its macroscopic shape. Nevertheless, as Collares-Pereira and Rabl (1979) stated, “a computer can produce unlimited quantities of numbers, but it provides little intuitive understanding of functional relationships”. These algorithms perform a simulation and focus on reaching a final performance result, but this does not mean that there is a real understanding of the macro-optical phenomena which is affecting this result. For instance, one might put a solar cell at a given position in a urban scenario and measure its electrical power output. This test will lead towards the final performance result but it does not empower an intuitive comprehension that can provide a deep design insight into inquiries of the situation, such as: are there shadows in the surroundings blocking part of the sunlight?, is the cell’s position optimal for that instant or for that day of the year?, are the nearby windows reflecting sunlight towards the PV surface? and so on. This is the kind of intuitive understanding that can empower design and engineering decisions when pursuing V-Troughs for personalized scenarios, yet numerical models are not in accordance to this.
Moreover, ray-tracing usually required from hundreds (León et al., 2011) to tens of thousands (Ha et al., 2017; Pei et al., 2012) of simulated light rays in order to provide a useful optical result from just one direction of solar incidence. The bigger the number of rays, the greater the precision. If the simulation is supposed to account for the solar apparent movement throughout the day, then this considerable amount of rays and calculations must be repeated for every solar elevation to be considered. This can be problematic and constraining, since the purpose of this project to support a flexible exploration of V-Trough geometries, means that the selected modeling approach should effectively be able to simulate potentially hundreds or thousands of geometrical set-ups. Referring to a similar situation with ray-tracing models, Collares-Pereira and Rabl (1979) stated that “even though the computing time is inconsequential for a few sample simulations, the large number of parameters to be considered will make any meaningful system optimization or comparison study costly and time consuming”. Backward ray-tracing has managed to make the simulations considerably more efficient, but this technique has been reported to not work properly for concentrators with non-imaging optics (Su et al., 2012). Monte Carlo ray-tracing algorithms manage to obtain a meaningful result with fewer rays because they are projected from random positions as opposed to equally separated rays. However, for non-imaging optics, it has been reported that even millions of Monte Carlo rays may still be required (Taylor, 2000). Therefore, numerical models based on ray-tracing techniques appear to be impractical for the goals of this research project and not rich enough in terms of the intuitive understanding that can be interpreted from their simulations.
obtained from the closed-form (exact or approximate) solution to the original physics-governing equations” (Li, 2015a). Solving these closed-form equations usually requires several orders of magnitude fewer calcula-tions as compared to primarily numerical models such as with ray-tracing. Even if the analytical equacalcula-tions require a numerical method to be solved, such as with the Bisection method (Hamming, 2012), it is very likely that there are less iterative calculations needed as opposed to the simulation of potentially millions of light rays. Analytical models are used to build behavioral models, which “are the most generic and effective forms describing the response of the system” (Li, 2015b). An analytical equation states the mathematical relations which describe the behavior of a physical entity. Consequently, the solar radiation models that are based on analytical calculations, tend to enable a deeper understanding of the causal relations in the phenomena addressed.
A plurality of analytical V-Trough models were found reported in the literature going from the pioneering studies of Hollands (1971) to the most recent variations of Bahaidarah et al. (2015). Most of these models were found to be analytical in terms of space, but numerical in terms of time. These models define analytical relations between the geometrical set-up of the device and the solar elevation. Hence, there are fully analytical expressions, which describe the optical performance at the specific time of the day, corresponding to a given solar elevation value. Therefore, the spatial relations are fulfilled analytically. However, as the sun changes its elevation angle throughout the day, the standard procedure is to evenly divide this trajectory in discrete steps and solve the spatial analytical model for every solar step. This procedure is hence a numerical solution in terms of time because the solar elevation is defined in function of discrete instances of time. This is a practical approach because it still considerably reduces the number of calculations per every spatial frame, as compared to fully numerical models, and yet conserves the mathematical simplicity. In principle, these models could otherwise be integrated for the solar elevation range in order to have a fully analytical solution in both spatial and time frames. However, it is not always possible or practical to solve the integrals defined from the V-Trough spatial models. As a general rule, the more flexible these models are, the more mathematically complex they become and hence, the more difficult it is to solve the integrals for a time range.
The modeling of the optical performance of a V-Trough is greatly dependent on the assumed or defined cardinal positions of itself and the plane where the solar path is contained. The relations between these two positions affect the angle of solar incidence. This angle is hence a three-dimensional phenomenon aligned with the solar apparent trajectory across the sky-dome. However, this trajectory can be simplified as two-dimensional if projected into two orthogonal planes: one aligned with the longitudinal axis of the V-Trough and the other plane defined as transverse to the device. The solar elevation projected into the transverse plane is key in determining the optical behavior of the device and directly conditions the macro-optical interactions. On the other hand, the solar elevation projected into the longitudinal plane is often considered to only affect the overall optical performance in a progressive magnitude variation according to the so-called “cosine effect”: The effective harvesting area diminishes with the cosine of the angle of misalignment between the longitudinally projected solar elevation and the normal to the PV surface (Taylor, 2000; Bannerot and Howell, 1979; Burkhard et al., 1978). In fact, most of the reported beam models are mainly two-dimensional models because the longitudinal plane is only considered with the cosine effect, while most of the modeling emphasis is placed on the transverse plane (Bahaidarah et al., 2015; Tina and Scandura, 2012; Tang and Liu, 2011; Kostić et al., 2010; Reis et al., 2010; Hermenean et al., 2009; Sangani and Solanki, 2007; Bione et al., 2004; Fraidenraich, 1998, 1992; Burkhard et al., 1978; Mannan and Bannerot, 1978; Seitel, 1975; Hollands, 1971). This two-dimensional nature has allowed for a simpler and more intuitive mathematical modeling. Only three V-Trough studies, concerning an analytical modeling of beam radiation, were found to be essentially three-dimensional (Pucar and Despic, 2002; Garg and Hrishikesan, 1988; Taha and Eldighidy, 1980).