energies
Article
Modeling Nearly Zero Energy Buildings for
Sustainable Development in Rural Areas
Reza Khakian1, Mehrdad Karimimoshaver1,* , Farshid Aram2 , Soghra Zoroufchi Benis3, Amir Mosavi4,5,6,7,* and Annamaria R. Varkonyi-Koczy6,7
1 Department of Architecture, Bu-Ali Sina University, Hamedan 6517838695, Iran; [email protected]
2 Escuela Técnica Superior de Arquitectura, Universidad Politécnica de Madrid-UPM, 28040 Madrid, Spain;
3 Department of Architecture, Semnan University, Semnan 35131-19111, Iran; [email protected]
4 Thuringian Institute of Sustainability and Climate Protection, 07743 Jena, Germany
5 Institute of Structural Mechanics, Bauhaus-Universität Weimar, 99423 Weimar, Germany
6 Department of Automation, Obuda University, 1300 Budapest, Hungary; [email protected]
7 Department of Mathematics, J. Selye University, 94501 Komarno, Slovakia
* Correspondence: [email protected] (M.K.); [email protected] (A.M.)
Received: 28 March 2020; Accepted: 18 May 2020; Published: 20 May 2020
Abstract: The energy performance of buildings and energy-saving measures have been widely investigated in recent years. However, little attention has been paid to buildings located in rural areas. The aim of this study is to assess the energy performance of two-story residential buildings located in the mountainous village of Palangan in Iran and to evaluate the impact of multiple parameters, namely building orientation, window-to-wall ratio (WWR), glazing type, shading devices, and insulation, on its energy performance. To attain a nearly zero energy building design in rural areas, the building is equipped with photovoltaic modules. The proposed building design is then economically evaluated to ensure its viability. The findings indicate that an energy saving of 29% can be achieved compared to conventional buildings, and over 22 MWh of electricity can be produced on an annual basis. The payback period is assessed at 21.7 years. However, energy subsidies are projected to be eliminated in the near future, which in turn may reduce the payback period.
Keywords: nearly zero-energy buildings (NZEB); energy performance; insulation materials; building energy estimation; window-to-wall ratio (WWR); photovoltaic; energy consumption; net zero; solar energy; renewable energy; energy models
1. Introduction
Energy demand has increased rapidly in recent years, posing myriad economic and environmental challenges worldwide, such as global warming. Accounting for over 40% of primary energy consumption and one-third of greenhouse gas (GHG) emissions, buildings are one of the most energy-intensive sectors and the top GHG emitters [1–3]. Furthermore, 25% of global energy demand and 17% of global GHG emissions are attributed to residential buildings [4]. A large share of this energy is consumed by heating, ventilation, and air conditioning systems to provide thermal comfort for occupants [5–9]. To reduce the excessive energy consumption of buildings, the concept of nearly Zero Energy Buildings (nZEB) has been put forward. An nZEB can be defined as a high-energy performance building in which the energy demand is mostly met by on-site energy generation from renewable resources [10,11]. Building design features such as building typology, orientation, construction material, and HVAC systems can be optimized to minimize building energy demand. Then, renewable energy systems can be applied to meet the demand [12,13].
Thus far, many studies have addressed these features. For instance, the effects of several factors, including window-to-wall ratio (WWR), configuration, construction material, and the percentage of air-conditioned area, were assessed on the thermal and lighting performance of high-rise office buildings in India [14]. It was revealed that the mixed-mode ventilation and insulated walls could effectively reduce HVAC loads. The impact of aerogel glazing on the thermal performance of a 40-story commercial building was studied, and it was indicated that the proposed glazing could conserve 8.5% of cooling energy compared to double glazing [15]. Huang et al. investigated several insulation materials in an office building to find the optimal material and thickness in terms of cost and energy saving, showing that an optimal insulation material can reduce the heating load by 18% compared to an uninsulated wall [16]. The scrutiny of Indonesian residential buildings indicated that natural construction material is capable of reducing the electricity consumption of dwellings [17]. The influence of building orientation on the WWR of a single-family house was examined in temperate climates considering various U-values and g-values; the optimal WWR for Ljubljana was found to vary between 38% and 42% [18]. Alghoul et al. analyzed the effect of window orientation and WWR on the energy use of an office building in Libya and concluded that the cooling demand increases and the heating demand decreases with an increase in WWR [19].
The analysis of various WWRs in different European countries indicated that the optimal WWR for office buildings tends to fall between 30% and 40% for most locations [20]. Fang et al. performed an optimization of building fenestration and envelope to improve the daylighting and energy performance of an office building in three distinctive climates, indicating that the length and width of the skylight are the most influential factors [21]. A technical and economic study was carried out to examine and introduce building retrofitting measures for a school building in Jordan, and the findings suggested that the proposed measures could save approximately 55% of energy with a payback period of 5.5 years [22]. Various passive solar and energy-saving techniques, including double glazing openings, shading devices, and different construction materials, were applied to a two-story detached house situated in Sydney, Australia; the findings demonstrated that the application of passive solar methods and high thermal mass in buildings can significantly reduce the energy consumption [23]. Lan et al. adopted a holistic zero energy building design for residential buildings in Singapore and carried out a sensitivity analysis, showing that WWR, roof solar absorptance, and window status are the determining factors on indoor thermal comfort and energy efficiency [24].
Energies2020,13, 2593 3 of 19
Although urban areas are the major contributor to air pollution and excessive energy consumption, rural buildings also play a vital role due largely to their poor design. Furthermore, rural areas are located far from electricity grids, and therefore they are prone to frequent blackouts. The cost of grid extension and development can be prohibitive considering the economic conditions in developing countries, particularly in Iran. For these reasons, the design of energy-efficient buildings can be considered as a practical alternative for alleviating the peak demand pressure on the power grid. The review of pertinent literature shows that the WWR, building orientation, and construction material are among the most influential parameters on the thermal performance of a building and that there have been only a limited number of studies on the energy performance of rural buildings. Therefore, this study aims to analyze the impact of the WWR, glazing type, building orientation, and insulation material on a rural dwelling. Moreover, to achieve nZEB targets, photovoltaic modules are integrated in the building. Finally, the adopted approach is economically evaluated to ensure its feasibly. It is worthwhile to mention that, to best of the authors’ knowledge, nZEB rural buildings have not been fully investigated and that this study attempts to address both energy efficiency and renewable energy generation aspects.
2. Materials and Methods
In order to attain a sustainable building design in rural areas, this study aimed to assess the impact of multiple parameters on the thermal behavior of a building located in Palangan, Iran. The following is a detailed account of the adopted procedure.
2.1. Site Description
Palangan, with a coordination of 35◦040 N 46◦360 E, is a mountainous village located in the Kurdistan Province of Iran at an altitude of 1470 m. As shown in Figure1, this village has a stair-steps architecture, and the rooves of lower buildings are used as yards for upper buildings. The village has a Mediterranean-like climate with hot, dry summers and cold, wet winters and falls under the Csa Köppen–Geiger climate category (see Table1). The climatic information of the village is presented in Table1. The annual mean air temperature is nearly 13◦C, and the precipitation can vary from 0 mm in summer to 85 mm in winter.
Energies 2020, 13, x FOR PEER REVIEW 3 of 21
Although urban areas are the major contributor to air pollution and excessive energy consumption, rural buildings also play a vital role due largely to their poor design. Furthermore, rural areas are located far from electricity grids, and therefore they are prone to frequent blackouts. The cost of grid extension and development can be prohibitive considering the economic conditions in developing countries, particularly in Iran. For these reasons, the design of energy-efficient buildings can be considered as a practical alternative for alleviating the peak demand pressure on the power grid. The review of pertinent literature shows that the WWR, building orientation, and construction material are among the most influential parameters on the thermal performance of a building and that there have been only a limited number of studies on the energy performance of rural buildings. Therefore, this study aims to analyze the impact of the WWR, glazing type, building orientation, and insulation material on a rural dwelling. Moreover, to achieve nZEB targets, photovoltaic modules are integrated in the building. Finally, the adopted approach is economically evaluated to ensure its feasibly. It is worthwhile to mention that, to best of the authors’ knowledge, nZEB rural buildings have not been fully investigated and that this study attempts to address both energy efficiency and renewable energy generation aspects.
2. Materials and Methods
In order to attain a sustainable building design in rural areas, this study aimed to assess the impact of multiple parameters on the thermal behavior of a building located in Palangan, Iran. The following is a detailed account of the adopted procedure.
2.1. Site Description
Palangan, with a coordination of 35°04′ N 46°36′ E, is a mountainous village located in the Kurdistan Province of Iran at an altitude of 1470 m. As shown in Figure 1, this village has a stair-steps architecture, and the rooves of lower buildings are used as yards for upper buildings. The village has a Mediterranean-like climate with hot, dry summers and cold, wet winters and falls under the Csa Köppen–Geiger climate category (see Table 1). The climatic information of the village is presented in Table 1. The annual mean air temperature is nearly 13 °C, and the precipitation can vary from 0 mm in summer to 85 mm in winter.
Table 1.Climatic information of Palangan.
Altitude (m)
Dry-Bulb Temperature
(◦ C)
Dew-Point Temperature
(◦ C)
Direct Normal Solar
(kWh)
Diffuse Horizontal Solar (kWh)
Wind Speed (m/s)
Wind Direction (◦
)
Atmospheric Pressure (Pa)
1470 14.24 0.34 2194 566 2.08 196 86,500
2.2. Building Description
A 2-story building with a total area of 159 m2, as depicted in Figure2, typical of Palangan, was
selected as the case study. Figure3demonstrates the 2D plan of the building. It can be seen that the ground floor comprises a kitchen, a toilet, a bathroom, a living room, and a bedroom. There are three bedrooms on the second floor. The building walls are made of stone with a thickness of 80 cm, and 3-mm single glazing windows are considered. The details of the building envelope and windows are provided in Tables2and3, respectively. For heating and cooling purposes, the building is outfitted with a 4-pipe fan coil unit. The heating and cooling setpoints are taken to be 20 and 26◦C, respectively. The internal gains of the building are also summarized in Table4. Different views of the building are shown in Figure4, including right, left, and front lights.
Energies 2020, 13, x FOR PEER REVIEW 4 of 21
Table 1. Climatic information of Palangan.
Altitude (m)
Dry-Bulb Temperatur
e (°C)
Dew-Point Temperature
(°C)
Direct Normal Solar (kWh)
Diffuse Horizontal Solar (kWh)
Wind Speed (m/s)
Wind Direction
(°)
Atmospheric Pressure (Pa)
1470 14.24 0.34 2194 566 2.08 196 86,500
2.2. Building Description
A 2-story building with a total area of 159 m2, as depicted in Figure 2, typical of Palangan, was selected as the case study. Figure 3 demonstrates the 2D plan of the building. It can be seen that the ground floor comprises a kitchen, a toilet, a bathroom, a living room, and a bedroom. There are three bedrooms on the second floor. The building walls are made of stone with a thickness of 80 cm, and 3-mm single glazing windows are considered. The details of the building envelope and windows are provided in Tables 2 and 3, respectively. For heating and cooling purposes, the building is outfitted with a 4-pipe fan coil unit. The heating and cooling setpoints are taken to be 20 and 26 °C, respectively. The internal gains of the building are also summarized in Table 4. Different views of the building are shown in Figure 4, including right, left, and front lights.
Figure 2. The building 3D model.
(a) (b)
Figure 3. 2D plan: (a) ground floor, (b) second floor. Figure 2.The building 3D model.
Energies 2020, 13, x FOR PEER REVIEW 4 of 21
Table 1. Climatic information of Palangan.
Altitude (m)
Dry-Bulb Temperatur
e (°C)
Dew-Point Temperature
(°C)
Direct Normal Solar (kWh)
Diffuse Horizontal Solar (kWh)
Wind Speed (m/s)
Wind Direction
(°)
Atmospheric Pressure (Pa)
1470 14.24 0.34 2194 566 2.08 196 86,500
2.2. Building Description
A 2-story building with a total area of 159 m2, as depicted in Figure 2, typical of Palangan, was selected as the case study. Figure 3 demonstrates the 2D plan of the building. It can be seen that the ground floor comprises a kitchen, a toilet, a bathroom, a living room, and a bedroom. There are three bedrooms on the second floor. The building walls are made of stone with a thickness of 80 cm, and 3-mm single glazing windows are considered. The details of the building envelope and windows are provided in Tables 2 and 3, respectively. For heating and cooling purposes, the building is outfitted with a 4-pipe fan coil unit. The heating and cooling setpoints are taken to be 20 and 26 °C, respectively. The internal gains of the building are also summarized in Table 4. Different views of the building are shown in Figure 4, including right, left, and front lights.
Figure 2. The building 3D model.
(a) (b)
Energies2020,13, 2593 5 of 19
Energies 2020, 13, x FOR PEER REVIEW 5 of 21
(a) (b)
(c)
Figure 4. Different views of the building: (a) right view (east-facing façade), (b) left view (west-facing façade), (c) front view (south-facing façade).
Table 2. Construction materials and their specifications.
Elements Material Thickness
(m)
Density (kg/m3)
Specific Heat (J/kg·K)
Conductivity (W/m·K)
U-Value
Walls and roof Stone 0.8 2880 840 3.49 2.505
Table 3. Glazing specifications.
Glazing Type
Glazing Thickness (mm)
Total Solar Transmission (SHGC)
U-Value (W/m2K)
Single clear 3 0.768 3.835
Table 4. Internal gains of the building.
General Lighting (kWh/m2)
Occupancy (kWh/m2)
Solar Gains Exterior Windows (kWh/m2)
Zone Sensible Heating (kWh/m2)
Zone Sensible Cooling (kWh/m2) Figure 4.Different views of the building: (a) right view (east-facing façade), (b) left view (west-facing façade), (c) front view (south-facing façade).
Table 2.Construction materials and their specifications.
Elements Material Thickness (m) Density
(kg/m3)
Specific Heat
(J/kg·K)
Conductivity
(W/m·K) U-Value
Walls and roof Stone 0.8 2880 840 3.49 2.505
Table 3.Glazing specifications.
Glazing Type Glazing Thickness (mm) Total Solar Transmission (SHGC) U-Value (W/m2K)
Single clear 3 0.768 3.835
Table 4.Internal gains of the building.
General Lighting
(kWh/m2)
Occupancy
(kWh/m2)
Solar Gains Exterior
Windows (kWh/m2)
Zone Sensible
Heating (kWh/m2)
Zone Sensible
Cooling (kWh/m2)
2.3. Simulation Tool
EnergyPlus, developed by the US department of energy, is a building simulation tool that encompasses the capabilities of the DOE-2 and Blast programs [36]. However, EnergyPlus does not have a user-friendly interface. Thus, in this study DesignBuilder (V 6.0), which uses the EnergyPlus engine for energy simulations and is an advanced user interface [37,38], was employed.
2.4. Studied Parameters
For minimizing the energy consumption, the impact of several parameters that include the orientation, window-to-wall ratio (WWR), glazing type, shading devices, and insulation material on the energy performance of the building were studied.
2.4.1. Orientation
To find the optimal configuration for the building, the building was rotated from 0◦to 90◦clockwise.
2.4.2. WWR
The WWR varies from 20% to 50% by 10%. This range was selected in order not to invade the local architecture of the study area.
2.4.3. Glazing Type
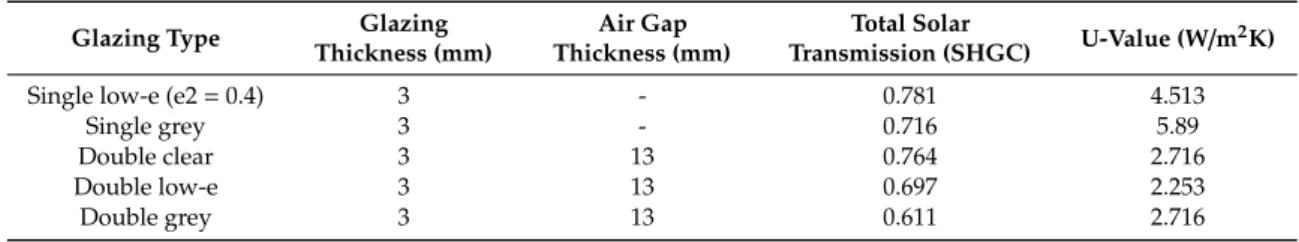
Single and double glazing windows with various types of glass were examined. The considered glazing types and their optical properties are presented in Table5.
Table 5.Glazing types and their properties.
Glazing Type Glazing
Thickness (mm)
Air Gap Thickness (mm)
Total Solar
Transmission (SHGC) U-Value (W/m2K)
Single low-e (e2=0.4) 3 - 0.781 4.513
Single grey 3 - 0.716 5.89
Double clear 3 13 0.764 2.716
Double low-e 3 13 0.697 2.253
Double grey 3 13 0.611 2.716
2.4.4. Shading Devices
The building with and without overhangs was simulated to see its impact on energy performance. Wooden overhangs with a width of 1 m were attached to the windows.
2.4.5. Insulation Material
The inclusion of insulation material in the external walls was one of the energy-saving measures. In this regard, several insulation materials were examined, and then the one with optimal performance was proposed. Table6shows the materials considered and the U-value of the external walls.
Table 6.Insulation materials and their specifications.
Type Conductivity (W/m·K) Specific Heat (J/kg·K) Density (kg/m3) Thickness (m)
Aerated concrete 0.12 1004 550 0.08
Cellulose 0.04 1381 48 0.08
Glass Wool 0.036 840 20 0.08
Polyurethane 0.028 1470 30 0.08
Energies2020,13, 2593 7 of 19
2.5. Photovoltaic
To attain nZEB features, photovoltaic (PV) modules were mounted on the roof. To asses the output power of the PV system, DesignBuilder adopted equivalent to one diode or a four-parameter-equivalent circuit method where the slope of the IV curve is zero under short circuit conditions [18]:
dI dV
!
v=0
=0. (1)
The four parameters,IL,re f,IO,re f,g, andRs, were obtained from manufacture’s catalogue [18].
The equation can be defined follows.
I=IL−IO "
exp q
γkTc
(V+IRs) !
−1
#
. (2)
In the above equation,I,V,k,Tc,q, andRsare the current flowing through the PV, the load, the load
voltage, the Boltzmann constant, the module temperature, the electron charge constant, and the module series constant, respectively.ILis the photocurrent that correlates linearly with the incident radiation
and is expressed as:
IL=IL,re f GT GT,re f
. (3)
GT, GT,re f, and IL,re f are total incident radiation, incident radiation at a reference condition,
and module photocurrent at a reference condition, respectively.GT,re f is a constant with a value of
1000 W/m2.
The diode reverse saturation current,IO, varies with the temperature and is calculated by the
following equation [18]:
IO IO,re f
= Tc Tc,re f
!3
. (4)
IO,re f is the diode reverse saturation current, andTc,re f is the module temperature at standard
conditions. WhenIOandILare assessed by Equations (3) and (4), the Newton method is employed to
calculate the PV current. Furthermore, an iterative technique is also used to give the current (Imp) and
voltage (Vmp) at the maximum power.
IL,re f,IO,re f, andγcan be separated. First, the current and voltage are replaced into Equation (2) at
the open circuit (oc), short circuit (sc), and maximum power (mp) conditions:
0=IL,re f−IO,re f "
exp q
γkTc,re f Voc,re f
!
−1
#
−Voc,re f Rsh
, (5)
Isc,re f =IL,re f−IO,re f "
exp qIsc,re fRs γkTc,re f
!
−1
#
−Isc,re fRs Rsh
, (6)
Imp,re f =IL,re f−IO,re f "
exp q
γkTc,re f
Vmp,re f+Imp,re fRs !
−1
#
−Vmp,re f +Imp,re fRs Rsh
, (7)
where the term−1 can be dropped, as it has an insignificant impact on the right side of the equation. The following equations that separate the three parameters can be expressed by some modifications [18].
IL,re f ≈Isc,re f, (8)
γ=
qVmp,re f−Voc,re f+Imp,re fRs
kTc,re fln(1−
Imp,re f
Isc,re f )
IO,re f =
Idc,re f
exp
qV
oc,re f
γkTc,re f
. (10)
To determine the final parameter, the derivative of the voltage must be computed with regard to the temperature at a reference short circuit condition that is defined as follows:
∂Voc
∂Tc
=µvoc=
γk q
"
ln Isc,re f IO,re f !
+Tcµisc Isc,re f
− 3+ qε AkTc,re f
!#
. (11)
In the above equation,µvoc,µisc, andεdemonstrate the temperature coefficient of the open circuit,
the temperature coefficient of the short circuit, and the bandgap, respectively. Acan be expressed as follows:
A= γ
Ns, (12)
whereNssignifies the number of solar cells in a PV module.
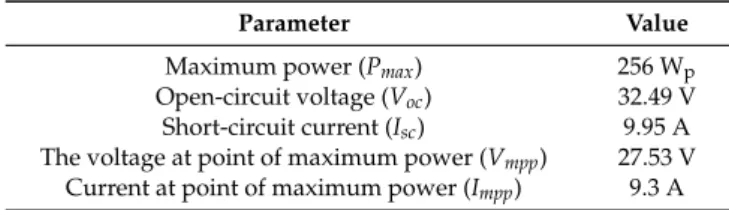
The specifications of PVs are summarized in Table7. Fifty PV modules, each with a nominal power of 250 W, were installed. It should be noted that the total nominal power of the PV system was 12.8 kW. The modules were tilted at an angle of 36◦toward the south.
Table 7.Specifications of the photovoltaic (PV) modules at standard test conditions (STC).
Parameter Value
Maximum power (Pmax) 256 Wp
Open-circuit voltage (Voc) 32.49 V
Short-circuit current (Isc) 9.95 A
The voltage at point of maximum power (Vmpp) 27.53 V
Current at point of maximum power (Impp) 9.3 A
2.6. Validation
Many researchers have verified and validated the EnergyPlus engine and DesignBuilder software, such as studies reported by Blanco et al. [39], Zhuang et al. [40], Anđelkovi´c et al. [41], Alam et al. [42], Fernando Garsia et al. [43], and Shehadi [44]. However, to be assured of the reliability of our findings, a single zone building located in Melbourne, Australia, as presented by Alam et al., was selected for validation. Further information about the building is available in Alam et al. [42]. As shown in Figure5, the building is modeled and simulated in DesignBuilder from 1 April to 2 April. Figure6 depicts the hourly results reported by Alam et al. and the current study. It can be seen that the findings of the present study are in agreement with those presented by Alam et al.Energies 2020, 13, x FOR PEER REVIEW 10 of 21
Figure 5. Single zone building model by adapted from Alam et al. [42].
Figure 6. The comparison of the indoor temperature of the single zone building.
3. Results and Discussion
Having simulated the building considering various cases, we present the findings in this section.
3.1. Building Orientation
The monthly natural gas (NG) and electricity consumption of the building for different orientations are presented in Figures 7 and 8, respectively. It can be seen that the building rotated 30° clockwise has the minimum NG and electricity consumption, with values of 19.5 MWh and 5 MWh, respectively. As shown in Table 8, the total energy is reduced by 1.6 MWh, indicating an energy saving of nearly 6%. The building rotated 60° increases in both NG and electricity consumption by 7.4% and 22.5%, respectively.
0 7 14 21 28 1: 00 2: 00 3: 00 4: 00 5: 00 6: 00 7: 00 8: 00 9: 00 10 :00 11 :00 12 :00 13 :00 14 :00 15 :00 16 :00 17 :00 18 :00 19 :00 20 :00 21 :00 22 :00 23
:00 0:00 1:00
Temperature
(
°
C)
Time (hr)
Alam et al. Present study
Energies2020,13, 2593 9 of 19
Energies 2020, 13, x FOR PEER REVIEW 10 of 21
Figure 5. Single zone building model by adapted from Alam et al. [42].
Figure 6. The comparison of the indoor temperature of the single zone building.
3. Results and Discussion
Having simulated the building considering various cases, we present the findings in this section.
3.1. Building Orientation
The monthly natural gas (NG) and electricity consumption of the building for different orientations are presented in Figures 7 and 8, respectively. It can be seen that the building rotated 30° clockwise has the minimum NG and electricity consumption, with values of 19.5 MWh and 5 MWh, respectively. As shown in Table 8, the total energy is reduced by 1.6 MWh, indicating an energy saving of nearly 6%. The building rotated 60° increases in both NG and electricity consumption by 7.4% and 22.5%, respectively.
0 7 14 21 28 1: 00 2: 00 3: 00 4: 00 5: 00 6: 00 7: 00 8: 00 9: 00 10 :00 11 :00 12 :00 13 :00 14 :00 15 :00 16 :00 17 :00 18 :00 19 :00 20 :00 21 :00 22 :00 23
:00 0:00 1:00
Temperature
(
°
C)
Time (hr)
Alam et al. Present study
Figure 6.The comparison of the indoor temperature of the single zone building.
3. Results and Discussion
Having simulated the building considering various cases, we present the findings in this section.
3.1. Building Orientation
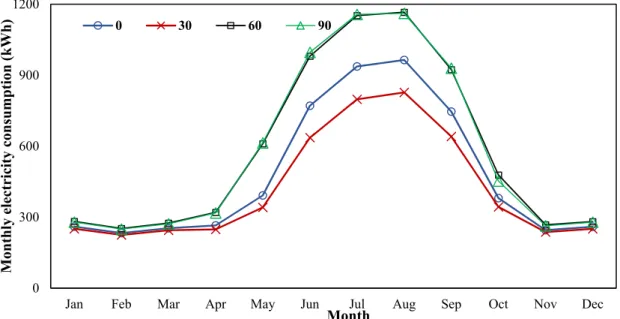
The monthly natural gas (NG) and electricity consumption of the building for different orientations are presented in Figures7and8, respectively. It can be seen that the building rotated 30◦clockwise has the minimum NG and electricity consumption, with values of 19.5 MWh and 5 MWh, respectively. As shown in Table 8, the total energy is reduced by 1.6 MWh, indicating an energy saving of nearly 6%. The building rotated 60◦increases in both NG and electricity consumption by 7.4% and 22.5%, respectively.
Energies 2020, 13, x FOR PEER REVIEW 11 of 21
Figure 7. Monthly natural gas consumption for different building orientations (°).
Figure 8. Monthly electricity consumption for different building orientations (°).
Table 8. The annual energy consumption and energy saving for various building orientations.
Consumption Factors 0° 30° 60° 90°
Annual NG use (kWh) 20,442 19,548.12 21,961 19,992
NG saving (%) - 4.4 −7.4 2.2
Annual electricity use (kWh) 5707 5043.729 6990 6974
Electricity saving (%) - 11.6 −22.5 −22.2
Total site energy (kWh) 26,149 24,592 28,950 26,966
Total energy saving (%) - 5.96 −10.71 −3.12
0 1000 2000 3000 4000 5000 6000 7000
Jan Feb Mar Apr May Jun Jul Aug Sep Oct Nov Dec
Monthly
NG
consumption
(kWh)
Month
0 30 60 90
0 300 600 900 1200
Jan Feb Mar Apr May Jun Jul Aug Sep Oct Nov Dec
Monthly
electricity consumption
(kWh)
Month
0 30 60 90
Energies2020,13, 2593Figure 7. Monthly natural gas consumption for different building orientations (°). 10 of 19
Figure 8. Monthly electricity consumption for different building orientations (°).
Table 8. The annual energy consumption and energy saving for various building orientations.
Consumption Factors 0° 30° 60° 90°
Annual NG use (kWh) 20,442 19,548.12 21,961 19,992
NG saving (%) - 4.4 −7.4 2.2
Annual electricity use (kWh) 5707 5043.729 6990 6974
Electricity saving (%) - 11.6 −22.5 −22.2
Total site energy (kWh) 26,149 24,592 28,950 26,966
Total energy saving (%) - 5.96 −10.71 −3.12
0 1000 2000 3000 4000 5000 6000 7000
Jan Feb Mar Apr May Jun Jul Aug Sep Oct Nov Dec
Monthly
NG
consumption
(kWh)
Month
0 30 60 90
0 300 600 900 1200
Jan Feb Mar Apr May Jun Jul Aug Sep Oct Nov Dec
Monthly
electricity consumption
(kWh)
Month
0 30 60 90
Figure 8.Monthly electricity consumption for different building orientations (◦).
Table 8.The annual energy consumption and energy saving for various building orientations.
Consumption Factors 0◦ 30◦ 60◦ 90◦
Annual NG use (kWh) 20,442 19,548.12 21,961 19,992
NG saving (%) - 4.4 −7.4 2.2
Annual electricity use (kWh) 5707 5043.729 6990 6974 Electricity saving (%) - 11.6 −22.5 −22.2 Total site energy (kWh) 26,149 24,592 28,950 26,966 Total energy saving (%) - 5.96 −10.71 −3.12
3.2. Window-to-Wall Ratio
Energies2020,13, 2593 11 of 19
Energies 2020, 13, x FOR PEER REVIEW 12 of 21
3.2. Window-to-Wall Ratio
The monthly natural gas (NG) and electricity consumption of the building for various window-to-wall ratios (WWR) are presented in Figures 9 and 10, respectively. It can be seen that the NG consumption is the minimum when the WWR is 50% for all the months. The difference between the various WWRs is more significant in colder months, including January, February, March, and December. This can be justified by the fact that a higher percentage of window area increases the solar heat gain, which in turn reduces the heating demand of the building. However, a lower WWR performs better in terms of electricity consumption since it minimizes the solar gains. This is in agreement with the study of Xue et al., which indicated that a higher WWR results in a greater amount of cooling load [33]. The annual energy consumption and energy-saving values are provided in Table 9. The NG consumption is reduced by 3.4 MWh/year, with an increase in WWR from 20% to 50%, showing an NG saving of 16.7%, while the electricity use rises from 5.7 MWh for a WWR of 20% to 8.3 MWh for 50%. When a WWR of 20% is used, an electricity saving of 46.3% can be achieved compared to a WWR of 50%. Considering the total site energy, as presented in Table 9, the optimal value for the WWR is 40%, since it leads to an annual energy saving of 3.63% compared to a WWR of 20%.
Figure 9. Monthly natural gas consumption for different window-to-wall ratio (WWRs).
Figure 10. Monthly electricity consumption for different WWRs.
0 1000 2000 3000 4000 5000 6000
Jan Feb Mar Apr May Jun Jul Aug Sep Oct Nov Dec
Monthly
NG
consumption
(
kWh)
Month
20% 30% 40% 50%
0 300 600 900 1200 1500
Jan Feb Mar Apr May Jun Jul Aug Sep Oct Nov Dec
Monthly
electricity consumption
(kWh)
Month
20% 30% 40% 50%
Figure 9.Monthly natural gas consumption for different window-to-wall ratio (WWRs).
Energies 2020, 13, x FOR PEER REVIEW 12 of 21
3.2. Window-to-Wall Ratio
The monthly natural gas (NG) and electricity consumption of the building for various window-to-wall ratios (WWR) are presented in Figures 9 and 10, respectively. It can be seen that the NG consumption is the minimum when the WWR is 50% for all the months. The difference between the various WWRs is more significant in colder months, including January, February, March, and December. This can be justified by the fact that a higher percentage of window area increases the solar heat gain, which in turn reduces the heating demand of the building. However, a lower WWR performs better in terms of electricity consumption since it minimizes the solar gains. This is in agreement with the study of Xue et al., which indicated that a higher WWR results in a greater amount of cooling load [33]. The annual energy consumption and energy-saving values are provided in Table 9. The NG consumption is reduced by 3.4 MWh/year, with an increase in WWR from 20% to 50%, showing an NG saving of 16.7%, while the electricity use rises from 5.7 MWh for a WWR of 20% to 8.3 MWh for 50%. When a WWR of 20% is used, an electricity saving of 46.3% can be achieved compared to a WWR of 50%. Considering the total site energy, as presented in Table 9, the optimal value for the WWR is 40%, since it leads to an annual energy saving of 3.63% compared to a WWR of 20%.
Figure 9. Monthly natural gas consumption for different window-to-wall ratio (WWRs).
Figure 10. Monthly electricity consumption for different WWRs.
0 1000 2000 3000 4000 5000 6000
Jan Feb Mar Apr May Jun Jul Aug Sep Oct Nov Dec
Monthly
NG
consumption
(
kWh)
Month
20% 30% 40% 50%
0 300 600 900 1200 1500
Jan Feb Mar Apr May Jun Jul Aug Sep Oct Nov Dec
Monthly
electricity consumption
(kWh)
Month
20% 30% 40% 50%
Figure 10.Monthly electricity consumption for different WWRs.
Table 9.The annual energy consumption and energy saving for various percentages of WWR.
Consumption Factors 20% 30% 40% 50%
Annual NG use (kWh) 20,442 18,831 17,576 17,028
NG saving (%) - 7.9 14.0 16.7
Annual electricity use (kWh) 5707 6591 7625 8348 Electricity saving (%) - −15.5 −33.6 −46.3 Total site energy (kWh) 26,149 25,422 25,201 25,376
Total energy saving (%) - 2.78 3.63 2.96
3.3. Glazing Type
Energies2020,13, 2593 12 of 19
the superior performance. Table10 summarizes the annual energy consumption of the building. The double clear glazing saves 2.2% of the NG consumption compared to the single clear, while the double grey can conserve 5.9% of the electricity use. It should also be noted that the double glazing windows have a better performance in terms of both NG and electricity use. The double low-e and double clear glazing can reduce the annual total energy by 0.61 MWh (2.3%) and 0.57 MWh (2.2%) compared to the single clear, respectively.
Table 9. The annual energy consumption and energy saving for various percentages of WWR.
Consumption Factors 20% 30% 40% 50%
Annual NG use (kWh) 20,442 18,831 17,576 17,028
NG saving (%) - 7.9 14.0 16.7
Annual electricity use (kWh) 5707 6591 7625 8348 Electricity saving (%) - −15.5 −33.6 −46.3 Total site energy (kWh) 26,149 25,422 25,201 25,376 Total energy saving (%) - 2.78 3.63 2.96
3.3. Glazing Type
Six types of glazing, including single clear, single low-e, single grey, double clear, double low-e, and double grey have been studied. The monthly NG and electricity use are presented in Figures 11 and 12, respectively. The NG consumption varies only slightly with the type of glazing. Double clear and double low-e glazing have a lower NG consumption than single clear, which is used in the base case in most months except for May and August. The other glazing types increase the NG consumption. All the considered glazing types lead to a reduction in electricity use, with the double glazing having the superior performance. Table 10 summarizes the annual energy consumption of the building. The double clear glazing saves 2.2% of the NG consumption compared to the single clear, while the double grey can conserve 5.9% of the electricity use. It should also be noted that the double glazing windows have a better performance in terms of both NG and electricity use. The double low-e and double clear glazing can reduce the annual total energy by 0.61 MWh (2.3%) and 0.57 MWh (2.2%) compared to the single clear, respectively.
Figure 11. Monthly natural gas (NG) consumption for different glazing types. 0 500 1000 1500 2000 2500 3000 3500 4000 4500 5000 5500 6000 6500
Jan Feb Mar Apr May Jun Jul Aug Sep Oct Nov Dec
Monthly NG consumption ( kWh) Month
Single clear Single low-e Single grey
Double clear Double low-e Double grey
Figure 11.Monthly natural gas (NG) consumption for different glazing types.
Energies 2020, 13, x FOR PEER REVIEW 14 of 21
Figure 12. Monthly electricity consumption for different glazing types.
Table 10. The annual energy consumption and energy saving for various glazing types.
Consumption Factors Single Clear Single Low-e Single Grey Double Clear Double Low-e Double Grey Annual NG use
(kWh) 20,442 20,684 21,492 20,000 20,058 20,886 NG saving (%) - −1.2 −5.1 2.2 1.9 −2.2 Annual electricity
use (kWh) 5707 5700 5642 5578 5481 5370
Electricity saving (%) - 0.1 1.1 2.3 4.0 5.9 Total site energy
(kWh) 26,149 26,383 27,134 25,577 25,540 26,256 Total energy saving
(%) - −0.9 −3.8 2.2 2.3 −0.4
3.4. Shading
Figures 13 and 14 demonstrate the monthly NG and electricity use of the building with and without shadings. The utilization of overhangs adversely affects the NG use. However, it can efficiently decline the electricity consumption in the cooling period, particularly in the months of July and August. The yearly energy use is presented in Table 11. It is observed that the NG consumption rises annually by 1.7 MWh (8.5%) when the overhangs are utilized, while the cooling load is lowered by 0.7 MWh (12.7%). Overall, the inclusion of overhangs increases the total energy by nearly 1 MWh/year (3.9%). Therefore, using them is not encouraged.
0 200 400 600 800 1000
Jan Feb Mar Apr May Jun Jul Aug Sep Oct Nov Dec
Monthly electricity consumption (kWh) Single clear Single low-e Single grey Double clear Double low-e Double grey
Figure 12.Monthly electricity consumption for different glazing types.
Table 10.The annual energy consumption and energy saving for various glazing types.
Consumption Factors Single
Clear Single Low-e Single Grey Double Clear Double Low-e Double Grey
Annual NG use (kWh) 20,442 20,684 21,492 20,000 20,058 20,886
NG saving (%) - −1.2 −5.1 2.2 1.9 −2.2
Annual electricity use (kWh) 5707 5700 5642 5578 5481 5370
Electricity saving (%) - 0.1 1.1 2.3 4.0 5.9
Total site energy (kWh) 26,149 26,383 27,134 25,577 25,540 26,256
Energies2020,13, 2593 13 of 19
3.4. Shading
Figures13and14demonstrate the monthly NG and electricity use of the building with and without shadings. The utilization of overhangs adversely affects the NG use. However, it can efficiently decline the electricity consumption in the cooling period, particularly in the months of July and August. The yearly energy use is presented in Table11. It is observed that the NG consumption rises annually by 1.7 MWh (8.5%) when the overhangs are utilized, while the cooling load is lowered by 0.7 MWh (12.7%). Overall, the inclusion of overhangs increases the total energy by nearly 1 MWh/year (3.9%).
Therefore, using them is not encouraged.Energies 2020, 13, x FOR PEER REVIEW 15 of 21
Figure 13. Monthly NG consumption with and without shadings.
Figure 14. Monthly electricity consumption with and without shadings.
Table 11. The annual energy consumption and energy saving for the building with and without shading.
Consumption Factors Without Shading With Shading
Annual NG use (kWh) 20,442 22,189
NG saving (%) - −8.5
Annual electricity use (kWh) 5707 4982
Electricity saving (%) - 12.7
Total site energy (kWh) 26,149 27,171
Total energy saving (%) - −3.9
3.5. Insulation Material
The energy performance of the building with five different insulation materials, namely aerated concrete, cellulose, glass wool, rock wool, and polyurethane, was assessed and compared to the
0 1000 2000 3000 4000 5000 6000 7000
Jan Feb Mar Apr May Jun Jul Aug Sep Oct Nov Dec
Monthly
NG
consumption
(kWh)
Month
Without shading With shading
0 200 400 600 800 1000
Jan Feb Mar Apr May Jun Jul Aug Sep Oct Nov Dec
Monthly
electricity
c
onsumpti
on
(
kWh)
Month
Without shading
With shading Figure 13.Monthly NG consumption with and without shadings.
Energies 2020, 13, x FOR PEER REVIEW 15 of 21
Figure 13. Monthly NG consumption with and without shadings.
Figure 14. Monthly electricity consumption with and without shadings.
Table 11. The annual energy consumption and energy saving for the building with and without shading.
Consumption Factors Without Shading With Shading Annual NG use (kWh) 20,442 22,189
NG saving (%) - −8.5
Annual electricity use (kWh) 5707 4982 Electricity saving (%) - 12.7 Total site energy (kWh) 26,149 27,171 Total energy saving (%) - −3.9
3.5. Insulation Material
The energy performance of the building with five different insulation materials, namely aerated concrete, cellulose, glass wool, rock wool, and polyurethane, was assessed and compared to the
0 1000 2000 3000 4000 5000 6000 7000
Jan Feb Mar Apr May Jun Jul Aug Sep Oct Nov Dec
Monthly
NG
consumption
(kWh)
Month
Without shading With shading
0 200 400 600 800 1000
Jan Feb Mar Apr May Jun Jul Aug Sep Oct Nov Dec
Monthly
electricity
c
onsumpti
on
(
kWh)
Month
Without shading
With shading
Table 11.The annual energy consumption and energy saving for the building with and without shading.
Consumption Factors Without Shading With Shading
Annual NG use (kWh) 20,442 22,189
NG saving (%) - −8.5
Annual electricity use (kWh) 5707 4982
Electricity saving (%) - 12.7
Total site energy (kWh) 26,149 27,171
Total energy saving (%) - −3.9
3.5. Insulation Material
The energy performance of the building with five different insulation materials, namely aerated concrete, cellulose, glass wool, rock wool, and polyurethane, was assessed and compared to the building without insulation. The monthly NG and electricity consumption are indicated in Figures15 and16, respectively. It can be seen that the polyurethane can significantly lower the monthly NG use, particularly in January and December, where the consumption was reduced by 1.9 MWh and 1.6 MWh, respectively. Rock wool, glass wool, and cellulose can also efficiently reduce the heating demand. However, aerated concrete shows a relatively weaker performance. As shown in Figure16, the building with no insulation has a minimum cooling demand. Table12presents the annual energy use of the building for the studied insulation materials. The NG consumption can be attenuated by approximately 39% (7.9 MWh) through the use of polyurethane, while the electricity use increases significantly when insulation materials are used. The total energy can be trimmed by 7.3 MWh per annum when polyurethane is used, attaining an annual energy saving of 28%.
Energies 2020, 13, x FOR PEER REVIEW 16 of 21
building without insulation. The monthly NG and electricity consumption are indicated in Figures 15 and 16, respectively. It can be seen that the polyurethane can significantly lower the monthly NG use, particularly in January and December, where the consumption was reduced by 1.9 MWh and 1.6 MWh, respectively. Rock wool, glass wool, and cellulose can also efficiently reduce the heating demand. However, aerated concrete shows a relatively weaker performance. As shown in Figure 16, the building with no insulation has a minimum cooling demand. Table 12 presents the annual energy use of the building for the studied insulation materials. The NG consumption can be attenuated by approximately 39% (7.9 MWh) through the use of polyurethane, while the electricity use increases significantly when insulation materials are used. The total energy can be trimmed by 7.3 MWh per annum when polyurethane is used, attaining an annual energy saving of 28%.
Figure 15. Monthly NG consumption for different insulation materials.
Figure 16. Monthly electricity consumption for different insulation materials.
0 500 1000 1500 2000 2500 3000 3500 4000 4500 5000 5500 6000 6500
Jan Feb Mar Apr May Jun Jul Aug Sep Oct Nov Dec
Monthly
NG
consumption
(kWh)
Month
No insulation Aerated concrete
Cellulose Glass wool
Rock wool Polyurethane
0 300 600 900 1200
Jan Feb Mar Apr May Jun Jul Aug Sep Oct Nov Dec
Monthly
electricity consumption
(kWh)
Month
No insulation Aerated concrete Cellulose
Glass wool Rock wool Polyurethane
Energies2020,13, 2593 15 of 19
Energies 2020, 13, x FOR PEER REVIEW 16 of 21
building without insulation. The monthly NG and electricity consumption are indicated in Figures 15 and 16, respectively. It can be seen that the polyurethane can significantly lower the monthly NG use, particularly in January and December, where the consumption was reduced by 1.9 MWh and 1.6 MWh, respectively. Rock wool, glass wool, and cellulose can also efficiently reduce the heating demand. However, aerated concrete shows a relatively weaker performance. As shown in Figure 16, the building with no insulation has a minimum cooling demand. Table 12 presents the annual energy use of the building for the studied insulation materials. The NG consumption can be attenuated by approximately 39% (7.9 MWh) through the use of polyurethane, while the electricity use increases significantly when insulation materials are used. The total energy can be trimmed by 7.3 MWh per annum when polyurethane is used, attaining an annual energy saving of 28%.
Figure 15. Monthly NG consumption for different insulation materials.
Figure 16. Monthly electricity consumption for different insulation materials.
0 500 1000 1500 2000 2500 3000 3500 4000 4500 5000 5500 6000 6500
Jan Feb Mar Apr May Jun Jul Aug Sep Oct Nov Dec
Monthly
NG
consumption
(kWh)
Month
No insulation Aerated concrete
Cellulose Glass wool
Rock wool Polyurethane
0 300 600 900 1200
Jan Feb Mar Apr May Jun Jul Aug Sep Oct Nov Dec
Monthly
electricity consumption
(kWh)
Month
No insulation Aerated concrete Cellulose
Glass wool Rock wool Polyurethane
Figure 16.Monthly electricity consumption for different insulation materials.
Table 12.The annual energy consumption and energy saving for various insulation materials.
Consumption Factors No
Insulation
Aerated
Concrete Cellulose
Glass Wool
Rock
Wool Polyurethane
Annual NG use (kWh) 20,442 15,149 12,994 12,837 13,254 12,500
NG saving (%) - 25.9 36.4 37.2 35.2 38.9
Annual electricity use (kWh) 5707 5957 6294 6320 6246 6369
Electricity saving (%) - −4.4 −10.3 −10.7 −9.4 −11.6
Total site energy (kWh) 26,149 21,107 19,288 19,157 19,501 18,869
Total energy saving (%) - 19.3 26.2 26.7 25.4 27.8
Overall, it can be seen that the inclusion of insulation materials in the building can significantly reduce the NG consumption and, in turn, the total building energy. However, the building without insulation outperforms in terms of electricity saving. Although the utilization of shading devices can minimize electricity consumption, it increases the NG consumption and the total site energy and is therefore not recommended. A larger area of window can trim the NG use dramatically, while it increases the electricity consumption.
3.6. The Optimal Building without and with PV
Table 13.The annual energy saving, consumption, and generation of the building.
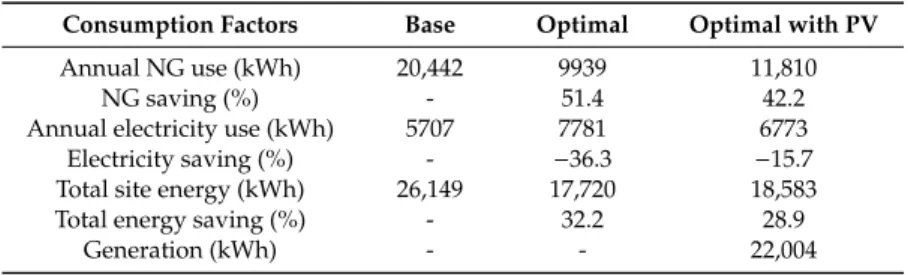
Consumption Factors Base Optimal Optimal with PV
Annual NG use (kWh) 20,442 9939 11,810
NG saving (%) - 51.4 42.2
Annual electricity use (kWh) 5707 7781 6773
Electricity saving (%) - −36.3 −15.7
Total site energy (kWh) 26,149 17,720 18,583
Total energy saving (%) - 32.2 28.9
Generation (kWh) - - 22,004
3.7. Economic Assessment
An economic assessment was conducted to ensure the financial viability of the proposed model. In this regard, the payback period (PB), which shows the number of years needed to recoup the initial costs, is calculated. To calculate the payback period, the cost of the replacement of windows, incorporation of insulation material, and installation of PV modules was initially assessed. Then, the amount of energy saving and the electricity sold to the grid was estimated, and finally the PB was obtained, considering the purchase price of electricity by residents from the grid and the purchase price of electricity sold to the energy sector. It should be noted that inflation and interest rates were taken into account in the assessment. The costs of electricity and NG were considered to be 0.014 $/kWh [45] and 0.105 $/m3[46], respectively. The cost of the insulation material (polyurethane) was assessed at
4.8 $/m2, while the cost of the replacement of the windows was estimated at 3000 $. The cost of the PV
system was 41,000 $. Thus, the initial cost can be expressed as:
Initial cost=3000 $+ 4.8 $
m2×246.5 m 2
!
+41000 $=45183 $.
It should be noted that the electricity generated by the PV was used to partly supply the electricity need of the building, and the remainder was sold to the grid. The purchase price of electricity was 0.095 $/kWh [47]. Therefore, the cost of excess energy injected to the grid can be obtained as follows:
Total electricity need of the building=6773kWh year,
Electricity generation =22004 kWh year,
Electricity sold to the grid=22004 kWh
year − 6773
kWh
year =15231 kWh
year, (13)
Profit gained from selling electricity=15231 kWh
year ×0.095 $
kWh =1447 $. (14)
The inflation and interest rates were 15% and 16%, respectively. Overall, the PB was found to be 21.7 years. It is worthwhile to note that in the near future, the electricity and NG subsidies are expected to be eliminated, which will reduce the PB.
3.8. Environmental Assessment
The amount of carbon dioxide produced throughout the lifetime of the building is provided in Table14. It should be noted that the lifetime of the building is taken to be 50 years [10]. Moreover, the embodied carbon is also demonstrated in Table14. However, the HVAC and lighting systems are not taken into account. It can be seen that the electricity produced by the building with PV modules can save 350,750 kg of CO2. The optimal building can also save 10% of the CO2emissions compared to
Energies2020,13, 2593 17 of 19
Table 14.The embodied carbon and operational carbon emissions.
Emission Factors Base Case Optimal Case Optimal Case with PV
Embodied carbon (kg) 331,481 320,961 333,785
Operational emissions in 50 years (kg) 364,650 328,950 −350,750
4. Conclusions
Buildings are responsible for a large fraction of primary energy consumption. In this regard, many studies have proposed various energy-saving measures. However, the energy performance of buildings located in rural areas that have relatively higher energy consumption due to lack of proper design has not yet been fully investigated. The purpose of this study was to examine the impact of several factors, namely orientation, WWR, glazing type, shading devices, and insulation, on the energy performance of a two-story building located in Palangan village in Iran. The building was then outfitted with PV modules, and finally an economic assessment was conducted to see whether or not the proposed design was economically viable. The following is a brief account of the findings:
• The building rotated 30◦ clockwise could reduce the NG and electricity use by 4.4% and
11.6%, respectively.
• As the WWR increased, the NG consumption declined and the electricity use increased. The optimal
WWR was found to be 40%.
• The double low-e glazing could minimize both NG and electricity consumption by 1.9% and
4%, respectively.
• The application of the overhangs increased the NG use by 8.5% and the total energy by 3.9%.
• Polyurethane was identified as the best insulation material among the studied cases, since it
reduced the total building energy by 27.8%.
• The optimal case could save 32.2% of the total energy compared to the conventional building,
and the PV system could generate over 22 MWh of electricity annually. The payback period for the building with PV was 21.7 years.
For future studies, the impact of energy-saving measures in various climatic conditions can be investigated. Moreover, advanced building materials such as phase change materials can be incorporated in building walls to further improve energy performance.
Author Contributions:Conceptualization, R.K. and M.K.; methodology, R.K., A.M., and F.A.; software, R.K. and M.K.; validation, R.K., M.K., and S.Z.B.; formal analysis, A.M. and A.R.V.-K.; investigation, R.K.; resources, M.K.; data curation, F.A.; writing—original draft preparation, R.K.; writing—review and editing, M.K., F.A., A.M., and S.Z.B.; visualization, R.K., M.K., and S.Z.; validation, A.M. and A.R.V.-K.; checking the results, A.M. and A.R.V.-K.; supervision, A.R.V.-K., and M.K.; project administration, A.M. and S.Z.; funding acquisition, A.M. All authors have read and agreed to the published version of the manuscript.
Funding:This research has been supported by the Project: “Support of research and development activities of the J. Selye University in the field of Digital Slovakia and creative industry” of the Research & Innovation Operational Programme (ITMS code: NFP313010T504) co-funded by the European Regional Development Fund.
Acknowledgments:We acknowledge the financial support of this work by the Hungarian State and the European Union under the EFOP-3.6.1-16-2016-00010 project and the 2017-1.3.1-VKE-2017-00025 project.
Conflicts of Interest:The authors declare no conflict of interest.
References
1. Pop, O.G.; Fechete Tutunaru, L.; Bode, F.; Abrudan, A.C.; Balan, M.C. Energy efficiency of PCM integrated in fresh air cooling systems in different climatic conditions. Appl. Energy2018,212, 976–996. [CrossRef] 2. D’Alessandro, A.; Pisello, A.L.; Fabiani, C.; Ubertini, F.; Cabeza, L.F.; Cotana, F. Multifunctional smart
3. Invidiata, A.; Lavagna, M.; Ghisi, E. Selecting design strategies using multi-criteria decision making to improve the sustainability of buildings.Build. Environ.2018,139, 58–68. [CrossRef]
4. Bingham, R.D.; Agelin-Chaab, M.; Rosen, M.A. Whole building optimization of a residential home with PV and battery storage in The Bahamas.Renew. Energy2019,132, 1088–1103. [CrossRef]
5. Verbeke, S.; Audenaert, A. Thermal inertia in buildings: A review of impacts across climate and building use. Renew. Sustain. Energy Rev.2018,82, 2300–2318. [CrossRef]
6. Markarian, E.; Fazelpour, F. Multi-objective optimization of energy performance of a building considering different configurations and types of PCM.Sol. Energy2019,191, 481–496. [CrossRef]
7. Marin, P.; Saffari, M.; de Gracia, A.; Zhu, X.; Farid, M.M.; Cabeza, L.F. Energy savings due to the use of PCM for relocatable lightweight buildings passive heating and cooling in different weather conditions. Energy Build.2016,129, 274–283. [CrossRef]
8. Faroughi, M.; Karimimoshaver, M.; Aram, F. Computational modeling of land surface temperature using remote sensing data to investigate the spatial arrangement of buildings and energy consumption relationship. Eng. Appl. Comput. Fluid Mech.2020,14, 254–270. [CrossRef]
9. Aram, F.; Solgi, E.; Higueras García, E.; Mosavi, A.R.; Várkonyi-Kóczy, A. The cooling effect of large-scale urban parks on surrounding area thermal comfort.Energies2019,12, 3904. [CrossRef]
10. Aelenei, D.; Lopes, R.A.; Aelenei, L.; Gonçalves, H. Investigating the potential for energy flexibility in an office building with a vertical BIPV and a PV roof system.Renew. Energy2019,137, 189–197. [CrossRef] 11. Liu, C.; Xu, W.; Li, A.; Sun, D.; Huo, H. Energy balance evaluation and optimization of photovoltaic systems
for zero energy residential buildings in different climate zones of China.J. Clean. Prod.2019,235, 1202–1215. [CrossRef]
12. Aelenei, L.; Gonçalves, H. From solar building design to net zero energy buildings: Performance insights of an office building.Energy Proced.2014,48, 1236–1243. [CrossRef]
13. Solgi, E.; Hamedani, Z.; Sherafat, S.; Fernando, R.; Aram, F. The viability of energy auditing in countries with low energy cost: A case study of a residential building in cold climates.Designs2019,3, 42. [CrossRef] 14. Bano, F.; Sehgal, V. Evaluation of energy-efficient design strategies: Comparison of the thermal performance
of energy-efficient office buildings in composite climate, India.Sol. Energy2018,176, 506–519. [CrossRef] 15. Leung, C.K.; Lu, L.; Liu, Y.; Cheng, H.S.; Tse, J.H. Optical and thermal performance analysis of aerogel glazing
technology in a commercial building of Hong Kong.Energy Built Environ.2020,1, 215–223. [CrossRef] 16. Huang, H.; Zhou, Y.; Huang, R.; Wu, H.; Sun, Y.; Huang, G. Optimum insulation thicknesses and energy
conservation of building thermal insulation materials in Chinese zone of humid subtropical climate. Sustain. Cities Soc.2020,52, 101840. [CrossRef]
17. Lee, C.Y.; Kaneko, S.; Sharifi, A. Effects of building types and materials on household electricity consumption in Indonesia.Sustain. Cities Soc.2020,54, 101999. [CrossRef]
18. Potrˇc Obrecht, T.; Premrov, M.; Žegarac Leskovar, V. Influence of the orientation on the optimal glazing size for passive houses in different European climates (for non-cardinal directions). Sol. Energy2019,189, 15–25. [CrossRef]
19. Alghoul, S.K.; Rijabo, H.G.; Mashena, M.E. Energy consumption in buildings: A correlation for the influence of window to wall ratio and window orientation in Tripoli, Libya.J. Build. Eng.2017,11, 82–86. [CrossRef] 20. Goia, F. Search for the optimal window-to-wall ratio in office buildings in different European climates and
the implications on total energy saving potential.Sol. Energy2016,132, 467–492. [CrossRef]
21. Fang, Y.; Cho, S. Design optimization of building geometry and fenestration for daylighting and energy performance.Sol. Energy2019,191, 7–18. [CrossRef]
22. Ali, H.; Hashlamun, R. Envelope retrofitting strategies for public school buildings in Jordan.J. Build. Eng. 2019,25, 100819. [CrossRef]
23. Albayyaa, H.; Hagare, D.; Saha, S. Energy conservation in residential buildings by incorporating passive solar and energy efficiency design strategies and higher thermal mass.Energy Build.2019,182, 205–213. [CrossRef] 24. Lan, L.; Wood, K.L.; Yuen, C. A holistic design approach for residential net-zero energy buildings: A case
study in Singapore.Sustain. Cities Soc.2019,50, 101672. [CrossRef]
25. Tahsildoost, M.; Zomorodian, Z. Energy, carbon, and cost analysis of rural housing retrofit in different climates.J. Build. Eng.2020,30, 101277. [CrossRef]
Energies2020,13, 2593 19 of 19
27. Wang, P.; Gong, G.; Zhou, Y.; Qin, B. A simplified calculation method for building envelope cooling loads in central south China.MDPI Energies2018,11, 1708. [CrossRef]
28. Interreg Central Europe (RURES). Available online:https://www.interreg-central.eu/Content.Node/RURES. html(accessed on 20 April 2020).
29. ENERGIE AGENTUR Sterermark. Projects and Publications. Available online: https://www.ea-stmk.at/ sustainco-eng(accessed on 20 April 2020).
30. Chi, F.; Zhang, J.; Li, G.; Zhu, Z.; Bart, D. An investigation of the impact of Building Azimuth on energy consumption in sizhai traditional dwellings.Energy2019,180, 594–614. [CrossRef]
31. Lu, S.; Tang, X.; Ji, L.; Tu, D. Research on energy-saving optimization for the performance parameters of rural-building shape and envelope by TRNSYS-GenOpt in hot summer and cold winter zone of China. Sustainability2017,9, 294. [CrossRef]
32. Zhang, A.; Bokel, R.; Van den Dobbelsteen, A.; Sun, Y.; Huang, Q.; Zhang, Q. The effect of geometry parameters on energy and thermal performance of school buildings in cold climates of china.Sustainability 2017,9, 1708. [CrossRef]
33. Xue, P.; Li, Q.; Xie, J.; Zhao, M.; Liu, J. Optimization of window-to-wall ratio with sunshades in China low latitude region considering daylighting and energy saving requirements. Appl. Energy2019,233, 62–70. [CrossRef]
34. Sun, H.; Leng, M. Analysis on building energy performance of Tibetan traditional dwelling in cold rural area of Gannan.Energy Build.2015,96, 251–260. [CrossRef]
35. Mohammadi, A.; Saghafi, M.R.; Tahbaz, M.; Nasrollahi, F. The study of climate-responsive solutions in traditional dwellings of Bushehr City in Southern Iran.J. Build. Eng.2018,16, 169–183. [CrossRef]
36. Saffari, M.; de Gracia, A.; Ushak, S.; Cabeza, L.F. Passive cooling of buildings with phase change materials using whole-building energy simulation tools: A review.Renew. Sustain. Energy Rev.2017,80, 1239–1255. [CrossRef]
37. Design Builder. 2020. Available online:https://designbuilder.co.uk/(accessed on 6 March 2020).
38. Boafo, F.E.; Ahn, J.-G.; Kim, S.-M.; Kim, J.-H.; Kim, J.-T. Fenestration refurbishment of an educational building: Experimental and numerical evaluation of daylight, thermal and building energy performance.J. Build. Eng. 2019,25, 100803. [CrossRef]
39. Blanco, J.M.; Buruaga, A.; Rojí, E.; Cuadrado, J.; Pelaz, B. Energy assessment and optimization of perforated metal sheet double skin façades through Design Builder; A case study in Spain. Energy Build. 2016,111, 326–336. [CrossRef]
40. Zhuang, C.L.; Deng, A.Z.; Chen, Y.; Li, S.B.; Zhang, H.Y.; Fan, G.Z.Validation of Veracity on Simulating the Indoor Temperature in PCM Light Weight Building by EnergyPlus; Springer: Berlin/Heidelberg, Germany, 2010; pp. 486–496.
41. Anđelkovi´c, A.S.; Mujan, I.; Daki´c, S. Experimental validation of a EnergyPlus model: Application of a multi-storey naturally ventilated double skin façade.Energy Build.2016,118, 27–36. [CrossRef]
42. Alam, M.; Jamil, H.; Sanjayan, J.; Wilson, J. Energy saving potential of phase change materials in major Australian cities.Energy Build.2014,78, 192–201. [CrossRef]
43. Garsia, J.F.; Kranzi, L. Ambition levels of nearly zero enrgy buildings (nZEB) definitions: An approach for cross-country comparison.MDPI Build.2018,8, 143.
44. Shehadi, M. Energy consumption optimization measures for building in the midwest regions of USA. Buildings2018,8, 170. [CrossRef]
45. Ministry of Energy. 2020. Available online:http://moe.gov.ir/(accessed on 6 March 2020).
46. National Iranian Gas Company. 2020. Available online:http://www.nigc.ir/(accessed on 6 March 2020). 47. Renew. Energy and Energy Efficiency Organization. 2020. Available online: http://www.satba.gov.ir/
(accessed on 6 March 2020).
48. Farivar, F.; Nima, S.; Sina, S.; Marc, A.R. Assessment of wind energy potential and economics in the north-western Iranian cities of Tabriz and Ardabil.Renew. Sustain. Energy Rev.2015,45, 87–99.

![Figure 5. Single zone building model by adapted from Alam et al. [42].](https://thumb-us.123doks.com/thumbv2/123dok_es/6818262.834872/9.892.151.742.142.429/figure-single-zone-building-model-adapted-from-alam.webp)