TítuloExpression of Wnt gene family and frizzled receptors in head and neck squamous cell carcinomas
11
0
0
Texto completo
(2) Wnt genes encode a large family of secreted glycoproteins expressed in species ranging from Drosophila to human. The Wnt family constitutes 19 members in the human genome. The Wnt glycoproteins are ligands for the Fz receptors, which exert their effects through activation of distinct intracellular signaling pathways. The intracellular Wnt signaling have been recognized in four distinct branches: the canonical β-catenin pathway, which activates the target genes in the nucleus; the planar cell polarity pathway, which involves JNK (Jun N-terminal kinase) and cytoskeletal rearrangements; the Wnt/Ca2+ pathway, which involves activation of PLC (phospholipase C) and PKC (protein kinase); and a pathway that regulates spindle orientation and asymmetric cell division [6–10]. Aberrant activation of the Wnt signaling pathway has been reported during neoplastic progression, and became evident in cancer with the discovery that a number of Wnt genes have now been associated with the development of various human cancers [11–17]. To date, different roles for Wnt have been recognized in squamous cell carcinomas of the oral cavity [18, 19]. Also, it is known that Wnt and Fz proteins are expressed in HNSCC cell lines, suggesting that they play a role in cell growth and survival. However, no examination has been made on Wnt and Fz expression in human oral carcinomas specimens by qPCR. In the present study, we have studied expression levels of Wnt and Fz family members. The hypothesis that prompted this study was that human HNSCC might show different Wnt and Fz expression patterns than to those shown in tumor cell lines. We examined frozen human samples of HNSCC for the expression of five Wnt and two Fz genes.. Materials and methods Processing of clinical tissue specimens Fresh primary tumor samples of head and neck squamous cell carcinomas (HNSCC) from 22 patients, who underwent surgical removal of their tumors, were obtained from the Maxillofacial Surgery Service, A Coruña University Hospital. Among the total specimens, 22 samples comprised central tumor tissue and 16 comprised peritumoral tissue; both tissues were obtained from the same HNSCC patient (Table 1). As control, a pool of healthy human oral mucosa (n = 19) was used. The study was approved by the Institutional Review Board of the Ethic Committee of Clinical Investigation of Galicia (Spain). All tumor samples were confirmed by histopathological analysis. Tissue samples were dissected under stringent sterile conditions to prevent RNA contamination and immediately were frozen in liquid nitrogen and stored at −80°C until RNA extraction. RNA extraction Isolation of total RNA from frozen healthy and malignant specimens was performed, following manufacturer’s protocols, using Tripure Isolation Reagent (Roche, Mannheim, Germany). For the isolation of each tissue sample, 50 to 100 mg was processed. Total RNA were treated with DNase I. RNA integrity was confirmed by 2% agarose gel electrophoresis stained with ethidium bromide. RNA was also assessed for quantity at 260 nm using a GENIOUS UV spectrophotometer. A260/A280 relation was calculated for quality, quantity, and purity..
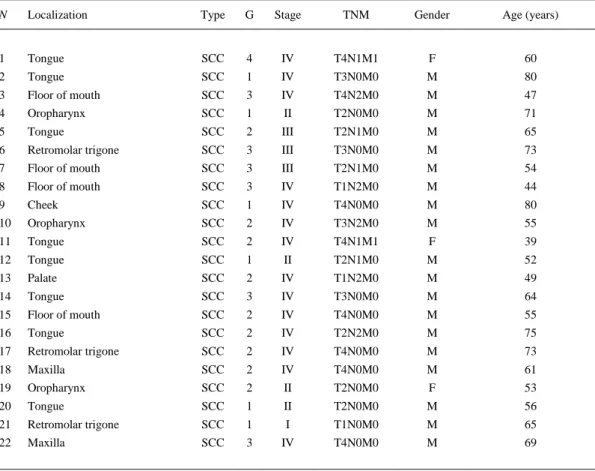
(3) Table 1. Clinicopathologic data from tumors analyzed N. Localization. Type. G. Stage. TNM. Gender. Age (years). 1. Tongue. SCC. 4. IV. 2. Tongue. SCC. 1. IV. T4N1M1. F. 60. T3N0M0. M. 3. Floor of mouth. SCC. 3. 80. IV. T4N2M0. M. 4. Oropharynx. SCC. 47. 1. II. T2N0M0. M. 5. Tongue. 71. SCC. 2. III. T2N1M0. M. 6. 65. Retromolar trigone. SCC. 3. III. T3N0M0. M. 73. 7. Floor of mouth. SCC. 3. III. T2N1M0. M. 54. 8. Floor of mouth. SCC. 3. IV. T1N2M0. M. 44. 9. Cheek. SCC. 1. IV. T4N0M0. M. 80. 10. Oropharynx. SCC. 2. IV. T3N2M0. M. 55. 11. Tongue. SCC. 2. IV. T4N1M1. F. 39. 12. Tongue. SCC. 1. II. T2N1M0. M. 52. 13. Palate. SCC. 2. IV. T1N2M0. M. 49. 14. Tongue. SCC. 3. IV. T3N0M0. M. 64. 15. Floor of mouth. SCC. 2. IV. T4N0M0. M. 55. 16. Tongue. SCC. 2. IV. T2N2M0. M. 75. 17. Retromolar trigone. SCC. 2. IV. T4N0M0. M. 73. 18. Maxilla. SCC. 2. IV. T4N0M0. M. 61. 19. Oropharynx. SCC. 2. II. T2N0M0. F. 53. 20. Tongue. SCC. 1. II. T2N0M0. M. 56. 21. Retromolar trigone. SCC. 1. I. T1N0M0. M. 65. 22. Maxilla. SCC. 3. IV. T4N0M0. M. 69. Characteristics of the head and neck tumors analyzed SCC squamous cell carcinoma, TNM TNM status, F female, M male. cDNA synthesis Reverse-transcription PCR (RT-PCR) was performed using Super-Script™ First-Strand Synthesis System for RT-PCR (Invitrogen, Spain) up to a total volume of 20 µl. One microgram of total RNA, 2.5 nM random hexamers, 0.5 mM dNTP mix, and 3 µl of DEPC-treated water were denatured at 65°C for 5 min and chilled on ice for at least 1 min. On the other hand, 2 µl of 10× RT buffer, 5 mM MgCl2, 0.01 M DTT, and 40 U of RNase-OUT™ Recombinant Ribonuclease Inhibitor were mixed, collected by centrifugation, and incubated at 25°C for 2 min. After incubation, 50 U of Super-Script™ II RT was added and incubated at 25°C for 10 min, 42°C for 50 min, and 70°C for 15 min in a Thermocycler (Gene AMP PCR System 9700, Applied Biosystems, Spain). Finally, samples were chilled on ice and incubated with 2 U of RNAse H for 20 min at 37°C before proceeding to the amplification of the target cDNA. Positive and negative controls were included in each experiment. RNA extraction, reverse-transcription PCR assay setup, and post reverse-transcription PCR product analysis were carried out in separate designated rooms to prevent cross-contamination. cDNA was quantified and assessed for purity using a Genious UV spectrophotometer. cDNA concentration was measured at 260 nm. Also, A260/A280 relation was calculated in order to know cDNA quality, quantity, and purity..
(4) Quantitative real-time PCR (qPCR) Quantitative real-time PCR analysis was performed, using LightCycler® 480 SYBR Green I Master Kit (Roche), on a LightCycler® 480 Real Time PCR System (Roche). PCR reaction consisted of 10 µl of Master Mix 2× conc., 0.35 μM of each forward and reverse primer, template cDNA, and PCR-grade water up to a final volume of 20 µl in the LightCycler 480 Multiwell Plate 96. Multiwell plate was centrifuged at 3,000 rpm for 2 min and was loaded in the LightCycler 480 Instrument until the PCR program started. An initial activation at 95°C for 5 min followed by an amplification target sequence 50 cycles of 95°C for 10 s, 59–60°C (depending on the primers pair used) for 10 s, and 72°C 9–20 s (depending on the amplicon size amplified) was used. For melting curve analysis, one cycle of 95°C for 5 s, 70°C for 15 s, and 95°C for 1 s was used. Finally, a cooling step was used at 40°C for 10 s. PCR primers for the amplification of the different Wnt and Fz genes were carefully designated using the web-based ProbeFinder software (Universal ProbeLibrary Design Center) accessible at [43] or via Roche Applied Science home page [44]. PCR primers were positioned to span exon–intron boundaries in order to reduce the risk of detecting genomic DNA. Primers were purchased from Roche Mannheim (Germany). The following list summarizes the primer pairs used: Wnt-1: 5′ TCT TCG GCA AGA TCG TCA A 3′ (forward); 5′ ACA CGT GCA GGA TTC GAT G 3′ (reverse). Wnt-5A: 5′ TGG TGC CTG ATA TCT CAA AGT C 3′ (forward); 5′ GAG AAA TAA CCC CAG AGT AAA CTG TAA 3′ (reverse). Wnt-7A: 5′ GGG AAG GAG CTC AAA GTG G 3′ (forward); 5′ CTG GCC TTG CYY CYC TTT GT 3′ (reverse). Wnt-10B: 5′ AAT GCG AAT CCA CAA CAA CA 3′ (forward); 5′ TCC AGC ATG TCT TGA ACT GG 3′ (reverse). Wnt-13: 5′ AAG ATG GTG CCA ACT TCA CCG 3′ (forward); 5′ CTG CCT TCT TGG GGG CTT TGC 3′ (reverse). Fz-2: 5′ CAT CGA GGC CAA CTC TCA GT 3′ (forward); 5′ AGG CCT ACG AAG CAC ACG 3′ (reverse). Fz-5: 5′ TAC CCA GCC TGT CGC TAA AC 3′ (forward); 5′ GGA TTC CAG GGA AAG GAC TCT 3′ (reverse). HPRT: 5′ TGA CCT TGA TTT ATT TTG CAT ACC (forward); 5′ CGA GCA AGA CGT TCA GTC CT 3′ (reverse). Suitable selection of housekeeping gene was performed using Human Endogenous Control Gene Panel (TATAA Biocenter, Sweden). The Excel macro named GeNorm VBA applet for Microsoft Excel was used to determine the gene with the most correlated expression in the set of samples. HPRT (hypoxanthine-guanine phosphoribosyltransferase) was used as internal control. Also, housekeeping gene was used to verify integrity of RNA and efficacy of reverse transcription. Any specimen with inadequate housekeeping mRNA level was excluded from the study. We verified that amplifications and the expected size of each qPCR product were specific. Agarose gel electrophoresis (1.8%) of all PCR products revealed a single band that corresponded to the single-amplified products as predicted by the melting curve analysis of the PCR. The amplification efficiency was determined for both target and housekeeping genes and was equal (99–100%). Data analysis was performed with LightCycler® 480 Relative Quantification software (Roche). Relative expression levels (R.E.L) were calculated by the 2 −ΔΔCt method [20]. Each assay was done at least in triplicate and it included marker-positive and marker-negative controls and reagent with no template controls. DNA sequencing Al least one qPCR product coming from each quantitative real-time PCR experiment was used as template DNA in order to verify the specificity of the amplified amplicon. Products were purified by enzymatic method (ExoSAP-IT, Amersham USB). DNA sequencing was performed on an ABI 3700 system (Applied Biosystems) using Big Dye terminators. Forward and reverse primers used in sequencing reactions were the same as for the real-time PCR..
(5) Statistical analysis Statistical analysis of the results was performed with SPSS program (version 12.0 for Windows). The relationship between Wnt and Fz expression values and clinicopathological data was studied by non-parametric statistic, Kruskal–Wallis, and Mann–Whitney U tests. The relationship among the different markers tested with patient’s survival was performed by Cox regression and Kaplan–Meier curves analyses. Statistical significance of differences was evaluated at the 95% confidence level; p values <0.05 were considered to be significant. Other procedures Standard procedures for manipulation of nucleic acids were essentially those previously reported [21].. Results Expression of Wnt genes in head and neck squamous cell carcinoma and healthy human oral mucosa of head and neck To assay Wnt gene expression as potential tumor-associated markers in HNSCC, we analyzed various tumors by qPCR. With the exception of Wnt-1, all the genes tested showed expression in peritumoral and central tumor tissues of oral mucosa. Of the Wnt genes, Wnt-1 was not expressed in the majority of the HNSCC studied; only three cases showed expression. Wnt-5A was the most strongly expressed by the central zones of the malignant tumors, followed by Wnt-13, Wnt-10B, and Wnt-7A. Regarding peritumoral tissues, Wnt-5A was also the most strongly expressed, followed by Wnt-10B, Wnt-13, and Wnt-7A. Wnt-5A, Wnt-7A, and Wnt-13 showed higher mRNA expression levels in central tumor tissues than in the peritumoral zones (Fig. 1a). When we compared Wnt mRNA expression levels in human central tumor tissues against healthy human oral mucosa, we observed that the higher levels were obtained in central tumor zones (Fig. 1b). When we compared Wnt mRNA expression levels in human peritumoral tissues against healthy human oral mucosa, we observed that the higher levels were obtained in peritumoral zones (Fig. 1c)..
(6) Fig. 1. Wnt and Fz mRNA expression levels in different human HNSCC, peritumoral zone (PZ Cancer, n = 16) versus central tumor zone of the tumor (CZ Cancer, n = 22) (a). Wnt and Fz mRNA expression levels in a pool of healthy human oral mucosa (n = 19) versus central tumor tissue (CZ Cancer, n = 22) (b). Wnt and Fz mRNA expression levels in a pool of healthy human oral mucosa (n = 19) versus peritumoral tissue (PZ Cancer, n = 16) (c). Y axis represents Wnt and Fz mRNA relative expression levels (R.E.L.) and X axis represents the different human Wnt and Fz genes tested. mRNA levels were measured by quantitative real-time PCR as described in Materials and methods. Quantitative real-time PCR results are the mean of at least three independent measurements. Data were normalized versus the values obtained in healthy human oral mucosa which were considered equal to 1. Expression of Fz genes in head and neck squamous cell carcinoma and healthy human oral mucosa of head and neck To assay Fz gene expression as potential tumor-associated markers in HNSCC, we analyzed various tumors by qPCR. Both genes tested showed expression in peritumoral and central tumor tissues of oral mucosa. Of the Fz genes, Fz-2 was the most strongly expressed by the central tumor zones of the malignant tumors, followed by Fz-5. Regarding peritumoral tissues, Fz-2 was the most strongly expressed, followed by Fz-5 (Fig. 1a). When we compared Fz mRNA expression levels in human central tumor tissues against healthy human oral mucosa, we observed that the higher levels were obtained in central tumor zones (Fig. 1b). When we compared Fz mRNA expression levels in human peritumoral tissues against healthy human oral mucosa, we observed that the higher levels were obtained in peritumoral zones (Fig. 1c)..
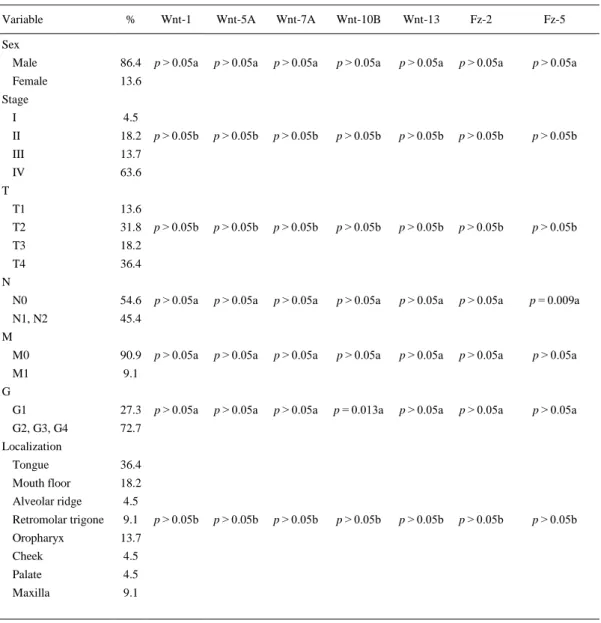
(7) Correlation of Wnt and Fz gene expression with clinicopathological parameters and patient’s survival mRNA expression levels of the different Wnt genes tested in central tumor zones were correlated, by means of non-parametric statistics, with different clinicopathological parameters that included TNM status, stage, tumor localization, degree of differentiation, sex, and age (Table 2). Among all Wnt genes, WNT10B expression levels were correlated with higher grade of undifferentiation (Mann–Whitney U test, p = 0.013). Related to Fz genes, Fz-5 showed higher expression in no-affectation of regional lymph nodes (Mann–Whitney U test, p = 0.009). Fz-5 was not correlated with TNM status (Kruskal–Wallis test, p > 0.05), although it could seem to exist a direct relation between them. More tumor specimens of HNSCC should be screened to validate these findings.. Table 2. Correlation among different expression levels and clinicopathologic data Variable. %. Wnt-1. Wnt-5A. Wnt-7A. Wnt-10B. Wnt-13. Fz-2. Fz-5. Male. 86.4. p > 0.05a. p > 0.05a. p > 0.05a. p > 0.05a. p > 0.05a. p > 0.05a. p > 0.05a. Female. 13.6. p > 0.05b. p > 0.05b. p > 0.05b. p > 0.05b. p > 0.05b. p > 0.05b. p > 0.05b. p > 0.05b. p > 0.05b. p > 0.05b. p > 0.05b. p > 0.05b. p > 0.05b. p > 0.05b. p > 0.05a. p > 0.05a. p > 0.05a. p > 0.05a. p > 0.05a. p > 0.05a. p = 0.009a. p > 0.05a. p > 0.05a. p > 0.05a. p > 0.05a. p > 0.05a. p > 0.05a. p > 0.05a. p > 0.05a. p > 0.05a. p > 0.05a. p = 0.013a. p > 0.05a. p > 0.05a. p > 0.05a. p > 0.05b. p > 0.05b. p > 0.05b. p > 0.05b. p > 0.05b. p > 0.05b. p > 0.05b. Sex. Stage I. 4.5. II. 18.2. III. 13.7. IV. 63.6. T1. 13.6. T2. 31.8. T3. 18.2. T4. 36.4. N0. 54.6. N1, N2. 45.4. T. N. M M0. 90.9. M1. 9.1. G1. 27.3. G2, G3, G4. 72.7. G. Localization Tongue. 36.4. Mouth floor. 18.2. Alveolar ridge. 4.5. Retromolar trigone. 9.1. Oropharyx. 13.7. Cheek. 4.5. Palate. 4.5. Maxilla. 9.1. Correlation between Wnt and Fz expression status and various clinicopathologic variables a Mann–Whitney U test, b Kruskal–Wallis test.
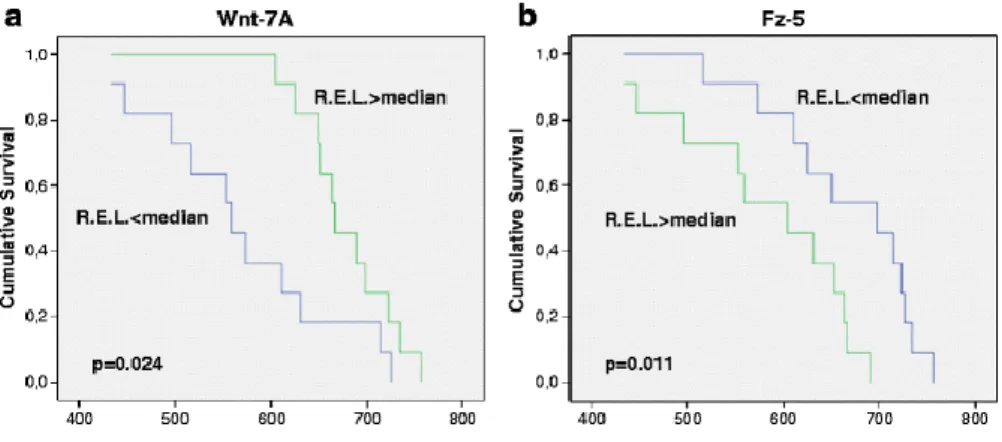
(8) In order to know if there is any relationship among the different markers tested and patient’s survival, we performed Cox regression and Kaplan–Meier curves analyses. Cox regression analyses showed that there is no statistically significant relationship among the different markers studied with patient’s survival. However, when we performed Kaplan–Meier curves analyses, using the median of the R.E.L for each marker tested as cut-off value, we could appreciate that for Wnt-7A and Fz-5 we obtained values with statistical significance. Regarding Wnt-7A marker, we suggest that patients with R.E.L above the median (median = 1.056) have higher survival than those with R.E.L. below the median (p = 0.024). Also, for Fz-5 marker, we suggest that patients with R.E.L. above the median (median = 5.859) have lower survival than those with R.E.L. below the median (p = 0.011). In this way, Kaplan–Meier survival analyses suggest a reduced time of survival for low R.E.L. of Wnt-7A mRNA and for high R.E.L. of Fz-5 mRNA (Fig. 2).. Fig. 2. Kaplan–Meier graphs for time of survival according to R.E.L. of Wnt-7A (a) and Fz-5 (b) mRNA in central tumor tissue of HNSCC; p values are given for log rank tests. Discussion To evaluate Wnt and Fz gene expression as potential tumor-associated markers in HNSCC, we screened various tumors by qPCR. The results revealed that Wnt-5A was the most strongly expressed by the central tumor tissues, but Wnt-1 was not expressed in the majority of the HNSCC studied (only three cases expressed Wnt-1). On the contrary, Rhee et al. [14] observed that Wnt-1 was one of the most expressed in HNSCC cell lines besides Wnt-10B and Wnt-5A. Also, they observed no differences in Fz-5 expression in HNSCC cell lines against normal human bronchoepithelial and oral squamous epithelial cell lines, whereas in HNSCC tissues we obtained an increased expression of Fz-5 with regard to healthy human oral mucosa. Among all Wnt genes, expression levels of Wnt-10B in central tumor zone were related with higher grade of undifferentiation. The present study demonstrates that HNSCC express Wnt and Fz members and that all Wnt and Fz genes tested were overexpressed not only in peritumoral zone but also in central tumor tissues of human HNSCC specimens. Aberrant activation of the Wnt and Fz signaling pathway has been reported in HNSCC lines [14]. These investigators found that Wnt-1, Wnt-10B, Wnt-13, and Fz-2 were overexpressed in ten HNSCC lines in comparison to normal human bronchial epithelium, suggesting that the growth and survival of a subset of this tumor may depend on the Wnt/Fz pathway. Other studies focusing on the involvement of Wnt family expression in oral squamous cell carcinomas (OSCC) tissue samples and cell lines showed that carcinoma cells express many Wnt family members [18, 19]. Our finding of a weak expression of Wnt-1 and a high Wnt-10B expression not only in central tumor zone but also in peritumoral tissue is compatible with the idea that Wnt-1 and Wnt-10B have a redundant function [22]. If this is true, it may be speculated that, in differentiated HNSCC, Wnt-1 plays a role in the control of differentiation, proliferation, and invasiveness of cells. This.
(9) cellular defense mechanism may subsequently be lost in undifferentiated steps and while the Wnt1 expression is silenced the expression of Wnt-10B is emerging in undifferentiated carcinomas. Wnt-1 is part of a Wnt cluster conserved in all vertebrates comprising Wnt-1 and Wnt-10B. The function of Wnt-10B during oncogenesis has not been explored yet. In zebrafish, Wnt-10B is expressed in a pattern overlapping extensively with that of Wnt-1; Wnt-1 and Wnt-10B provide partially redundant functions [22]. Interestingly, in human genome, Wnt-1 maps to linkage group (LG) 23 in close proximity to another Wnt paralog, Wnt-10B [23, 24]. The linkage of Wnt-1 and Wnt-10B paralogs has been conserved in the vertebrate linkage, and this relationship may reflect the existence of three ancient Wnt paralogs present before the divergence of protostomes and deuterostomes, Wnt-1, Wnt-6, and Wnt-10 [25]. The conservation of the spatial arrangement of Wnt-1 and Wnt-10B raises the possibility that their expression may be regulated in a coordinated and sequential fashion [26, 27]. In support of this assertion, a fragment of Wnt-10B gene showed an expression pattern that may be similar to that shown by Wnt-1 [28]. Our study demonstrates an increased expression of Wnt-10B mRNA in HNSCC, whereas Wnt1 expression was low or undetectable. This pattern does not fit to observations in oral squamous cell carcinoma lines where Wnt-1 mRNA was overexpressed [14]. This Wnt-1 strong expression in carcinoma cell lines but a complete loss in human head and neck squamous cell carcinomas could indicate a post-translational deregulation. Discrepancy between transcriptional and translational control fits to observations in other tumor types as aggressive invasive breast ductal cancers where, in the undifferentiated state, a selective loss of protein expression was found in parallel to an aggressive state of the tumor [29]. Although many Wnt genes have been evaluated in HNSCC, the role of Wnt-5A remains poorly understood. In the study of Rhee et al. [14] and in the study of Uraguchi et al. [18], Wnt-5A was expressed in 4/10 and 5/14 carcinoma HNSCC cells lines, respectively. In contrast, we found a strong expression of WNT-5A not only in peritumoral zone but also in central tumor tissue of HNSCC specimens. The importance of Wnt-5A signaling and their function in HNSCC are currently incompletely understood. It is known that in other human tumorsWnt-5A serves as an antagonist to the canonical Wnt signaling pathway with tumor suppressor activity in differentiated carcinomas. Also, Wnt-5A expression is compatible with the idea that Wnt-5A has a tumor activity; Wnt-5A plays a role in the control of tumor differentiation, proliferation, and invasiveness of cells [30–33]. While some Wnt genes, expressed in normal tissues during embryonic or post-natal period, induce cell morphological changes and cellular differentiation, the same Wnt genes can be expressed in both normal adult and tumoral tissues. These disappointing behaviors suggest that members of the Wnt family implicated in normal physiologic tissue development or repair are not expressed when the tissue has ceased proliferating and exhibit overexpression in hyperplastic or oncogenic transformation. Wnt proteins have a different function in carcinogenesis, and based on their ability to transform mouse mammary epithelial cells, they can be divided into three different classes: Wnt-1, Wnt-3A, and Wnt-7A have the greatest transforming capacity; Wnt-2, Wnt-5B, and Wnt-7B have an intermediate transforming capacity; and Wnt-4, Wnt-5A, and Wnt-6 are nontransforming [34]. Although detailed mechanisms are not well understood why Wnts are overexpressed in one tumor and downregulated in another, the pleiotropism of Wnt signaling is evident [35]. Previous results confirmed that some components of the Wnt family have aberrant expression that affects the tumor proliferation in non-small cell lung carcinomas (NSCLCs) [36– 38]. The present study demonstrated that HNSCC of the oral cavity express a set of Wnt and Fz genes, and suggests as in other published works that this signaling pathway is activated in carcinoma cells. The implication of both Wnt and Fz signaling pathways in the pathogenesis of human cancer is becoming more clearly understood [39–41]. A recent work demonstrated a relationship among Wnt signaling pathway and expression values of COX-2 and Ku [42]. If more Wnt gene expression in HNSCC are studied in the future, the role of the Wnt pathway during oral squamous cell carcinoma induction and its significance in HNSCC will be well understood..
(10) Development of targeted therapies and novel drugs, perhaps based on Wnt-7A, Wnt-10B, and Fz5, could represent an attractive field for suppression of tumor progression.. Acknowledgements The authors thank Mrs. M. Haz Conde and I. Santamarina Caínzos for technical support and S. Pértega Díaz for statistical assistance. S.M. Díaz Prado is supported by an Isidro Parga Pondal research contract by Xunta de Galicia (A Coruña, Galicia, Spain). Cancer research in our laboratory is supported by “Fundación Juan Canalejo-Marítimo de Oza”. Authors’ disclosures of potential conflicts of interest The authors declare that they have no competing interests. Authors’ contributions Conception and design: S.M. Díaz Prado, L.M. Antón Aparicio. Provision of study materials and patients: J.L. López Cedrún, S. Sironvalle Soliva. Collection and assembly of data: S.M. Díaz Prado, G. Aparicio Gallego, V. Medina Villaamil. Data analysis and interpretation: S.M. Díaz Prado, L.M. Antón Aparicio, M. Blanco Calvo. Manuscript writing: S.M. Díaz Prado, L.M. Antón Aparicio, R. García Campelo, M Valladares Ayerbes. Final approval of manuscript: S.M. Díaz Prado, V. Medina Villaamil, G. Aparicio Gallego, M. Blanco Calvo, J.L. López Cedrún, S. Sironvalle Soliva, M. Valladares Ayerbes, R. García Campelo, L.M. Antón Aparicio.. References 1. Hunter T (1997) Oncoprotein networks. Cell 88:333–346 2. Ramsdell AF, Yost HJ (1998) Molecular mechanisms of vertebrate left-right development. Trends Genet 14:459–465. 3. Parr BA, Shea MJ, Vassileva G et al (1993) Mouse Wnt genes exhibit discrete domains of expression in the early embryonic CNS and limb buds. Development 119:247–261 4. Riddle RD, Ensini M, Nelson C et al (1995) Induction of the LIM homeobox gene Lmx1 by WNT7a establishes dorsoventral pattern in the vertebrate limb. Cell 83:631–640 5. Vogel A, Rodriguez C, Warnken W et al (1995) Dorsal cell fate specified by chick Lmxl during vertebrate limb development. Nature 378:716–720 6. Dale TC (1998) Signal transduction by the Wnt family ligands. Biochem J 329:209–223. 7. Thorpe CJ, Schlesinger A, Bowerman B (2000) Wnt signaling in Caenorhabditis elegans: regulating repressors and polarizing the cytoskeleton. Trends Cell Biol 10:10–17 8. Kuhl M, Sheldahl LC, Park M et al (2000) The Wnt/Ca2+ pathway: a new vertebrate Wnt signaling pathway takes shape. Trends Genet 16:279–283 9. Krasnow RE, Wong LL, Adler PN (1995) Dishevelled is a component of the frizzled signaling pathway in Drosophila. Development 121:4095–4102. 10. Bienz M (2001) Spindles cotton on to junctions, APC and EB1. Nat Cell Biol 3:E67–E68 11. Bui TD, Zhang L, Rees MC et al (1997) Expression and hormone regulation of Wnt2, 3, 4, 5a, 7a, 7b and 10b in normal human endometrium and endometrial carcinoma. Br J Cancer 75:1131–1136 12. Holcombe RF, Marsh JL, Waterman ML et al (2002) Expression of Wnt ligands and Frizzled receptors in colonic mucosa and in colon carcinoma. Mol Pathol 55:220–226. 13. Howng SL, Wu CH, Cheng TS et al (2002) Differential expression of Wnt genes, beta-catenin and Ecadherin in human brain tumors. Cancer Lett 183:95–101. 14. Rhee CS, Sen M, Lu D et al (2002) Wnt and frizzled receptors as potential targets for immunotherapy in head and neck squamous cell carcinomas. Oncogene 21:6598–6605. 15. Ricken A, Lochhead P, Kontogiannea M et al (2002) Wnt signaling in the ovary: identification and compartmentalized expression of wnt-2, wnt-2b, and frizzled-4 mRNAs. Endocrinology 143:2741–2749. 16. Saitoh T, Mine T, Katoh M (2002) Frequent up-regulation of WNT5A mRNA in primary gastric cancer. Int J Mol Med 9:515–519. 17. Pham K, Milovanovic T, Barr RJ et al (2003) Wnt ligand expression in malignant melanoma: pilot study indicating correlation with histopathological features. Mol Pathol 56:280–285..
(11) 18. Uraguchi M, Morikawa M, Shirakava M et al (2004) Activation of Wnt family expression and signaling in squamous cell carcinomas of the oral cavity. J Dent Res 83:327–332. 19. Zhang W-M, Lo Muzio L, Rubini C et al (2005) Effect of Wnt-1 on β-catenin expression and its relation to Ki-67 and tumor differentiation in oral squamous cell carcinoma. Oncol Rep 13:1095–1099. 20. Livak KJ, Schmittgen TD (2001) Analysis of relative gene expression data using real-time quantitative PCR and the 2−ΔΔCt method. Methods 25:402–408. 21. Sambrook J, Maniatis T, Fritsch EF (1989) Molecular cloning: a laboratory manual. Cold Spring Harbor Laboratory Press, New York. 22. Lekven AC, Buckler GR, Kostakis N et al (2003) Wnt1 and Wnt10B function redundantly at the zebrafish midbrain–hindbrain boundary. Dev Biol 254:172–187. 23. Postletwait JH, Yan YL, Gates MA et al (1998) Vertebrate genome evolution and the zebrafish gene map. Nat Genet 18:345–349. 24. Gellner K, Brenner S (1999) Analysis of 148 kb of genomic DNA around the Wnt 1 locus of Fungu rubripes. Genome Res 9:251–258. 25. Nusse R (2001) An ancient cluster of Wnt paralogues. Trends Genet 17:443. 26. Rastegar S, Fridle H, Frommer F et al (1999) Transcriptional regulation of Xvent homeobox genes. Mech Dev 1:139–149. 27. Melby AE, Beach C, Mullius M et al (2002) Patterning the early zebrafish by the opposing actions of bozozok and vox/vent. Development 129:2987–2089. 28. Kraus S, Kork V, Fjose A et al (1992) Expression of four zebrafish Wnt-related genes during embryogenesis. Development 116:249–259. 29. Jonsson M, Dejmek J, Bendahl PO et al (2002) Loss of Wnt-5a protein is associated with early relapse in invasive ductal breast carcinomas. Cancer Res 62:409–416. 30. Olson DJ, Papkoff J (1994) Regulated expression of Wnt family members during proliferation of C57mg mammary cells. Cell Growth Differ 5:197–206. 31. Olson DJ, Gibo DM, Saggers G et al (1997) Reversion of uroepithelial cell tumorigenesis by the ectopic expression of human wnt-5a. Cell Growth Differ 8:417–423. 32. Olson DJ, Oshimura M, Otte AP et al (1998) Ectopic expression of wnt-5a in human renal cell carcinoma cells suppresses in vitro growth and telomerase activity. Tumour Biol 19:244–252. 33. Kremenevskaja N, von Wasielewski R, Rao AS et al (2005) Wnt-5a has tumor suppressor activity in thyroid carcinoma. Oncogene 24:2144–2154. 34. Dejmek J, Leandersson K, Manjer J et al (2005) Expression and signaling activity of Wnt-5a/Discoidin domain receptor-1 and Syk plays distinct but decisive roles in breast cancer patient survival. Clin Cancer Res 11:520–528. 35. Paul S, Dey A (2008) Wnt signaling and cancer development: therapeutic implication. Neoplasma 55:165–176. 36. He B, Jablons DM (2006) Wnt signaling in stem cells and lung cancer. Ernst Schering Found Symp Proc 5:27–58. 37. Tennis M, Van Scoyk M, Winn RA (2007) Role of the Wnt signaling pathway and lung cancer. J Thorac Oncol 2:889–892. 38. Nakashima T, Liu D, Nakano J et al (2008) Oncol Rep 19:203–209. 39. Lo Muzio L (2001) A possible role for the Wnt-1 pathway in oral carcinogenesis. Crit Rev Oral Biol Med 12:152–165. 40. Lo Muzio L, Pannone G, Staibano S et al (2002) WNT-1 expression in basal cell carcinoma of head and neck. An immunohistochemical and confocal study with regard to the intracellular distribution of betacatenin. Anticancer Res 22:565–576. 41. Yeh KT, Chang JG, Lin TH et al (2003) Correlation between protein expression and epigenetic and mutation changes of Wnt pathway-related genes in oral cancer. Int J Oncol 23:1001–1007. 42. Chang HW, Roh JL, Jeong EJ et al (2008) Wnt signaling controls radiosensitivity via cyclooxygenase-2mediated Ku expression in head and neck cancer. Int J Cancer 122:100–107. 43. Roche Applied Science [database on the Internet] [cited December 20, 2005]. Assay Design Center/ProbeFinder. Homo sapiens (Human). Available from http://www.universalprobelibrary.com. 44. Roche Applied Science [database on the Internet] [cited December 20, 2005]. Universal ProbeLibrary. Universal ProbeLibrary interest site. Assay Design Center/ProbeFinder. Homo sapiens (Human). Available from http://www.roche-applied-science.com.
(12)
Figure

Documento similar
Aims: This study carried in patients with metastatic colorectal cancer (mCRC) or head and neck cancer (HNC) aims to evaluate, in a real-life setting, the relationship
Los artículos de Revista Médica Electrónica de la Universidad de Ciencias Médicas de Matanzas se comparten bajo los términos de la Licencia Creative Commons Atribución–
The number of publications analyzing the prognostic value of fluorine-18-fluorodeoxyglucose ( 18 F-FDG) metabolic tumor volume (MTV) and total lesion glycolysis (TLG) in head
In Portugal, the incidence of carcinoma of the head and neck represents 10% of all cases of malignant tumours (1), with oral carcinoma being the most common type of cancer and the
(7) suggested that racial variations may exist in the clinico-pathologic distribution of SGTs with African cases having less proportion of SGTs in parotid gland but more
Shahdadfar A, Fronsdal K, Haug T (2005) In vitro expansion of human mesenchymal stem cells: choice of serum is a determinant of cell proliferation, differentiation, gene expression,
Morphofunctional and Molecular Assessment of Nutritional Status in Head and Neck Cancer Patients Undergoing Systemic Treatment: Role of Inflammasome in Clinical Nutrition..
Vali- dation of the risk model: high-risk classification and tumor pattern of invasion predict outcome for patients with low-stage oral cavity squamous cell carcinoma. Head
