CLASH: THREE STRONGLY LENSED IMAGES OF A CANDIDATE z approximate to 11 GALAXY
23
0
0
Texto completo
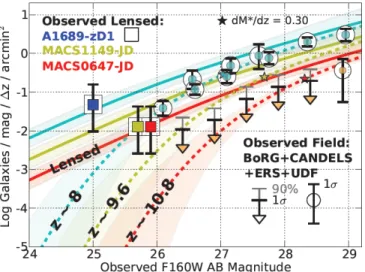
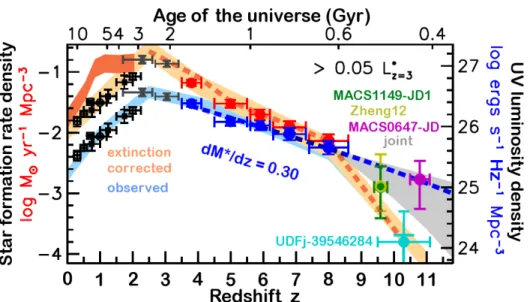
(2) 2. Coe et al. 2012 1. INTRODUCTION. Current models of structure formation suggest that the first galaxies formed at z & 10 when the universe was . 470 million years old (Wise & Abel 2007; Wise et al. 2008; Greif et al. 2008, 2010; and for recent reviews, see Bromm & Yoshida 2011 and Dunlop 2012). Observations may be closing in on these first galaxies with one z ∼ 10 candidate detected in the Ultra Deep Field (UDFj39546284; Bouwens et al. 2011a) and another strongly lensed by a galaxy cluster (MACS1149-JD1; Zheng et al. 2012). Intriguingly, the number density of z ∼ 10 galaxies detected in unlensed fields is several times lower than predicted based on extrapolations from lower redshifts, assuming a luminosity function with one or more parameters evolving linearly with redshift (Bouwens et al. 2008, 2011a; Oesch et al. 2012a). This suggests that the star formation rate density built up more rapidly from z ∼ 10 to 8 than it did later between z ∼ 8 and 2. This is consistent with some theoretical predictions (Trenti et al. 2010; Lacey et al. 2011). However, Robertson & Ellis (2012) suggest such a sharp drop off would be in tension with z < 4 GRB rates as correlated with star formation rate density and extrapolated to higher redshifts. Direct detections and confirmations of z & 10 galaxies are required to more precisely constrain the star formation rate density at that epoch. The observed luminosity functions at z ∼ 7 and 8 feature steep faint end slopes of α ∼ −2 (Bouwens et al. 2011b; Bradley et al. 2012b), steeper than at lower redshifts, a trend consistent with model predictions (Trenti et al. 2010; Jaacks et al. 2012). If these luminosity functions can be extrapolated to z & 10, then low luminosity galaxies (MU V fainter than −16 AB) could have reionized the universe (Bouwens et al. 2012a; Kuhlen & Faucher-Giguère 2012), assuming a sufficient fraction of their UV photons could escape their host galaxies to the surrounding medium (see also Conroy & Kratter 2012). Otherwise, a more exotic source of reionizing energy may have been required, such as self-annihilating dark matter (Iocco 2010; Natarajan 2012). Reionization was likely well underway by z & 10 but with over half the universe still neutral (Robertson et al. 2010; Pandolfi et al. 2011; Mitra et al. 2012). Improving our understanding of the early universe and this phase change is one of the pressing goals of modern cosmology. Observations with the Wide Field Camera 3 (WFC3; Kimble et al. 2008) installed on the Hubble Space Telescope (HST) have significantly advanced our understanding of the z & 7 universe, over 13 billion years in the past. The Ultra Deep Field and surrounding deep fields have yielded over 100 robust z > 7 candidates as faint as 29th magnitude AB (Bunker et al. 2010; Labbé et al. 2010; Bouwens et al. 2011b; Oesch et al. 2012a). Analyses of wider space-based surveys such as CANDELS (Grogin et al. 2011; Koekemoer et al. 2011), BoRG (Trenti et al. 2012), and HIPPIES (Yan et al. 2011) have helped fill out the brighter end of the luminosity function (Oesch et al. 2012b; Bradley et al. 2012b; Yan et al. 2011). Of the handful of z > 7 galaxies spectroscopically confirmed to date, most have been discovered in even wider near-infrared surveys carried out with the ground-based telescopes Subaru (Shibuya et al. 2012; Ono et al. 2012),. VLT (Vanzella et al. 2011), and UKIRT (Mortlock et al. 2011). Surveys with the VISTA telescope are also beginning to yield high redshift candidates (Bowler et al. 2012). Complementary to these searches of “blank” fields are searches behind strongly lensing galaxy clusters (Kneib et al. 2004; Bradley et al. 2008; Bouwens et al. 2009; Bradač et al. 2009; Maizy et al. 2010; Richard et al. 2011; Hall et al. 2012; Bradley et al. 2012a; Zitrin et al. 2012a; Wong et al. 2012; Zackrisson et al. 2012; Bradač et al. 2012; and for a recent review, see Kneib & Natarajan 2011). The drawbacks of lensed searches are reduced search area in the magnified source planes and some uncertainty in the estimate of that search area introduced by the lens modeling. But the rewards are galaxies which are strongly magnified, often by factors of 10 or more. Lensed searches are significantly more efficient in yielding high-redshift candidates bright enough for spectroscopic confirmation, including A1703-zD6 (Bradley et al. 2012a) at z = 7.045 (Schenker et al. 2012). The Cluster Lensing and Supernova survey with Hubble (CLASH; Postman et al. 2012) is a large Hubble program imaging 25 galaxy clusters in 16 filters including five in the near-infrared (0.9–1.7µm). Five of these, including MACSJ0647.7+7015 (z = 0.591, Ebeling et al. 2007), were selected on the basis of their especially strong gravitational lensing power as observed in previous imaging, with the primary goal of discovering highly magnified galaxies at high redshift. To date, some of the more notable strongly lensed galaxies found in CLASH include a doubly-imaged galaxy with a spectroscopic redshift z = 6.027 observed at mag ∼ 24.6 (Richard et al. 2011) which is possibly ∼800 Myr old (although see Pirzkal et al. 2012); a quadruply-imaged z ∼ 6.2 galaxy observed at 24th magnitude (Zitrin et al. 2012a); and the z ∼ 9.6 candidate galaxy MACS1149-JD1 observed at mag ∼ 25.7 (Zheng et al. 2012). The z ∼ 9.6 candidate is strongly lensed by MACSJ1149.6+2223, another CLASH cluster selected for its high magnification strength. Here we report the discovery of MACS0647-JD, a candidate for the earliest galaxy yet detected at a red−30 shift z = 10.7+0.6 −0.4 (95% confidence), just 427+21 million years after the Big Bang. It is strongly lensed by MACSJ0647.7+7015, yielding three multiple images observed at F160W AB mag ∼25.9, 26.1, and 27.3, magnified by factors of ∼8, 7, and 2. The brightest image is similar in flux to MACS1149-JD1 (F160W mag ∼ 25.7) at z = 9.6±0.2 (68% confidence) and roughly 15 times (3 magnitudes) brighter than the z = 10.3 ± 0.8 (68% confidence) candidate in the UDF (Bouwens et al. 2011a). MACS0647-JD is a J-dropout as all three lensed images are securely detected in F160W and F140W but drop out of detection in the J-band F125W and all 14 bluer HST filters. We show this photometry is most likely due to the Lyman-α break redshifted to ∼ 1.46µm at z ∼ 11. This Lyman dropout technique (Meier 1976; Giavalisco 2002) pioneered by Steidel et al. (1996) at z ∼ 3 has been used with a high success rate to identify highredshift candidates later spectroscopically confirmed out to z ∼ 7. However care must be taken not to confuse dropouts with intrinsically red (evolved and/or dusty) galaxies at intermediate redshift (Schaerer et al. 2007; Dunlop et al. 2007; Chary et al. 2007; Capak et al. 2011;.
(3) CLASH: Three strongly lensed images of a candidate z ≈ 11 galaxy Table 1 Observed Filters and Integration Times Filter F225W F275W F336W F390W F435W F475W F555W F606W F625W F775W F814W F850LP F105W F110Wb F125W F140W F160W IRAC ch1 IRAC ch2. wavelengtha 0.24µm 0.27µm 0.34µm 0.39µm 0.43µm 0.47µm 0.54µm 0.59µm 0.63µm 0.77µm 0.81µm 0.90µm 1.06µm 1.15µm 1.25µm 1.39µm 1.54µm 3.55µm 4.50µm. exposure 3805 3879 2498 2545 2124 2248 7740 2064 2131 2162 12760 4325 2914 1606 2614 2411 5229 18000 18000. sec sec sec sec sec sec sec sec sec sec sec sec sec sec sec sec sec sec sec. 1. Effective “pivot” wavelength (Tokunaga & Vacca 2005). 2 Visit A2 only, excluding visit A9 (§3.1).. Boone et al. 2011; Hayes et al. 2012). In the case of MACS0647-JD, we show it is extremely difficult, if not impossible, for low redshift interlopers to reproduce the observed colors, especially the J125 − H160 & 3 magnitude break of MACS0647-JD1. We also test our analysis method by reanalyzing previously published J-dropouts which later proved to be at intermediate redshift. Our Bayesian photometric redshift (BPZ, Benı́tez 2000; Coe et al. 2006) analysis correctly shows intermediate redshift solutions are preferred for those objects, while preferring a higher redshift for MACS0647-JD. We describe our HST and Spitzer observations in §2 and present photometry in §3. We derive the photometric redshift in §4 and consider a wide range of possible interlopers in §5. We present our gravitational lensing analysis in §6. In §7 we derive physical properties of MACS0647-JD based on additional photometric analysis. In §8 we compare our observed number density of z ∼ 11 galaxies to that expected, and we constrain the z > 9 star formation rate density. Finally, we present conclusions in §9. Where necessary we assume a concordance ΛCDM cosmology with h = 0.7, Ωm = 0.3, ΩΛ = 0.7, where H0 = 100 h km s−1 Mpc−1 . In this cosmology 100 = 3.93 kpc at z = 10.8 and 6.62 kpc at the cluster redshift z = 0.591. 2. OBSERVATIONS. As part of the CLASH program, HST observed the core of MACSJ0647.7+7015 (Fig. 1) during 19 orbits spread among eight different visits between October 5 and November 29, 2011 (General Observer program 12101). Imaging was obtained with the Wide Field Camera 3 (WFC3; Kimble et al. 2008) and Advanced Camera for Surveys (ACS; Ford et al. 2003) in 15 filters spanning 0.2–1.7µm including five near-infrared WFC3/IR filters spanning 0.9–1.7µm. These datasets were supplemented by prior ACS imaging obtained in the F555W (0.56µm) and F814W (0.81µm) filters to total depths of ∼ 3.5 and 5.5 orbits, respectively (GO 9722 P.I. Ebeling; GO 10493,. 3. 10793 P.I. Gal-Yam). These observations are detailed in Table 1. We processed the images for debias, (super)flats, and darks using standard techniques, then co-aligned and combined them to a scale of 0.065”/pixel; see Koekemoer et al. (2002, 2011) for further information on the astrometric alignment and drizzle algorithms that were used and Postman et al. (2012) for specific details on their implementation in CLASH. We also produced inverse variance maps (IVMs) based on the observed sky level, identified cosmic rays, detector flat field, readnoise, dark current, and bad pixels. These IVMs may be used to estimate the level of uncertainty in each pixel before accounting for correlated noise and any Poisson source noise. Imaging at longer wavelengths was obtained by the Spitzer Space Telescope with the InfraRed Array Camera (IRAC; Fazio et al. 2004) ch1 (3.6µm) and ch2 (4.5µm) with total exposure times of 5 hours at each wavelength (Program 60034, P.I. Egami). These observations were divided into two epochs separated by ∼5.5 months (Nov. 10, 2009 and Apr. 23, 2010). We combined the Basic Calibrated Data (BCD) using MOPEX (Makovoz & Khan 2005) to produce mosaicked images. As of July 2012, CLASH had obtained 16band HST observations for 17 clusters, including MACSJ0647.7+7015 and three other “highmagnification” strong lensing clusters, as given in Table 3. We searched for high redshift galaxies in the WFC3/IR fields of view of all 17 of these clusters (Bradley et al. 2012c, in preparation). Out of ∼20,000 detected sources, we identified MACS0647-JD (Fig. 2) as having an exceptionally high photometric redshift (§4). Our selection was based on SED (spectral energy distribution) fitting as used in some previous high-redshift searches (e.g., McLure et al. 2006; Dunlop et al. 2007; Finkelstein et al. 2010). We did not impose specific magnitude limits, color cuts, or other detection thresholds on our selection as in other works (e.g., Bunker et al. 2010; Yan et al. 2011; Bouwens et al. 2012b; Oesch et al. 2012b). 3. PHOTOMETRY 3.1. HST Photometry 3.1.1. Photometric Analysis. We used SExtractor version 2.5.0 (Bertin & Arnouts 1996) to detect objects in a weighted sum of all five HST WFC3/IR images. Along the edge of each object, SExtractor defines an isophotal aperture consisting of pixels with values above a detection threshold. We set this threshold equal to the RMS measured locally near each object. Isophotal fluxes (and magnitudes) are measured within these isophotal apertures. SExtractor derives flux uncertainties by adding in quadrature the background RMS derived from our inverse variance maps and the Poisson uncertainty from the object flux. Since our images are drizzled to a 0.065” pixel scale, which is 2-3 times smaller than the WFC3 PSF, the resulting images contain significant correlated noise. The weight maps produced by drizzle represent the expected variance in the absence of correlated noise. To account for the correlated noise, one may apply a correction factor as in Casertano et al. (2000)..
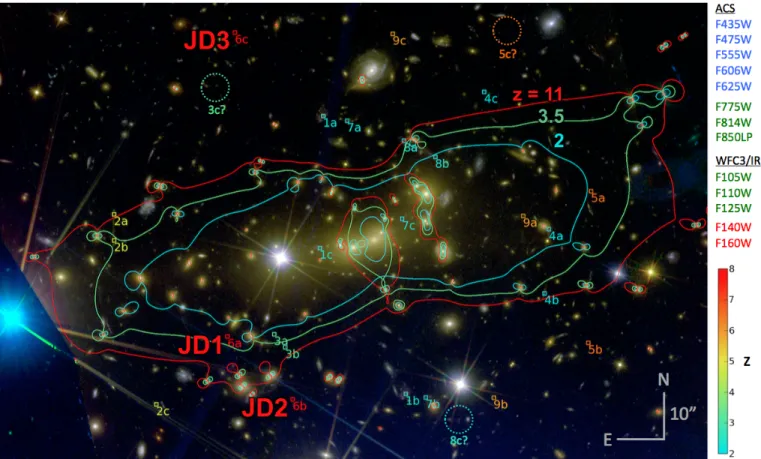
(4) 4. Coe et al. 2012. Figure 1. Lenstool strong lensing mass model of MACSJ0647.7+7015 and multiply-imaged galaxies as identified in this work using the Zitrin et al. (2009) method, including two strong lensing systems identified in Zitrin et al. (2011a). Each strongly lensed galaxy is labeled with a number and color-coded by redshift (scale at bottom right). Letters are assigned to the multiple images of each galaxy. Dashed circles indicate predicted locations of counterimages not unambiguously identified. Overplotted are critical curves from our Lenstool model indicating thin regions of formally infinite magnification for background galaxies at z = 2.0 (cyan), 3.5 (green) and 11.0 (red). Mirror images of galaxies straddle these critical curves. The Hubble color image was produced using Trilogy (Coe et al. 2012) and is composed of ACS and WFC3/IR filters as given at top right.. Previous authors have also noted that SExtractor tends to underestimate flux uncertainties (Feldmeier et al. 2002; Labbé et al. 2003; Gawiser et al. 2006) by as much as a factor of 2–3 (Becker et al. 2007). In this work, we obtained empirical measurements of the flux uncertainties using the following method which also captures the effects of correlated noise. SExtractor has the ability to measure the local background within a rectangular annulus (default width 24 pixels) around each object. We constructed a rectangle of the same size, but rather than calculate the RMS of the individual pixels, we obtained samples of the background flux within this region using the isophotal aperture shifted to new positions. In other words, we moved the isophotal aperture to every position within this rectangle, sampling the flux at each position. We discarded measurements for which the aperture includes part of any object, as we are interested in measuring the background flux. Finally we measured the RMS of these measurements and added in quadrature the object’s Poisson uncertainty to obtain the total flux uncertainty for that object. We found this technique indeed yielded larger flux uncertainties than reported by SExtractor, typically by factors of 2–3 in the WFC3/IR filters and by lower factors in ACS and WFC3/UVIS. We also used this method to determine object fluxes. The mean of the flux measurements in the nearby apertures was adopted as the local flux bias, which we sub-. tracted from the flux measurement in the object itself. We found this yielded photometry very similar to that obtained using SExtractor, agreeing well within the photometric uncertainties. While we used this photometry for all subsequent analyses, we also verified that our derived photometric redshifts did not vary significantly (after excluding the F110W second epoch exposures; §3.1.3) if we instead utilized photometry derived directly from SExtractor. We corrected for Galactic extinction of E(B − V ) = 0.11 in the direction of MACSJ0647.7+7015 as derived using the Schlegel et al. (1998) IR dust emission maps. For each filter, the magnitudes of extinction per unit E(B − V ) are given in Postman et al. (2012, their Table 5). (These values should be ∼10% lower in the NUV and optical according to Schlafly & Finkbeiner 2011.) This extinction reddens the observed colors at the few percent level in the near-IR. Thus the effects on the J-dropout are negligible. The extinctions range from 0.05 to 0.11 mag in the WFC3/IR images; 0.16 to 0.46 mag in the ACS images; and 0.50 to 0.83 mag in WFC3/UVIS. We note the extinction may be somewhat uncertain due to patchy galactic cirrus in the direction of MACSJ0647.7+7015. 3.1.2. Photometric Results. Our resulting 17-band HST photometry is given in Table 2 and Fig. 4. All three J-dropouts are detected at >10-σ in F160W, >6-σ in F140W, and <3-σ in all other.
(5) CLASH: Three strongly lensed images of a candidate z ≈ 11 galaxy. 5. Table 2 Coordinates, Observed Filters, and Photometry of the J-dropouts JD1 R.A. (J2000) Decl. (J2000) F225W F275W F336W F390W F435W F475W F555W F606W F625W F775W F814W F850LP F105W F110Wb F125W F140W F160W IRAC ch1 IRAC ch2. 06:47:55.731 +70:14:35.76 -129 ± 51 nJy (-2.5σ) -95 ± 51 nJy (-1.9σ) 2 ± 37 nJy ( 0.0σ) -8 ± 20 nJy (-0.4σ) 0 ± 26 nJy ( 0.0σ) -2 ± 14 nJy (-0.1σ) -3 ± 9 nJy (-0.3σ) 3 ± 16 nJy ( 0.2σ) -35 ± 21 nJy (-1.7σ) 4 ± 30 nJy ( 0.2σ) 0 ± 8 nJy ( 0.1σ) -3 ± 30 nJy (-0.1σ) 11 ± 12 nJy ( 0.9σ) -8 ± 10 nJy (-0.8σ) -3 ± 10 nJy (-0.3σ) 63 ± 10 nJy ( 6.0σ) = 26.90 ± 0.17 mag AB 162 ± 13 nJy (12.4σ) = 25.88 ± 0.09 mag AB < 277 nJyc < 245 nJyc. JD2. JD3. 06:47:53.112 +70:14:22.94 -40 ± 50 nJy (-0.8σ) -31 ± 42 nJy (-0.8σ) 49 ± 29 nJy ( 1.7σ) 1 ± 19 nJy ( 0.1σ) 43 ± 24 nJy ( 1.8σ) -27 ± 16 nJy (-1.7σ) 12 ± 7 nJy ( 1.7σ) 13 ± 20 nJy ( 0.6σ) -52 ± 24 nJy (-2.2σ) -16 ± 52 nJy (-0.3σ) -2 ± 5 nJy (-0.3σ) 1 ± 29 nJy ( 0.0σ) 14 ± 13 nJy ( 1.1σ) 3 ± 9 nJy ( 0.3σ) 7 ± 16 nJy ( 0.5σ) 50 ± 8 nJy ( 6.7σ) = 27.15 ± 0.17 mag AB 136 ± 9 nJy (15.1σ) = 26.07 ± 0.07 mag AB < 166 nJy 436 ± 139 nJy ( 3.1σ). 06:47:55.452 +70:15:38.09 12 ± 32 nJy ( 0.4σ) 49 ± 24 nJy ( 2.0σ) -25 ± 18 nJy (-1.4σ) 1 ± 10 nJy ( 0.1σ) 5 ± 14 nJy ( 0.4σ) 7 ± 8 nJy ( 0.9σ) 6 ± 4 nJy ( 1.4σ) -1 ± 6 nJy (-0.1σ) 23 ± 10 nJy ( 2.3σ) 4 ± 10 nJy ( 0.3σ) -2 ± 3 nJy (-0.8σ) 6 ± 15 nJy ( 0.4σ) 3 ± 5 nJy ( 0.6σ) 7 ± 4 nJy ( 1.9σ) 2 ± 5 nJy ( 0.4σ) 26 ± 4 nJy ( 6.1σ) = 27.86 ± 0.17 mag AB 42 ± 4 nJy (10.1σ) = 27.34 ± 0.10 mag AB < 166 nJy < 138 nJy. JD1 + JD2 + JD3a. -157 ± 78 nJy (-2.0σ) -77 ± 70 nJy (-1.1σ) 25 ± 50 nJy ( 0.5σ) -6 ± 29 nJy (-0.2σ) 48 ± 38 nJy ( 1.3σ) -22 ± 23 nJy (-1.0σ) 15 ± 12 nJy ( 1.3σ) 15 ± 26 nJy ( 0.6σ) -64 ± 33 nJy (-1.9σ) -8 ± 61 nJy (-0.1σ) -3 ± 10 nJy (-0.3σ) 4 ± 45 nJy ( 0.1σ) 28 ± 18 nJy ( 1.6σ) 2 ± 14 nJy ( 0.1σ) 6 ± 20 nJy ( 0.3σ) 139 ± 14 nJy ( 9.9σ) = 26.04 ± 0.11 mag AB 341 ± 16 nJy (21.3σ) = 25.07 ± 0.05 mag AB < 363 nJy 436 ± 314 nJy ( 1.4σ). Note. — Fluxes in nanoJanskys (nJy) may be converted to AB magnitudes via mAB ≈ 26 − 2.5 log10 (Fν /(145 nJy)). Magnitude uncertainties, where given, are non-Gaussian but are approximated as 2.5 log10 (e) times the fractional flux uncertainties. 1 Sum of all three images with uncertainties added in quadrature. 2 Visit A2 only, excluding visit A9 which exhibits significantly elevated and non-Poissonian backgrounds due to Earthshine (§3.1). 3 Includes uncertainties from modeling and subtracting a nearby brighter galaxy. More conservative estimates of these uncertainties were also considered in the analysis (§3.2).. 3.1.3. Exclusion of F110W Second Epoch. Table 3 17 Clusters Searched in This Work High Magnification?a. Y Y Y. Y. Clusterb. Redshift. Abell 383 (0248.1−0331) Abell 611 (0800.9+3603) Abell 2261 (1722.5+3207) MACSJ0329.7−0211 MACSJ0647.8+7015 MACSJ0717.5+3745 MACSJ0744.9+3927 MACSJ1115.9+0129 MACSJ1149.6+2223 MACSJ1206.2−0847 MACSJ1720.3+3536 MACSJ1931.8−2635 MACSJ2129.4−0741 MS2137.3−2353 RXJ1347.5−1145 RXJ1532.9+3021 RXJ2129.7+0005. 0.187 0.288 0.244 0.450 0.591 0.548 0.686 0.355 0.544 0.439 0.387 0.352 0.570 0.313 0.451 0.363 0.234. 1. CLASH clusters were selected based on either X-ray or strong lensing properties. The latter “high magnification” clusters are marked with Y’s here. For details, see Postman et al. (2012). 2 R.A. & Decl. (J2000) are given in parentheses for the Abell clusters, encoded as they are in the names of the other clusters.. filters. JD1 is not detected above 1-σ in any filter blueward of F140W. All three J-dropouts are confidently detected in two filters (F140W and F160W) observed at six different epochs over a period of 56 days (Fig. 5). No significant temporal variations are observed in position or brightness, ruling out solar system objects and transient phenomena such as supernovae, respectively (see Figs. 3 and 6 and §5).. Based on an initial standard reduction of the HST images and standard SExtractor photometry, MACS0647JD2 was detected in F110W at 5-σ, while JD1 and JD3 were not significantly detected (0.9-σ and 1.7-σ, respectively). Our empirical rederivations of the photometric uncertainties, including proper accounting for correlated noise (§3.1.1), reduced the significance of this detection to 2.5-σ. However we ultimately we concluded this marginal detection was completely spurious due to significantly elevated and non-Poissonian backgrounds due to Earthshine in two out of five F110W exposures, both obtained during the second epoch (see below). After excluding these exposures, the detection significance drops to 0.3-σ, consistent with background noise. For reference, see the WFC3/IR images in Fig. 2. Even based on the initial “standard” analysis described above, we determined that MACS0647-JD is at z < 9 with a likelihood of ∼10−9 based on a joint photometric redshift analysis of all three images (§4). This likelihood decreased further to 3×10⁻¹³ based on our improved analysis. These values are summarized in Table 4. The spuriously high flux measurements may be seen in Fig. 3. The final observations of MACSJ0647.7+7015 were two 502-second exposures in F110W obtained during visit A9, the second epoch for that filter. We found these to have significantly elevated backgrounds of 1.9 (sigmaclipped mean) ± 0.44 (RMS) and 6.4 ± 0.27 electrons per second, respectively, compared to the more typical values around 1.5 ± 0.08. These high backgrounds were due to Earthshine, or sunlight reflected from the Earth. The first observation was obtained during twilight as the tele-.
(6) 6. Coe et al. 2012 Table 4 Effects of F110W Aberrant Second Epoch F110W detection σ. JD1. JD2. JD3. P(z < 9)a. SExtractor photometry Empirical uncertainties Excluding second epoch. 0.9 0.5 −0.8. 5.0 2.5 0.3. 1.7 1.0 1.9. 1×10⁻⁹ 4×10⁻⁸ 3×10⁻¹³. Note. — JD2 is spuriously detected in F110W images processed using standard techniques. This is due to significantly elevated non-Poissonian backgrounds in the second epoch of observations due to Earthshine. We exclude this epoch in our analysis. See §3.1 1 Based on the summed photometry of all three images, and assuming MACS0647-JD is a galaxy well described by our templates. See §§4–5.. scope pointed within 67–59 degrees of the bright limb of the Earth. This Earth limb angle continued to steadily decrease from 47 to 24 degrees during the second observation which was obtained during daylight. In the observation log, the diagnostic Earth bright limb flag was raised halfway through the second exposure. We also examined the ten individual readouts of 100 seconds each obtained over the course of both exposures and found the mean background increased steadily from 0.9 to 7.5 electrons per second. The resulting elevated background RMS values of 0.44 and 0.27 electrons per second in the two exposures are the highest and sixth highest relative to the median values for a given filter in 1,582 CLASH observations to date of 17 clusters. None of the three F160W observations obtained at the beginning of visit A9 exhibit elevated backgrounds because they were obtained at night (twilight had yet to set in) and the Earth is less bright in F160W. Specifically, when we compared the measured RMS values to what would be expected from scaling the background intensity levels, we found that these RMS values are several times higher than would be expected in the case of Poissonian statistics. We attribute this to the fact that the sky background was increasing in a strongly non-linear fashion during the exposure, whereas the up-the-ramp slope fitting algorithm implemented in “calwf3” implicitly assumes that the count rate is constant when converting measured counts into counts/second (see Dressel 2011). Since this assumption is violated, the the pixel-to-pixel variations in the final count-rate image no longer scale as expected for Poissonian statistics, as demonstrated by the much higher RMS values. Since these data no longer conform to Poissonian statistics, we were able to demonstrate that attempting to combine them with the other data did not yield an improvement in S/N but instead produced combined datasets with non-Poissonian statistics, from which we were not able to obtain reliable photometry. We therefore exclude the two F110W visit A9 exposures from our analysis and derive photometry instead from the weighted sum of the three visit A2 exposures. 3.2. Spitzer Photometry To derive photometry in the longer wavelength Spitzer IRAC images (Fig. 7), we performed both GALFIT PSF fitting and aperture photometry on JD2 and JD3. No significant flux is detected for either object in either channel except for a 3-σ detection of JD2 in ch2: mag = 24.8 ± 0.3. Aperture photometry (2.4” diameter aper-. ture) yields mag = 25.8 ± 0.3, subject to an approximate 0.7 mag correction, roughly consistent with the GALFITderived photometry. JD1 is significantly contaminated by light from a nearby cluster galaxy. We modeled this galaxy using GALFIT, subtracted it from the image, and measured photometry in 2.4” diameter apertures, yielding a null detection plus uncertainty. We also added a simulated 25th magnitude source and used GALFIT to derive its photometry. We conservatively combined the uncertainties from these two measurements in quadrature to yield total uncertainties (1-σ upper limits) of 277 and 245 nJy in ch1 and ch2, respectively (3-σ limits of mag 24.2 and 24.1). We also experimented with inflating these uncertainties further by one magnitude (3-σ limits of mag 23.2 and 23.1). This would increase the JD1 z < 9 likelihood (see §4) from ∼3×10⁻⁷ to 2×10⁻⁵ , and the likelihood based on the integrated photometry of all three images from 3×10⁻¹³ to 2×10⁻⁹ . 4. PHOTOMETRIC REDSHIFT. We perform two independent analyses of the HST+Spitzer photometry to estimate the photometric redshift of MACS0647-JD. These two methods, BPZ (§4.1) and LePHARE (§4.2) were the top two performers out of 17 methods tested in Hildebrandt et al. (2010). They yielded the most accurate redshifts with the fewest outliers given a photometric catalog for galaxies with known spectroscopic redshifts. According to our gravitational lensing models (§6), MACS0647-JD1, 2, and 3 are likely three multiple images of the same strongly lensed background galaxy. Thus, in this section, we present photometric redshift likelihoods for each individual image, as well as jointly for the two brighter images and for all three images. 4.1. Bayesian Photometric Redshifts (BPZ). We used BPZ (Bayesian Photometric Redshifts; Benı́tez 2000; Coe et al. 2006) for our primary photometric redshift analyses. We modeled the observed HST+Spitzer photometry of MACS0647-JD using model SEDs from PEGASE (Fioc & Rocca-Volmerange 1997) which have been significantly adjusted and recalibrated to match the observed photometry of galaxies with known spectroscopic redshifts from FIREWORKS (Wuyts et al. 2008). The FIREWORKS data set includes 0.38–24µm photometry of galaxies down to mag ∼ 24.3 (5-σ K-band) and spectroscopic redshifts out to z ∼ 3.7. In analyses of large datasets with high quality spectra, this template set yields . 1% outliers, demonstrating that it encompasses the range of metallicities, extinctions, and star formation histories observed for the vast majority of real galaxies. (In §5.1 we explore a still broader range of galaxy properties using a synthetic template set which has not been recalibrated to match observed galaxy colors.) These templates include nebular emission lines as implemented by Fioc & RoccaVolmerange (1997). The Bayesian analysis tempers the SED model quality of fit with an empirically derived prior P (z, T |m) on the galaxy redshift and type given its (delensed) magnitude. Our prior was constructed as in Benı́tez (2000) and updated based on likelihoods P (z, T |m) observed in COSMOS (Ilbert et al. 2009), GOODS-MUSIC (Grazian et al..
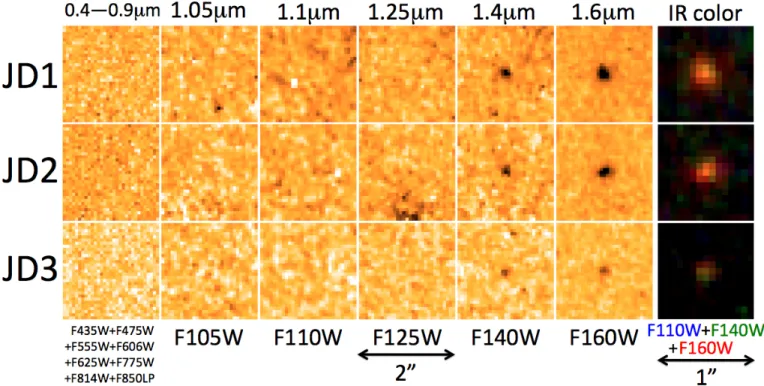
(7) CLASH: Three strongly lensed images of a candidate z ≈ 11 galaxy. 7. Figure 2. The three images of MACS0647-JD as observed in various filters with HST. The leftmost panels show the summed 11-hour (17-orbit) exposures obtained in 8 filters spanning 0.4–0.9µm with the Advanced Camera for Surveys. The five middle columns show observations with the Wide Field Camera 3 IR channel in F105W, F110W, F125W, F140W, and F160W, all shown with the same linear scale in electrons per second. The F125W images were obtained at a single roll angle, and a small region near JD2 was affected by persistence due to a moderately bright star in our parallel observations immediately prior (see also Fig. 5). The right panels zoom in by a factor of 2 to show F110W+F140W+F160W color images scaled linearly between 0 and 0.1 µJy.. Figure 3. Flux measurements in the individual epochs observed over a period of 56 days. Filters are colored F160W (red), F140W (yellow), F125W (green), and F110W (blue) as both individual data points and solid bands as determined for the summed observations. The F110W exposures obtained in the second epoch (visit A9) were found to have significantly elevated and non-Poissonian backgrounds due to Earthshine (§3.1). These were excluded in our analysis; we adopted the F110W fluxes measured in the first epoch (visit A2).. 2006; Santini et al. 2009), and the UDF (Coe et al. 2006). According to this prior (extrapolated to higher redshifts), all galaxy types of intrinsic (delensed) magnitude ∼28.2 are over 80 times less likely to be at z ∼ 11 than z ∼ 2. Thus our analysis is more conservative regarding high redshift candidates than an analysis which neglects to implement such a prior (implicitly assuming a flat prior in redshift). The prior likelihoods for MACS0647-JD are uncertain both due to the prior’s extrapolation to z ∼ 11 and uncertainty in MACS0647-JD’s intrinsic (delensed) magnitude. Yet it serves as a useful approximation which is surely more accurate than a flat prior.. Based on this analysis, we derived photometric redshift likelihood distributions as plotted in Fig. 8 and summarized in Table 5. The images JD1, JD2, and JD3 are best fit by a starburst SED at z ∼ 10.9, 11.0, and 10.1, respectively. After applying the Bayesian prior, we find JD1 and JD2 are most likely starbursts at z ∼ 10.6 and 11.0, respectively. A z ∼ 2.5 elliptical template is slightly preferred for JD3, however z = 11 is within the 99% confidence limits (CL). Observed at mag ∼ 27.3, we may not expect this fainter image to yield as reliable a photometric redshift. In Table 4 we also provide joint likelihoods based on.
(8) 8. Coe et al. 2012. Figure 4. Observed HST photometry (filled circles and triangles) plotted against the expected fluxes (open blue squares) from a young starburst galaxy spectrum (gray line) redshifted to z ∼ 11. HST filter transmission curves are plotted in the upper panel, normalized to their maxima, and with black dots indicating the effective “pivot” wavelengths. Photometry of the J-dropouts observed through these filters (Table 2) is plotted as the larger circles and triangles for positive and negative observed fluxes, respectively, with 1-σ error bars. For some points, horizontal “error bars” are plotted to reiterate the filter widths. The gray line is a model spectrum of a young starburst at z = 11.0, the best fit to the summed photometry. The integrals of this spectrum through our filters give the model predicted fluxes plotted as blue squares. Other galaxy types at z ∼ 11 yield similar predicted HST fluxes, as the shape of the spectrum cannot be constrained by the HST photometry alone. Redshifted Lyman-α at 0.1216µm(1 + z) ∼ 1.46µm is indicated by the vertical dashed line.. the brighter two images and all three images equally weighted. To properly downweight the fainter image, we also analyzed the integrated photometry of all three images (with uncertainties added in quadrature). Based on this analysis including our Bayesian prior, and assuming MACS0647-JD is a galaxy well described by our template set (see also §5.1), we found z = 10.7+0.6 −0.4 (95% CL) with a ∼3×10⁻¹³ likelihood that MACS0647-JD is at z < 9. This likelihood corresponds to a 7.2-σ confidence that. MACS0647-JD is at z > 9. The joint likelihood analysis (weighting all images equally) yields a similar 95% CL [10.2–11.1] and a more conservative P (z < 9) ∼ 2×10⁻⁸ , or z > 9 at 5.5-σ. The strong confidence in the high redshift solution requires the combined HST and Spitzer photometry. Without the Spitzer photometry, the z > 9 likelihood would drop to 95% for the summed HST photometry. Similarly, we would find P (z > 9) ∼ 91% for JD1 individ-.
(9) CLASH: Three strongly lensed images of a candidate z ≈ 11 galaxy. 9. Figure 5. MACS0647-JD as observed in each of the individual epochs of F160W and F140W obtained over a 56-day period. These observations were obtained at two different telescope roll angles which alternate between the stamps shown here. A small region of the WFC3/IR images in our first roll angle was affected by persistence due to a moderately bright star in our parallel observations immediately prior. These pixels happen to fall within 100 of JD2 at that roll angle (marked in gray here and flagged as unreliable). Excluding this roll angle for JD2 does not significantly affect the derived photometry.. Figure 6. Relative centroid measurements for the detections in F160W (red) and F140W (yellow) in individual epochs (circles) and summed observations (squares). Centroids measured in the summed NIR images are also plotted as gray diamonds. The offsets are generally less than one of our drizzled pixels (0.06500 ), roughly half the native WFC3/IR pixel size (∼0.1300 )..
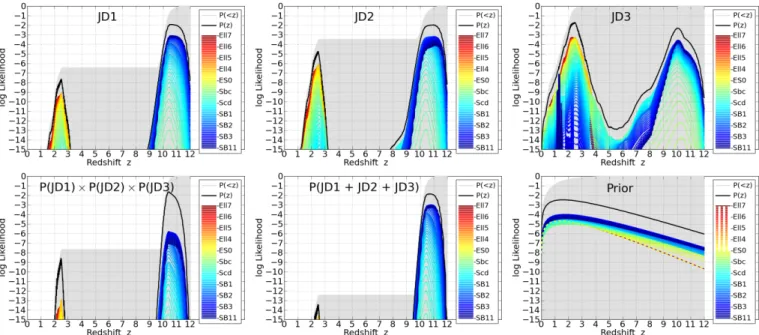
(10) 10. Coe et al. 2012. Figure 7. Spitzer IRAC ch1 (3.6µm) and ch2 (4.5µm) images of MACS0647-JD compared to the HST WFC3/IR F160W (1.6µm) image. Two intensity scalings and zooms are shown. Left: Both 2600 × 2600 F160W cutouts are scaled linearly in photon counts to the same range as Fig. 2. And for each Spitzer filter, the same count range is used in each row. The background photon counts are significantly higher near JD1 and JD2 (top row) due to intracluster light and scattered starlight. MACS0647-JD is not detected brightly in the Spitzer images, supporting the high-redshift solution. The only possible detection we report is for JD2 at 3.1-σ in ch2 (Table 2). JD1 is contaminated by light from other nearby galaxies which we modeled and subtracted to estimate JD1’s photometry. Right: In each of these 500 × 500 closeups, the intensity is scaled independently to the observed range within the central 300 × 300 .. Figure 8. Top row: photometric redshift probability distributions based on our BPZ analysis (§4.1) of HST+Spitzer photometry for each image. Cumulative probabilities P (< z) are shaded gray; probabilities P (z) per unit 0.01 in redshift are drawn as black lines; and likelihoods for individual SED templates are drawn as colored lines. In this work, we use four elliptical templates (Ell), one E/S0, two spirals (Sbc and Scd), and four starbursts (SB). We then interpolate nine templates between each pair of adjacent templates. Bottom left: joint likelihoods for all three images. Bottom center: likelihoods based on the summed photometry of all three images. For all of these likelihoods, we assume the prior plotted at bottom right for galaxies of intrinsic (delensed) magnitude ∼28.2. This prior was empirically derived from large surveys with photometric and spectroscopic redshifts and extrapolated to higher redshifts..
(11) CLASH: Three strongly lensed images of a candidate z ≈ 11 galaxy Table 5 Individual and Joint Redshift Likelihoods Image JD1 (F160W ∼ 25.9)a JD2 (F160W ∼ 26.1)a JD3 (F160W ∼ 27.3)a P(JD1)×P(JD2)b P(JD1)×P(JD2)×P(JD3)b P(JD1 + JD2)c P(JD1 + JD2 + JD3)c. 95% CL. 99% CL. P(z < 9). 10.62+0.83 −0.34 10.99+0.50 −0.77 2.48+7.95 −0.42 10.66+0.68 −0.31 10.42+0.66 −0.19 10.99+0.43 −0.61 10.71+0.59 −0.37. [10.11–11.67] [ 9.99–11.69] [ 1.81–11.07] [10.21–11.53] [10.12–11.30] [10.22–11.59] [10.20–11.47]. 3×10⁻⁷ 3×10⁻⁴ 7×10⁻¹ 4×10⁻¹⁰ 2×10⁻⁸ 2×10⁻¹¹ 3×10⁻¹³. Note. — BPZ results assuming MACS0647-JD is well modeled by our SED templates (§§4–5). All likelihoods include a Bayesian prior which assumes galaxies of this (unlensed) magnitude are over 80 times more likely to be at z ∼ 2 than z ∼ 11. See also Fig. 8. 1 Approximate AB magnitudes are given in parentheses. (See also Table 2.) Note JD3 is significantly fainter. 2 Joint likelihood of multiple images weighted equally. 3 Likelihood based on integrated photometry of multiple images.. ually. However, the most likely solutions for JD2 and JD3 would be early types at z ∼ 4. We would expect such galaxies to be mag ∼ 23 in the Spitzer observations, which is extremely unlikely (as quantified above) given the measured photometry (see also §3.2). 4.2. Le PHARE. We also used Le PHARE (Arnouts et al. 1999; Ilbert et al. 2006, 2009) to independently estimate the photometric redshifts. For this analysis we used a SED template library primarily from Ilbert et al. (2009) as optimized for the COSMOS survey (Scoville et al. 2007b,a; Koekemoer et al. 2007). This includes three ellipticals and seven spirals as generated by Polletta et al. (2007) using the GRASIL code (Silva et al. 1998), as well as 12 starburst galaxies with ages ranging from 30 Myr to 3 Gyr generated by GALAXEV based on Bruzual & Charlot (2003). We supplemented these with four additional elliptical templates for a total of seven ellipticals. We added dust extinction in ten steps up to E(B − V ) = 0.6. (Stronger degrees of extinction are explored in §5.1.1.) Four different dust laws were explored: Calzetti et al. (2000); Calzetti plus two variations on a 2170Å bump; and Prevot et al. (1984) as observed for the SMC. We adopted the Benı́tez (2000) prior as implemented in LePhare. The results were consistent with those from +0.5 BPZ: z = 10.6+0.6 −0.2 (JD1), z = 10.6−0.3 (JD2), and z = +0.3 10.1−0.3 (JD3), each at 68% CL. A secondary solution of z ∼ 2.5 was reported for JD3 with a peak likelihood ten times less than that of the best fit high redshift solution. 5. LOWER REDSHIFT INTERLOPERS RULED OUT. In this section we consider a broad range of z < 11 possibilities. As found in §4, the z < 9 likelihood is formally ∼3×10⁻¹³ assuming MACS0647-JD is a galaxy well-modeled by our SED templates. Though strongly disfavored, a z ∼ 2.5 early type and/or dusty galaxy is the most likely alternative, as we discuss further in §5.1. We reanalyzed previously published J-dropouts and found them most likely to be at intermediate redshift (§5.2). Objects within the Galaxy are less likely, as this would require three objects with extremely rare colors (Fig. 13) at positions consistent with strongly-lensed. 11. multiple images according to our lens models (§6). Nevertheless, we found the only stars or brown dwarfs consistent with the observed colors are rare, transient postAGB flare-ups, though these would be far more luminous if observed within the Galaxy (§5.3). Solar system objects would have likely exhibited parallax motion and are inconsistent with the observed colors (§5.4). Intermediate redshift long duration multiply-imaged supernovae (§5.5) and emission line galaxies (§5.6) are also extremely unlikely. We conclude that MACS0647-JD is most likely either at z ∼ 11 or exhibits unique photometry yet to be observed in any other known object. 5.1. Intermediate Redshift Galaxy? 5.1.1. SED Constraints. While we found P (z < 9) ∼ 3×10⁻¹³ , the next best alternative to z ∼ 11 is an early type galaxy (ETG) at z ∼ 2.5 (Fig. 9). At z ∼ 2.65, the 4000Å break is redshifted to 1.46µm, coinciding with Lyman-α (1216Å) redshifted to z ∼ 11.0. However, 4000Å breaks are not expected to be as strong as observed for MACS0647-JD (Figs. 10 and 11). JD1 features a J125 − H160 & 3 magnitude break between F125W and F160W as well as a ∼1 magnitude break between F140W and F160W. Thus low redshift ETGs yield a significantly worse SED fit than z ∼ 11 for all three images as quantified in Fig. 8 and Table 5. To explore an even broader range of galaxy SED models than used in §4, we utilized the flexible stellar population synthesis (FSPS) models from Conroy et al. (2009) and Conroy & Gunn (2010). They provide simple stellar population (SSP) models which span ages of 5.5 ≤ log(age/yr) ≤ 10.175 and metallicities of 0.0002 ≤ Z ≤ 0.03 (where Z = 0.019). Nebular emission lines are not included. We convolved their SSP models with star formation histories (SFH) ranging from the single early burst (SSP) to exponentially declining (“τ models”), continuous (constant rate), and exponentially rising (“inverted τ models”). The latter rising SFH likely describes high-redshift galaxies best according to both observations (Maraston et al. 2010; Papovich et al. 2011; Reddy et al. 2012) and simulations (Finlator et al. 2011). Finally we added a variable degree (up to AV = 30 magnitudes) of Calzetti et al. (2000) dust extinction with RV = AV /EB−V = 4.05. To uncover the most likely solutions in different regions of this multi-dimensional parameter space, we began with relatively coarse grid searches with redshift intervals of 0.1 and ∼9 steps in each of the four other free parameters. We then zoomed in on the higher likelihood regions, found again to be roughly z ∼ 2.5 and 11. Finally, we ran Powell (1964) minimizations to find the best fitting SEDs at each of these redshifts. We supplemented these SEDs with a suite of smooth τ models with stochastic bursts superposed (e.g., Kauffmann et al. 2003; Salim et al. 2007), as well as truncated (“quenched”) SFHs designed to reproduce the colors of post-starburst (K+A) galaxies. Our results with this combined template set confirm that a z ∼ 11 model fits MACS0647-JD best, while evolved and/or dusty galaxies at z ∼ 2.5 provide the best alternatives but are still significantly worse statistically. The best fitting intermediate-redshift template.
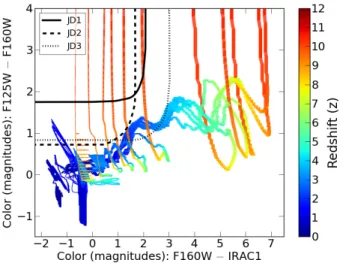
(12) 12. Coe et al. 2012. Figure 9. Observed near-IR photometry from HST WFC3/IR and Spitzer IRAC (filled circles and triangles) compared to the expected fluxes (open squares) from two SEDs: the z = 11.0 starburst from Fig. 4 (blue) and a z = 2.5 early type galaxy (red). Note the JD3 plot is scaled differently along the y-axis.. Figure 10. Observed WFC3/IR colors (shaded 68% confidence regions) for JD1 (solid lines), JD2 (dashed lines), and JD3 (dotted lines) plotted against those predicted with the BPZ template set from young starburst (blue) to early type (yellow-orange-red) as a function of redshift. The three panels plot flux ratios in F125W / F160W (left), F125W / F140W (middle), and F140W / F160W (right). The corresponding colors in magnitudes are given along the right axes.. Figure 11. Observed colors in WFC3/IR F125W − F160W and F160W − IRAC ch1 plotted as black lines (95% confidence limits) versus those predicted from the current BPZ template library (lines colored as a function of redshift and made thicker for earlier galaxy types).. to the summed photometry (z ∼ 2.7; ∼400 Myr old; AV ∼ 0.8 mag) with χ2 = 57.6 is only ∼10−9 times as likely as the best fitting z ∼ 11 template (z ∼ 10.9; ∼6 Myr old; AV = 0) yielding χ2 = 16.9 with & 14 degrees of freedom given the 19 photometric measurements and . 5 free parameters (see discussion in Andrae et al. 2010).. The uncertainties on the z ∼ 11 SED parameters are quantified in §7.3. A proper calculation of the redshift likelihoods based on these templates would require an estimate of the prior likelihoods in this multidimensional parameter space, which is beyond the scope of this work. And while these templates probe a broad parameter space, we derive our primary photometric redshift estimates in §4 from templates which have been well calibrated to match the observed photometry of galaxies with spectroscopic redshifts. We note there is no evidence that z > 2 ETGs have significantly different SEDs than our ETG models calibrated at lower redshifts. The highest redshift ETG observed to date is HUDF-1446 with a spectroscopic redshift z = 2.67 (Damjanov et al. 2011). Coe et al. (2006) published a photometric redshift z = 2.74 ± 0.44 for this object using BPZ, in good agreement with the true redshift. Their ETG templates yielded a good fit to the 0 ACS (B435 V606 i0775 z850 ) and NICMOS (J110 H160 ) photometry, including the J110 − H160 = 1.89 ± 0.13 break with H160 = 23.074 ± 0.098 and significant detections in all ACS filters. 5.1.2. Lower Stellar Mass Than Observed z > 2 ETGs. If MACS0647-JD were at z ∼ 2.5 (despite the low likelihood of this from SED fitting) it would likely be the least massive early type host galaxy observed to date at z > 1. Spectroscopically confirmed z > 1.4 ETGs to date have stellar masses > 2×10¹⁰ M (Damjanov et al. 2011). HUDF-1446 at z = 2.67, for example, is ∼8×10¹⁰ M ..
(13) CLASH: Three strongly lensed images of a candidate z ≈ 11 galaxy Our subset of lens models that allow for MACS0647JD to be at z ∼ 3 (§6.3) suggest that the magnification of the brightest two images would be µ > 30. Thus it would be intrinsically ∼300 times fainter than HUDF1446, with a correspondingly lower stellar mass on the order of ∼2×10⁸ M (and still < 109 M if we assume a more conservative magnification factor of µ ∼ 10; see also z ∼ 11 mass estimates in §7.2). Quiescent galaxies of such low masses at z > 2 would be a surprising discovery. Observations to date demonstrate (e.g., Peng et al. 2010) that star formation is only significantly quenched by feedback in more massive galaxies, or alternatively as a galaxy is harassed as a satellite of a larger halo. MACS0647-JD is not observed to be a satellite of a galaxy group. 5.2. Comparisons to Previously Published J-dropouts. The previous highest redshift candidate, UDFj39546284 (Bouwens et al. 2011a), was detected at 5.8-σ in a single HST band (WFC3/IR F160W) dropping out of F125W and bluer filters also with non-detections in Spitzer yielding a photometric redshift of z = 10.3 ± 0.8. The ultimate inclusion of the F140W filter on WFC3 (Brown & Baggett 2006) and in the CLASH observing program enable us to securely identify MACS0647-JD as the highest redshift galaxy candidate to date. At z ∼ 11.0, Lyman-α is redshifted to ∼1.46µm, causing the galaxy light to drop out of ∼2/3 of the F140W bandpass as well as ∼1/5 of F160W. The ratio between these two filling factors (0.8/0.33 ∼ 2.4, corresponding to ∼1.0 mag) places tight, model-independent constraints on the wavelength of the (redshifted) Lyman break and thus the redshift of MACS0647-JD (Fig. 10). The five NIR HST filters used by CLASH also enabled Zheng et al. (2012) to discover a J-dropout lensed by MACSJ1149.6+2233 and robustly measure its photometric redshift to be z = 9.6 ± 0.2 (68% CL). Laporte et al. (2011) identified a J-dropout lensed by Abell 2667 based on VLT (FORS2 and HAWK-I), ACS/F850LP, and Spitzer IRAC (ch1 through ch4) photometry. Hayes et al. (2012) then measured a spectroscopic redshift of z = 2.082 for that galaxy, A2667-J1. Laporte et al. (2011) had already emphasized that z > 9 possibilities were excluded based on the significant (6.0σ) ACS detection. We concur with this conclusion after reanalyzing their photometry as provided in Hayes et al. (2012). Only by excluding the ACS data point and assuming no Bayesian redshift prior do z > 9 solutions have significant probability (Fig. 12). If Spitzer IRAC ch3 and ch4 were not available (as is the case with MACS0647-JD) in addition to the ACS detection being unavailable, then the z > 9 likelihood would rise further yet still be insignificant once the prior is included. The z > 9 likelihood is enhanced further, but only modestly, if the IRAC ch1 and ch2 uncertainties are inflated to yield only 3-σ detections (as is the case for our JD2 IRAC ch2). In Fig. 12 we compare the observed NIR photometry of A2667-J1 and MACS0647-JD1. Our multiband HST photometry of the latter yields significantly tighter upper limits on the non-detections and adds a key data point at 1.4µm, resulting in a far greater z ∼ 11 likelihood even when accounting for the Bayesian prior which disfavors them (Fig. 8). We also applied our analysis methods to the photom-. 13. etry of other J-dropouts in the literature. Schaerer et al. (2007) showed A1835-#17 was fit well by a dusty (AV ∼ 3.6 mag) starburst at z ∼ 0.8. Dickinson et al. (2000) presented both z & 2 and z & 10 solutions for HDF-N J123656.3+621322. And HUDF-JD2 (Mobasher et al. 2005) has since been shown to likely be a z ∼ 1.7 LIRG (Chary et al. 2007). For all three of these Jdropouts, our analysis yields low redshift (2 . z . 4 or very dusty z . 1) solutions which are strongly preferred given our Bayesian prior. 5.3. Stars or Brown Dwarfs? MACS0647-JD1, JD2, and JD3 are most likely multiple images of a strongly lensed background galaxy, well behind the z = 0.591 cluster. Their observed colors are extremely rare in our multiband HST catalogs of 17 clusters observed to date (Fig. 13). And they lie at or near the predicted positions of multiply-lensed images (§6). It would be highly unlikely to find three foreground (unlensed) objects with such rare colors coincidentally at these positions. Still we consider here possible interlopers within the Galaxy, namely stars, brown dwarfs, and (in §5.4) solar system objects including KBOs (Kuiper Belt Objects) and Oort Cloud objects. JD1 and JD2 are perhaps marginally resolved with deconvolved FWHM . 0.200 (0.300 observed with a 0.200 PSF). We performed two independent analyses attempting to determine whether the observed FWHM was large enough to definitively distinguish it from the stellar locus. These analyses reached different conclusions. Therefore we turn to other lines of evidence to rule out stars and smaller objects. Stars are relatively plentiful in this field as the Galactic latitude is relatively low (+25.1◦ ). We used the online tool TRILEGAL21 (Girardi et al. 2005) to calculate that we may expect ∼5 late type M dwarfs of ∼26th magnitude or fainter within our FOV. However the predicted colors are J125 − H160 ∼ 0.4, a break significantly weaker than that observed. In Fig. 14, observed and expected colors of stars and brown dwarfs (including types M, L, T, and Y) are plotted versus those observed for the J-dropouts. No dwarf color is able to reproduce the observed J-dropout colors. According to models, the colors of extremely cold (∼200K) Y dwarfs come close to matching the red observed HST NIR colors, but these are expected to be significantly brighter in IRAC by up to 10 magnitudes. The coldest dwarfs yet discovered are Y dwarfs including WISEP J1828+2650 at ∼300 K (Cushing et al. 2011; Kirkpatrick et al. 2012) with colors as plotted in Fig. 14 from ground-based JH and WISE W2 4.6µm observations. Of the stellar spectra observed with IRTF (Cushing et al. 2005; Rayner et al. 2009), the M8III red giant WX Piscium (IRAS 01037+1219; Ulrich et al. 1966; Decin et al. 2007) comes closest to matching the observed colors of MACS0647-JD. However such a large, bright star (M ∼ −4) would need to be well outside the Galaxy (∼ 10 Mpc distant) to be observed at 26th magnitude in F160W (as argued in Dickinson et al. 2000 and Bouwens et al. 2011a for two previous z ∼ 10 candidates). If MACS0647-JD were within the Galaxy (out to ∼10 kpc), 21. http://stev.oapd.inaf.it/trilegal.
(14) Coe et al. 2012. 250. Flux (nJy). 200 150. MACS0647-JD1 (HST) A2667-J1 (VLT) A2667-J1 (HST) 36 Myr E(B-V) = 0.77 mag 2.6 Gyr E(B-V) = 0.14 mag 2.6 Gyr E(B-V) = 0. 100 50 0 50 0.8. 0.9. 1.0 1.1 1.2 1.3 1.4 1.5 1.6 Wavelength ( m). A2667-J1. Probability (normalized). 14. SED fit only with Bayesian prior spectroscopic redshift. without ACS without ACS or Spitzer ch3,4. 0 1 2 3 4 5 6 7 8 9 10 11 12 13 Redshift. Figure 12. Left: comparison of near infrared photometry of lensed J-dropouts MACS0647-JD1 (this work) and A2667-J1 (Laporte et al. 2011; Hayes et al. 2012). Also overplotted are three SED fits from Figure 2 of Hayes et al. (2012) to the photometry of A2667-J1 at its spectroscopic redshift z = 2.082. The Hayes et al. (2012) photometry plotted here is all from VLT (FORS2 and HAWK-I) except for the 6.0-σ detection in HST/ACS F850LP, the upper diamond with a darker border at 0.91µm. Right: photometric redshift probability distribution for A2667-J1 based on our reanalysis of the photometry provided in Hayes et al. (2012) with and without a Bayesian prior. The top panel uses all the available photometry. The middle panel omits the 6.0-σ detection in ACS/F850LP. The bottom panel omits both ACS and Spitzer IRAC ch3 and ch4. The spectroscopic redshift z = 2.082 is indicated by the red vertical lines.. Figure 13. Observed NIR colors of the J-dropouts (red diamonds with 1-σ uncertainties) plotted against those observed for all other 20,746 CLASH sources brighter than 28th magnitude in both F160W and F140W and also observed in F125W (filled circles and density map). The horizontal axis gives the ratio of F160W flux to the maximum flux in all bluer WFC3/IR filters. The vertical axis gives a similar flux ratio but for F140W. Three objects with colors similar to the J-dropouts appear to be spurious IR artifacts based on visual inspection, and we mark these with X’s.. it would have an absolute magnitude of M ∼ +11 or fainter, consistent with a red dwarf in terms of magnitude but not color as shown above. A few red giants in the post-AGB phase have been observed to flare up apparently as the result of a helium burning “thermal pulse” which triggers the ejection of a dust shell. “Sakurai’s object” (Duerbeck & Benetti 1996) and WISE J1810-3305 (Gandhi et al. 2012) do have similar colors to our J-dropouts. But again these are very bright events, observed at 0.34 ± 0.01 Jy and 2.74 ± 0.06 Jy, respectively, in the H-band with 2MASS. Believed to be a few kpc distant, they would need to be removed to several Mpc to be observed at ∼0.1 µJy as our J-. Figure 14. Observed colors in J125 , H160 , and at 4.5µm plotted as black lines (95% confidence contours) versus those observed and predicted for stars and brown dwarfs. Colors derived from stellar spectra observed with IRTF (Cushing et al. 2005; Rayner et al. 2009) are plotted as open magenta circles for dwarfs and open black star symbols for giants and supergiants. Blue error bars are observed photometry (ground-based and WISE) for Y dwarfs (Kirkpatrick et al. 2012). Open black diamonds are post-AGB flare ups with dust ejecta observed with 2MASS and WISE; the upper diamond is “Sakurai’s object” (Duerbeck & Benetti 1996) and the lower diamond is WISE J1810-3305 (Gandhi et al. 2012). Simulated dwarf spectra from Hubeny & Burrows (2007) are plotted as filled circles colored as a function of temperature.. dropouts. These are also rare events, lasting on the order of 100 years (but varying more rapidly), such that only these two have been reported to date. It would be highly unlikely to detect three such events occurring at the same time in the same HST field. 5.4. Solar System Objects?. If the J-dropouts were solar system objects, we would expect to have detected their proper motions in our 6 epochs of F160W/F140W imaging spanning 56 days.
(15) CLASH: Three strongly lensed images of a candidate z ≈ 11 galaxy (Figs. 5 and 6). Only an Oort cloud object at ∼50,000 AU would be orbiting the Sun sufficiently slowly for us not to have detected its motion. But Oort cloud objects are expected to be significantly fainter (∼58th magnitude assuming a diameter of ∼20 km; Sheppard 2010) and have different colors than those observed here. Benecchi et al. (2011) measured HST/NICMOS F110W−F160W colors of 80 Trans-Neptunian Objects and found they have HST F110W−F160W colors clustered around ∼0.6 with none redder than 0.8. For Oort cloud objects to be observed at ∼26th magnitude due to reflected sunlight alone, even with 100% albedo, their radii would have to be ∼1010 m which is larger than the Sun. Oort cloud brown dwarfs emitting thermally would be far brighter than observed and, as discussed in §5.3, have different colors. 5.5. Lensed Supernova?. The J-dropouts do not exhibit any significant temporal variations in brightness either over our 56 days of observations (Fig. 3), ruling out most transient phenomena such as supernovae. However, Type IIP supernovae can plateau to a roughly constant magnitude for ∼100 days (e.g., Arcavi et al. 2012) which we would observe to last ∼100(1 + z) days due to cosmic time dilation (Blondin et al. 2008). A Type Ia supernova at z ∼ 4 would be observed to have magnitudes and colors similar to those observed in HST for MACS0647-JD. A Type IIP plateau supernova would likely be bluer, but could perhaps match the observed HST colors. We would expect to detect it as a bright object at longer wavelengths, but the Spitzer images were obtained 1.5 years earlier, perhaps before the star went supernova. This intriguing scenario is ruled out by the gravitational lens time delays due to MACSJ0647.7+7015, which we estimate to be on the order of 1–10 years between JD1 and JD2 and ∼50 years between these and JD3. Our subset of lens models (§6) which allow for z ∼ 4 also suggest that the intrinsic fluxes of all three images are roughly consistent with one another (at least to within a magnitude). Thus the supernova plateau (several magnitudes brighter than the host galaxy) would have to have lasted 50/(1+z) ∼ 10 years for us to observe it simultaneously in all three images. Even if this were somehow possible, we would then expect to have detected the earlier (least time-delayed) images with Spitzer. 5.6. Emission Line Galaxy?. In principle, an AGN / starburst galaxy with an undetected continuum and two or more extremely strong nebular emission lines redshifted into F140W and F160W could reproduce the observed HST colors. The only plausible configuration is that Hβ (4861Å) and [OIII] (4959Å) are redshifted to within F140W and F160W, while [OIII] (5007Å) is redshifted beyond F140W but within F160W. This is possible for the narrow redshift range 2.20 < z < 2.22. At this redshift, F140W and F160W have restframe widths of ∼1229Å and ∼889Å, respectively. In the case of JD1, we measure the flux blueward of F140W to be −3.4 ± 3.7 nJy. We conservatively adopt < 7.4 nJy as the 2-σ upper limit on the continuum flux. Boosting the F140W flux to the observed ∼63 nJy would require emission lines with a combined equivalent width. 15. EW > 1229 × (63/7.4 − 1) ∼ 9525Å. Similarly, increasing the F160W flux to the observed ∼162 nJy, would require a combined EW > 889×(162/7.4−1) ∼ 19114Å (∼10−15 erg/s/cm2 ). Thus in our configuration assuming a continuum flux of 7.4 nJy: EW(Hβ + [OIII]4959 ) ≈. 9234Å,. (1). 18573Å,. (2). EW([OIII]5007 ) ≈ (2) − (1) ≈. 9339Å,. (3). EW([OIII]4959 ) ≈ (3) / 3 ≈. 3113Å,. (4). 6121Å,. (5). EW(Hβ + [OIII]4959 + [OIII]5007 ) ≈. EW(Hβ). = (1) − (4) ≈. where the line ratio in Equation 4 is dictated by the relative transition probabilities. An [OIII] (5007Å) line with EW > 9000Å would be several times greater than the strongest emission lines observed to date, approaching EW ∼ 2000Å, for [OIII] (5007Å) and Hα (6563Å) (Atek et al. 2011; van der Wel et al. 2011; Shim et al. 2011; Fumagalli et al. 2012). If we consider instead the 5-σ continuum limit of 18.4 nJy, we would still require EW ∼ 3959Å for [OIII] (5007Å) and EW ∼ 1659Å for Hβ. The strongest Hβ lines are robustly predicted to have EW . 800Å even for extremely young stellar populations, according to models like Starburst9922 (Leitherer et al. 1999, 2010). Finally, given such bright lines, one would also expect a significant contribution of [OII] (3727Å) in F110W and F125W, which is not observed. 6. GRAVITATIONAL LENS MODELING. We identified 24 strongly-lensed images of 9 background galaxies (§6.1), used them to derive lens models using three different methods (§6.2), and derived results including magnifications in (§6.3). Importantly, our lens models show that MACS0647-JD1, 2, and 3 are observed in relative positions as expected if they are stronglylensed multiple images of the same galaxy at z ∼ 11. 6.1. Strongly Lensed Multiple Images. Zitrin et al. (2011a) presented a preliminary gravitational lens mass model of the MACSJ0647.7+7015 cluster core based on pre-CLASH HST/ACS F555W+F814W imaging and their identifications of two background galaxies strongly lensed to produce multiple images. Based on CLASH imaging in 15 additional HST filters and additional lens modeling using the Zitrin et al. (2009) method, we have now identified 7 more galaxies which have been multiply imaged, and we have measured robust photometric redshifts for all 9 galaxies. This enables us to model the mass distribution (primarily dark matter) and thus lensing properties in greater detail. In addition to the three images of MACS0647-JD at z ∼ 11, we observe 21 multiple images of 8 background galaxies with photometric redshifts ranging from 2 . z . 6.5 (Table 6 and Fig. 1). The candidate z ∼ 6.5 system is notable in its own right, consisting of two images observed at magnitudes ∼ 26.3 and 27.3 in the NIR. 22. http://www.stsci.edu/science/starburst99/.
(16) 16. Coe et al. 2012. For each of systems 3, 5, and 8, our lens models predict a third faint counterimage, but we cannot unambiguously identify it among several possible candidates. To be conservative, we do not include these uncertain identifications as constraints on our lens models. Inclusion of these candidates does not significantly affect the lens models. In Fig. 1 we indicate the predicted locations of these counterimages.. Table 6 24 Multiple Images of 9 Strongly Lensed Galaxies. ID. 6.2. Strong Lens Modeling Methods. Based on the observed positions of all 24 strongly lensed images, we model the mass of MACSJ0647.7+7015 using three different methods: the Zitrin et al. (2009) method, Lenstool (Kneib et al. 1993; Jullo et al. 2007), and LensPerfect (Coe et al. 2008, 2010). The first two methods are “parametric” in that they assume light traces mass, which has proven to be a very good prior. For example, some of the earliest efforts to model cluster lenses found that assigning masses to individual luminous cluster galaxies significantly improved the reproduction of strongly lensed images (Kassiola et al. 1992; Kneib et al. 1996). LensPerfect makes no assumptions about light tracing mass, exploring a broader range of mass models and perfectly reproducing the observed positions of all multiple images positions as input. The Zitrin et al. (2009) mass model parameterization consists of three components: the cluster galaxies, a smooth cluster halo, and an external shear. Cluster galaxies were identified according to the “red sequence” in F814W-F555W color-magnitude space, then verified with photometric redshifts. Each cluster galaxy was modeled as a power law density profile, its mass scaling with flux observed in F814W. In this work we also allowed the masses of the two brightest central galaxies to vary independently. The cluster halo component was derived from this galaxy component by smoothing the latter with either a polynomial spline or a Gaussian. The two components were allowed to scale independently before being added. In all, there were eight free parameters: the mass scalings of the galaxy and halo components, the masses of the two brightest central galaxies, the power law of the galaxy density profiles, the degree of the polynomial spline or Gaussian smoothing width, and the amplitude and direction of the external shear. The Lenstool model consisted of an ellipsoidal NFW halo (Navarro et al. 1996) plus cluster galaxies modeled as truncated PIEMDs (pseudo-isothermal elliptical mass distributions; Kassiola & Kovner 1993). We assumed core radii rcore = 300 pc and luminosity scaling relations as in Jullo et al. (2007): velocity dispersion σ0 ∝ L1/4 and cutoff radius rcut ∝ L1/2 , resulting in all galaxies having equal mass-to-light ratios. The normalizations of these two scaling relations were free parameters along with the cluster halo position (x, y), ellipticity (e, θ), scale radius, and concentration. There were eight free parameters in all. 6.3. Lens Model Results Given the observed position of any one of the MACS0647-JD images, the Lenstool model accurately predicts and reproduces the positions of the other two images to an RMS of 1.300 , as minimized for z = 11.59+0.12 −1.53 .. JD1 JD2 JD3. 1a b c 2a b c 3a b 4a b c 5a b 6a b c 7a b c 8a b 9a b c. R.A. (J2000.0) 06 06 06 06 06 06 06 06 06 06 06 06 06 06 06 06 06 06 06 06 06 06 06 06. 47 47 47 48 48 47 47 47 47 47 47 47 47 47 47 47 47 47 47 47 47 47 47 47. 51.87 48.54 52.01 00.33 00.33 58.62 53.85 53.41 42.75 42.93 45.37 41.04 41.16 55.74 53.11 55.45 50.91 47.73 48.69 48.61 47.34 43.79 44.98 49.06. Decl. (J2000.0) +70 +70 +70 +70 +70 +70 +70 +70 +70 +70 +70 +70 +70 +70 +70 +70 +70 +70 +70 +70 +70 +70 +70 +70. 15 14 14 15 14 14 14 14 14 14 15 15 14 14 14 15 15 14 14 15 15 15 14 15. 20.9 23.9 53.8 00.7 55.4 21.8 36.2 33.5 57.7 44.5 25.8 05.5 34.4 35.7 22.8 38.0 19.9 23.2 59.8 15.8 12.5 00.4 23.2 37.7. Photometric Redshifta 2.2 ± 0.1 2.2 ± 0.1 2.2 ± 0.1 4.7 ± 0.1 4.7 ± 0.1 4.7 ± 0.1 3.1 ± 0.1 3.1 ± 0.1 1.9 ± 0.1 1.9 ± 0.1 1.9 ± 0.1 6.5 ± 0.15 6.5 ± 0.15 11.0 ± 0.3 11.0 ± 0.3 11.0 ± 0.3 2.2 ± 0.15 2.2 ± 0.15 2.2 ± 0.15 2.3 ± 0.1 2.3 ± 0.1 5.9 ± 0.15 5.9 ± 0.15 5.9 ± 0.15. 1. Joint likelihoods for each system with approximate 68% uncertainties.. This scatter is consistent with the ∼1.400 expected due to lensing by line of sight structures and variation in the mass-to-light ratio of cluster galaxies (Jullo et al. 2010; Host 2012). The lens model and inferred redshift for MACS0647-JD do not change significantly if the MACS0647-JD images are excluded as constraints. In this case, the 8-parameter lens model remains well constrained by the 21 other multiple images which provide 26 constraints (see discussion below). Using the Zitrin et al. (2009) method, two sets of acceptable models are found in different regions of the model parameter space. One set prefers z ∼ 11 for MACS0647-JD, while the other prefers z ∼ 3.5. The latter mass models have flatter profiles. Our LensPerfect analysis confirms this is a degeneracy between the MACS0647-JD redshift and the cluster mass distribution. A wide range of redshifts including z = 3.5, 11.0, and 11.6 is permitted given the strong lensing data. When fixing the redshift to any of these values, LensPerfect produces reasonable lens models (physical and with light approximately tracing mass) which perfectly reproduce all 24 observed positions of the 9 strongly lensed galaxies. When the MACS0647-JD redshift is set lower, the cluster mass distribution is more spread out yielding a flatter profile. We confirm that the parametric models have similar differences, in part due to their parameterizations of the cluster mass distribution. Including the redshift of MACS0647-JD, both parametric models have . 9 free parameters. (This number should be considered a maximum given covariances among the parameters. See discussion in Andrae et al. 2010.) There are 30 constraints = 2 × (24 − 9), where the constraints are the two coordinates (x,y) from each of the 24 multiple images minus the 9 unknown source.
Figure


+7


Documento similar
The filled squares are our candidate cluster members (objects that remained after proper motion analysis).. The squares are our ZJ only candidates for all four fields that
For this respect, different methodologies were used: firstly, the development of three candidate gene pharmacogenetic studies for three drugs with different levels
Seven systems are likely double lensed quasars based on almost indistinguishable spectra between the two candidate images, but a hitherto unidentified lensing galaxy between
32 Institute of High Energy Physics and Informatization, Tbilisi State University, Tbilisi, Georgia.. 33 RWTH Aachen
These two models are then used to calculate the number of SLSNe-I, in bins of ∆z = 0.5 width, centred on multiples of z = 0.5 up to z = 3.5 which is consistent with the highest
We use Lenstool to model the gravitational lensing, which is near to a “fold arc” configuration for an elliptical mass distribution of the central halo, where four images of the
The majority of these objects also have faint counterparts in the Spitzer /IRAC bands, with the measured IRAC to 1.2 mm flux density ratios (Sun et al. 2022 ) pointing toward
Taking into account that the only imposed re- striction by our definition of a d-zoom process Z is given by the knowledge of some sampling values of the zoomed image J = Z(I),
