Lateralized Suppression of Alpha Band EEG Activity As a Mechanism of Target Processing
18
0
0
Texto completo
(2) Bacigalupo and Luck • Lateralized Alpha-Band Suppression As a Mechanism of Visual Attention. J. Neurosci., January 30, 2019 • 39(5):900 –917 • 901. a. b. Figure 1. Example stimuli from the two experiments. a, Experiment 1 task. One color was designated the target color at the beginning of each block and participants were instructed to report whether the target-colored circle had a gap on the top or on the bottom. Target location varied unpredictably from trial to trial. b, Experiment 2 task. One color was designated as the target color at the beginning of each block. Participants were instructed to report whether the middle letter in the set of letters of this color was a vowel or a consonant. The middle letter was always on the horizontal meridian and the flankers could be absent, 1.6° above and below the middle letter, or 0.9° above and below the middle letter. The side containing the target color varied unpredictably from trial to trial.. have led to the view that lateralized changes in alpha-band power reflect a mechanism of preparatory visuospatial attention that improves the processing of subsequent targets and/or suppresses the processing of subsequent distractors. However, there are two reasons to suspect that lateralized alpha-band EEG suppression may not solely reflect preparatory activity and may also reflect active processing of target information. First, alpha power over both hemispheres is suppressed in response to foveal targets (Payne et al., 2013), presumably reflecting active processing of the target, and a lateralization of this effect for peripheral targets might be expected as a result of the contralateral organization of the visual system. Second, van Diepen et al. (2016) used a spatial cuing paradigm and found that both the cue and the target elicited lateralized alpha effects (van Diepen et al., 2016). The present study was designed to determine whether targets elicit lateralized alpha suppression in visual search paradigms in. the absence of spatial precues, which would indicate that this effect can reflect active target processing and is not limited to preparatory processing. In addition, we sought to determine whether this effect represents a unique mechanism of attention that can be dissociated from other lateralized electrophysiological signatures of attention. Specifically, we compared the target-elicited lateralized alpha suppression (TELAS) with the N2pc component of the event-related potential (ERP) waveform. The N2pc component is a well characterized and well validated measure of the allocation of attention to lateralized target stimuli (Luck, 2012; Eimer, 2015). It typically appears as a negative voltage deflection from ⬃150 – 300 ms over the hemisphere contralateral to an attended object within a bilateral stimulus array (Luck and Hillyard, 1994), is mainly generated in ventral stream visual areas (Hopf et al., 2006), and is sensitive to the same experimental manipulations as single-unit activity in macaque homologs of these areas (Luck et al., 1997). To determine whether target-elicited lateralized alpha suppression reflects the same attentional mechanism as the N2pc component, we investigated whether these two effects are influenced in the same manner by two experimental manipulations that are known to modulate N2pc amplitude: the vertical position of the target (Luck et al., 1997) and the distance between the target and the distractors (Bacigalupo and Luck, 2015). If target-elicited lateralized alpha suppression can be experimentally dissociated from the N2pc component, then this would indicate that they represent different attentional mechanisms and presumably play different roles in target processing and/or distractor suppression.. Materials and Methods Methods overview. To evaluate whether alpha lateralization effects play a role in active target processing, we conducted two simplified visual search experiments in which a target and simultaneous distractors were presented without spatial precues (Fig. 1). We expected to find that the lateralized targets would elicit greater suppression of alpha-band EEG activity over the contralateral hemisphere than over the ipsilateral hemisphere. To test whether target-elicited lateralized alpha suppression is a separate attentional marker from the N2pc, both signals were measured and evaluated from the same raw EEG signals on the same trials. In Experiment 1 (Fig. 1a), the vertical position of the target, which is known to modulate N2pc amplitude, was manipulated. In particular, the N2pc is much larger for targets in the lower visual field (VF) than for upper VF targets (Luck et al., 1997) and our goal was to determine whether the same pattern would be observed for target-elicited lateralized alpha suppression. To further evaluate whether target-elicited lateralized alpha suppression and the N2pc are dissociable, Experiment 2 used a crowding para-.
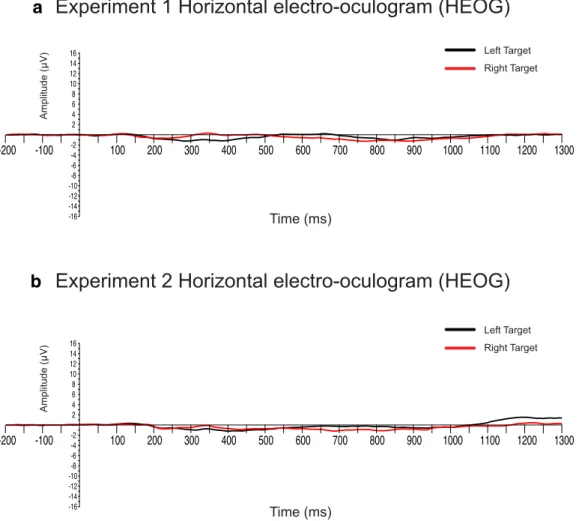
(3) 902 • J. Neurosci., January 30, 2019 • 39(5):900 –917. Bacigalupo and Luck • Lateralized Alpha-Band Suppression As a Mechanism of Visual Attention. a. b. Figure 2. HEOG waveforms (after artifact rejection) for left-side and right-side targets in Experiments 1 (a) and 2 (b). The scale of ⫾16 V reflects a horizontal eye deviation of ⫾1°. Therefore, on average, the residual eye movements were negligible (⬍0.1°). digm in which target– distractor distance was manipulated (Fig. 1b). Previous research has shown that N2pc amplitude is greater at intermediate target-flanker distances compared with both no-flankers and densely crowded conditions (Bacigalupo and Luck, 2015). An unpublished exploratory analysis of the data published in this prior study yielded evidence of the existence of target-elicited lateralized alpha suppression and also suggested that the effects of crowding differed between this effect and the N2pc component. However, the timing parameters used in that study were not ideal for examining alpha-band activity and the observed effects relied on post hoc analyses. The present study was therefore conducted to provide more optimal task parameters using an a priori analysis framework (derived from the post hoc analyses of the previous study), which increases the strength of the conclusions that can be drawn. Participants. A single group of 22 healthy University of California (UC) Davis students (17 females) with no history of neurological or psychiatric conditions participated in both experiments in a single session after providing informed consent. Their ages ranged from 18 to 25 years, with a mean of 20.7 years. This study was approved by the UC Davis Institutional Review Board. As described in more detail below, we always exclude participants for whom ⬎25% of trials are rejected because of artifacts (Luck, 2014). One participant exceeded this threshold in both experiments and this individual was excluded from all analyses. Experiment 1 stimuli and task. The stimuli used in Experiment 1 are illustrated in Figure 1a. The participants were seated 100 cm from an LCD monitor with a black background and a 60 Hz refresh rate. An empirically optimal fixation cross drawn in black and subtending 0.65° was continuously visible in the center of the display (Thaler et al., 2013).. A photodiode was used to measure the delay of the monitor at each stimulus location. Before all signal processing and analyses, the stimulus event codes were shifted to reflect the true stimulus onset time at the location of the target. The stimuli consisted of two columns of three vertically arranged circles (1.3° diameter) centered 7.6° to the left and right sides of the vertical midline (Fig. 1a). The center-to-center distance between the middle circles and the top and bottom circles in each column was 4.6°. Stimulus luminance was 32 cd/m 2. The middle circle in each column was gray and had a 0.4° square gap either on the left or right side. The upper and lower circles in each array were selected at random without replacement on each trial from the colors blue, green, red, or yellow and had a 0.4° square gap either on the top or bottom. The middle circles were never targets and were included to provide competing nearby stimuli for the top and bottom circles, which maximizes N2pc amplitude (Luck et al., 1997; Bacigalupo and Luck, 2015). The task was divided into eight blocks—two per target color—and each block consisted of 72 trials. The target color was specified at the beginning of each block and participants were instructed to report whether the target-colored circle had a gap on top or bottom by pressing one of two buttons on a game pad with the dominant hand (index finger for upper gap; middle finger for lower gap). The stimulus duration was 200 ms and the stimulus onset asynchrony (SOA) varied randomly between 3000 and 3300 ms. Note that this SOA was longer than is typical for an N2pc experiment, which is helpful for performing time–frequency (TF) analyses. Experiment 2 stimuli and task. For Experiment 2, the stimuli consisted of two arrays of three vertically oriented letters in Times New Roman typeface (Fig. 1b). Each letter subtended 0.8° vertically and was centered 9.2° to the left or right of the vertical meridian. Stimulus luminance was.
(4) Bacigalupo and Luck • Lateralized Alpha-Band Suppression As a Mechanism of Visual Attention. J. Neurosci., January 30, 2019 • 39(5):900 –917 • 903. Hz after application of a cascaded integratorcomb antialiasing filter with a half-power cutoff at 260 Hz. Electrode impedances were kept a below 80 K⍀. After acquisition, all data analyses were performed in MATLAB using EEGLAB Toolbox (Delorme and Makeig, 2004), ERPLAB Toolbox (Lopez-Calderon and Luck, 2014), and FieldTrip (Oostenveld et al., 2011). The signals were resampled offline to 250 Hz, referenced to the average of the two mastoid electrodes, and high-pass filtered using a noncausal Butterworth filter (half-amplitude cutoff ⫽ 0.1 Hz, slope ⫽ 12 dB/octave). Before artifact correction, the horizontal EOG (HEOG) was computed as the difference between the electrodes lateral to each eye and the vertical EOG (VEOG) was computed as the difference between the electrode below the right eye and the Fp2 electrode. To correct for eye blinks and horizontal eye movements, independent component analysis (ICA) was applied using EEGLAB’s BINICA routine using all electrodes except for the mastoid electrodes and the previously computed HEOG and b VEOG channels. The criterion for excluding an ICA component was the consistency between the shape, timing, and spatial location of the component compared with the HEOG and VEOG signals. For eye blinks, one or two components were identified per subject; for horizontal eye movements, one component was identified in each participant. The data for each channel (excluding the HEOG and VEOG channels) were then reconstructed from the other ICA components. By maintaining the uncorrected HEOG and VEOG channels, it was possible to reject individual trials in which blinks or eye movements occurred during a time period in which they might have changed the sensory input (Luck, 2014). Individual trials were rejected if the behavioral response was incorrect, if the peak-topeak voltage was ⬎200 V in any 200 ms Figure 3. Mean correct response rate (a) and mean RT (b) for Experiment 1. *p ⬍ 0.05. Error bars indicate the within-subjects window in any electrode, or if a blink or eye movement (defined as a step-like voltage SEM. change; see Luck, 2014) was detected in the uncorrected HEOG signal between 100 and 600 ms poststimulus or in the VEOG signal be32 cd /m 2. The letters on one side were red and the letters on the other tween 200 ms prestimulus and 400 ms poststimulus. The average residual side were green (varied unpredictably across trials). Each letter was raneye movements in the uncorrected HEOG signal were ⬍3.2 V for all domly selected without replacement on each trial from a group of five conditions, which corresponds to an eye rotation of less than ⫾0.1° with vowels (A, E, I, O, U) and five consonants (N, F, L, G, J). an estimated voltage propagation of ⬍0.1 V at the posterior scalp sites The session was divided into eight blocks of 72 trials. One color was (Lins et al., 1993). Figure 2 shows HEOG waveforms (after artifact rejecdesignated as the attended color at the beginning of each block. Particition) for left-side and right-side targets in each experiment, demonstratpants were instructed to report whether the middle letter in the set of ing that any residual eye movements were negligible. letters of this color was a vowel or a consonant by pressing one of two More than 25% of trials were rejected because of artifacts in one parbuttons on a gamepad. The target color changed on every block. The ticipant and this participant was therefore excluded from the analyses of middle letter was always on the horizontal meridian, and there were three both experiments. For the 21 remaining participants, the average perlevels of crowding between this letter and the other letters (the flankers): centage of rejected trials was 9.3% (range ⫽ 0.7–25%) in Experiment 1 (1) no flankers, (2) flanker letters centered 1.6° above and below the and 6.4% (range ⫽ 0.2–21.9%) in Experiment 2. Identical EEG data middle letter, and (3) flanker letters centered 0.9° above and below the epochs were used for the N2pc and alpha analyses. middle letter. ERP analyses. Averaged ERP waveforms were computed with a 3000 Electrophysiological recordings. The EEG was recorded using a Brain ms epoch starting 1500 ms before and ending 1500 ms after stimulus Products actiCHamp system with electrodes located over the left and onset. The ERP measurements were performed using a 200 ms preright mastoid processes and at 27 standard scalp locations (FP1, FP2, F3, stimulus baseline. A low-pass filter (half-amplitude cutoff ⫽ 30 Hz, F4, F7, F8, C3, C4, P3, P4, P5, P6, P7, P8, P9, P10, PO3, PO4, PO7, PO8, slope ⫽ 12 dB/octave) was applied after averaging for plotting O1, O2, Fz, Cz, Pz, POz, and Oz). The horizontal and vertical EOG purposes. signals were measured from electrodes located ⬃1 cm lateral to the outer The N2pc ERP component was computed as the average amplitude canthi of each eye and from an electrode placed below the right eye. from contralateral-minus-ipsilateral difference waves relative to the side All signals were recorded in single-ended mode and digitized at 1000.
(5) Bacigalupo and Luck • Lateralized Alpha-Band Suppression As a Mechanism of Visual Attention. 904 • J. Neurosci., January 30, 2019 • 39(5):900 –917. a. b. c. d. Figure 4. Grand average ERPs from Experiment 1. Contralateral and ipsilateral ERP waveforms are shown for targets in the upper VF (a) and lower VF (b). c, Contralateral-minus-ipsilateral difference waves. d, Mean N2pc amplitude measured from the difference waves. Error bars indicate the within-subjects SEM. #p ⬍ 0.05 for difference from zero. *p ⬍ 0.05 for comparison of upper and lower VFs. of the target at the PO3 and PO4 electrode sites. These sites were chosen a priori on the basis of our previous crowding study (Bacigalupo and Luck, 2015). To avoid biases in selecting the time period for analysis, we used the “collapsed localizer” approach to determine the measurement window (Luck and Gaspelin, 2017). Specifically, we computed a contralateral-minus-ipsilateral difference wave that was averaged across all experimental conditions and all participants and the measurement window was defined as the onset and offset of the N2pc in this averaged difference wave (the latencies at which the voltage reached 15% of the peak amplitude). This procedure resulted in a measurement. window of 156 –276 ms in Experiment 1 and 132–252 ms in Experiment 2. Mean N2pc amplitude was then measured in these time windows for each individual condition in the single-participant difference waveforms. TF analyses. TF analyses were performed on the same 3000 ms EEG epochs used for the ERP analyses. The frequency representation of the EEG data was obtained through convolution in the time domain using Morlet wavelets from 2–30 Hz (in steps of 1 Hz) and a Gaussian taper, with analysis windows centered every 50 ms (Spaak et al., 2014). Because our main goal was to compare the N2pc component with alpha-band.
(6) Bacigalupo and Luck • Lateralized Alpha-Band Suppression As a Mechanism of Visual Attention. J. Neurosci., January 30, 2019 • 39(5):900 –917 • 905. a. b. Figure 5. Topographic plots of the averaged ERP during the N2pc window for left and right targets and for the contralateral-minus-ipsilateral difference for upper VF (a) and lower VF (b) targets. Given the way the data are combined to derive the N2pc component, the left and right hemispheres are necessarily mirror images. The typical occipitotemporal N2pc scalp distribution was observed for the lower VF (b, right), but little or no contralaterality was observed for the upper VF target condition (a, right). suppression, temporal resolution was more important than frequency resolution, so we used three-cycle wavelets (as in van Diepen et al., 2016). At 10 Hz, the temporal precision was 48 ms and the frequency precision was 3.3 Hz (quantified as the SD in time or frequency). To compute induced power, the averaged ERP waveform was subtracted from the single-trial EEG signals for each experimental condition. The TF transform was then computed from the single-trial signals and the transformed data were averaged across trials for each specific time point and frequency. After induced power (IP) was calculated, the data were normalized according to a decibel scale using the following equation (modified from Grandchamp and Delorme, 2011):. IP log 共f,t 兲 ⫽ 10log 10 共 IP % 共f,t 兲兲. IP共f,t兲 and B共f 兲 is the mean spectral estimate B共f 兲 for all baseline points at frequency f using a prestimulus baseline period starting 300 ms before stimulus onset (Grandchamp and Delorme, 2011). We used a slightly longer baseline for the TF analysis than for the ERP analysis to account for the width of the where IP% 共f,t兲 ⫽. Morlet wavelet at 10 Hz (⬃300 ms). Alpha-band power was computed by averaging the power across an a priori frequency band of 8 –12 Hz. Lateralized alpha-band power was calculated by subtracting the ipsilateral power from the contralateral power (relative to the side of the target) at the PO3 and PO4 electrode sites. These sites were chosen a priori to match the sites used for the N2pc analyses, but they were also the lateralized sites with greatest alpha suppression effects (see Figs. 6, 7, 8, 12, 13, 14). To compare the N2pc with the alpha-band activity across the different experimental conditions, the time window used for measuring the N2pc amplitude was also used for measuring alpha-band power (156 –276 ms and 132–252 ms after stimulus onset for Experiments 1 and 2, respectively). However, to further characterize the timing of the alpha-band effects, additional analyses were also conducted using the mean alpha-band power from three additional time windows (selected on the basis of a preliminary analysis of the similar study of Bacigalupo and Luck, 2015):.
(7) 906 • J. Neurosci., January 30, 2019 • 39(5):900 –917. Bacigalupo and Luck • Lateralized Alpha-Band Suppression As a Mechanism of Visual Attention. a. b. c. Figure 6. Grand average TF plots from Experiment 1. a, Upper VF targets that elicited approximately equivalent suppression of alpha-band power for both contralateral and ipsilateral electrodes relative to the target location (a.3). b, Lower-field targets, which elicited greater alpha-band suppression over the contralateral hemisphere (b.3). The white region at the bottom right corner of the plots indicates values that are undefined given the epoch length and wavelet duration. c, Time course of the contralateral-minus-ipsilateral difference in alpha-band power.. (1) early (200 – 600 ms), (2) middle (600 –900 ms), and (3) late (900 –1200 ms). Statistical analyses. Paired t tests and repeated-measures ANOVAs (alpha ⫽ 0.05) were computed using R statistical software version 3.3.0. (R Development Core Team, 2013). Onesample t tests were used when N2pc amplitude or lateralized alpha power from a single condition was being compared with zero. The Pearson r correlation coefficient was used to assess the association between alpha, the N2pc, and behavioral [reaction time (RT) and correct response rate] measurements.. Results Experiment 1 behavior As shown in Figure 3a, accuracy in Experiment 1 was near ceiling (98%) and did not differ between upper VF and lower VF targets (t(20) ⫽ 0.6, p ⫽ 0.55). RTs were slightly but significantly faster for upper VF targets (mean ⫽ 612, SEM ⫽ 16.6 ms) than for lower VF targets (mean ⫽ 626, SEM ⫽ 18 ms; t(20) ⫽ 3.9, p ⬍ 0.001; Fig. 3b). Previous studies have also reported faster RTs for visual. search targets located in the upper VF (Previc and Blume, 1993; Gunter et al., 1994). According to Previc (1990), this upper VF attentional facilitation may reflect the extrapersonal system of visual attention that is involved in visual search and depends on the integrity of the inferior temporal cortex. In contrast, the peripersonal system of visual attention is biased toward the lower VF is involved in reaching and visuomotor activities and is disrupted by parietal cortex lesions (Previc, 1990). Experiment 1 ERPs As shown in Figure 4, the ERP waveform was more negative (less positive) over the hemisphere contralateral to the target than the hemisphere ipsilateral to the target during the N2pc measurement window (156 –276 ms) for lower VF targets. However, this effect was largely absent for upper VF targets. The N2pc was isolated from the rest of the ERP waveform by means of contralateral-minus-ipsilateral difference waves (Fig. 4c), which show a clear negative deflection peaking at ⬃225 ms for the lower VF target. As is commonly observed, the N2pc declined in ampli-.
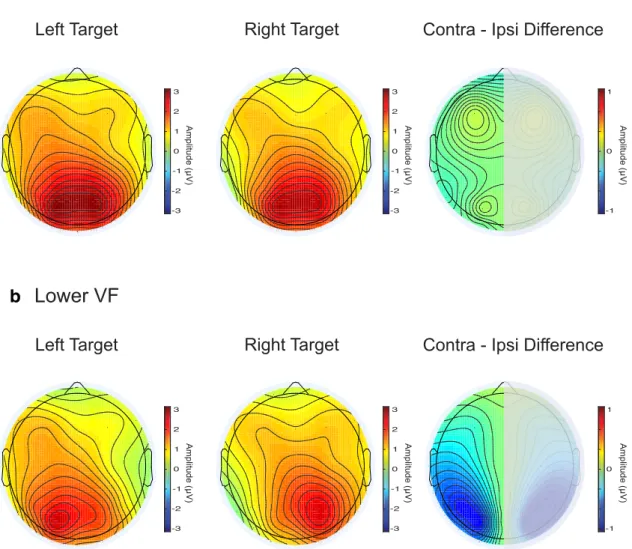
(8) Bacigalupo and Luck • Lateralized Alpha-Band Suppression As a Mechanism of Visual Attention. J. Neurosci., January 30, 2019 • 39(5):900 –917 • 907. a. b. Figure 7. Topographic plots of induced alpha band (8 –12 Hz) activity during the N2pc time window for left and right targets and for the contralateral-minus-ipsilateral difference for upper VF (a) and lower VF (b) targets. A lateralization effect was observed for lower VF targets (b, right), but not for upper VF targets (a, right).. tude from ⬃250 –350 ms and this was followed by a sustained negativity (the sustained posterior contralateral negativity or SPCN) (Maheux and Jolicœur, 2017). Another negativity was also present very late from ⬃700 –1200 ms. By contrast, upper VF targets elicited very little contralateral negativity but did elicit a contralateral positivity from ⬃250 –350 ms. This positivity may reflect the distractor positivity (PD) component that often follows N2pc (Sawaki et al., 2012), which would suggest that PD and N2pc are differentially sensitive to the vertical position of the relevant stimulus. The pattern of N2pc differences between upper and lower VF targets is quite similar to what has been observed previously (Luck et al., 1997). The topographic distribution of the ERP during the N2pc time window is shown in Figure 5, in which lateralization effects can be seen for lower VF but not for upper VF targets. To provide statistical support for the observed N2pc effects, we conducted a priori statistical tests on the mean voltage from 156 –276 ms in the contralateral-minus-ipsilateral difference waves. N2pc amplitude was significantly greater for lower VF targets than for upper VF targets (t(20) ⫽ 4.42, p ⬍ 0.001). In addition, N2pc amplitude was significantly greater than zero for. lower VF targets (t(20) ⫽ ⫺5.28, p ⬍ 0.001), but not for upper VF targets (t(20) ⫽ ⫺0.25, p ⫽ 0.8). Experiment 1 TF analysis Figure 6 provides TF plots along with waveforms showing the time course of activity averaged across the alpha-band frequency range (8 –12 Hz). As commonly observed, alpha-band power was suppressed (relative to the pre-stimulus level) from ⬃200 – 600 ms after the appearance of the target. This suppression was observed over both contralateral and ipsilateral scalp sites for both upper VF and lower VF targets, and Figures 7 and 8 show that this effect had an occipitotemporal topographic scalp distribution. The suppression effect was distributed over a wide band of frequencies (⬃7–20 Hz), but this may reflect the relatively poor frequency resolution of the 3-cycle wavelet that we used to optimize the temporal resolution of the analyses. However, the effect was clearly strongest in the alpha band (8 –12 Hz). Although strong alpha-band suppression could be observed over both hemispheres, it was greater over the contralateral hemisphere than over the ipsilateral hemisphere from ⬃200 ms until the end of the epoch for the lower VF targets. This can be seen.
(9) 908 • J. Neurosci., January 30, 2019 • 39(5):900 –917. Bacigalupo and Luck • Lateralized Alpha-Band Suppression As a Mechanism of Visual Attention. a. b. Figure 8. Topographic plots of induced alpha band (8 –12 Hz) activity during a longer time window (200 –1200 ms) for left and right targets and for the contralateral-minus-ipsilateral difference for upper VF (a) and lower VF (b) targets. A lateralization effect was observed for lower VF targets (b, right) but not for upper VF targets (a, right).. most readily in the contralateral-minus-ipsilateral TF plots (Figs. 6b, right column), in the alpha-band time course waveforms (Fig. 6c), and in the contralateral-minus-ipsilateral scalp maps (Figs. 7b, 8b, right columns). No such contralaterality was visible for the upper VF targets. Note that the very early start time of the effect may reflect the loss of temporal information that necessarily occurs in a TF transform. Note also that, although the maximum effect was present at the same electrode sites as the N2pc (Fig. 5b), the alpha lateralization effect was more narrowly focused over posterior sites than was the N2pc. To provide statistical support for the observed alpha lateralization effect, we performed an a priori statistical analysis of the mean power in the 8 –12 Hz band using the same time window in which the N2pc component was present (156 –276 ms poststimulus). To quantify the amount of contralaterality, we measured the difference in power between the contralateral and ipsilateral hemispheres (relative to the target location). We found that the contralaterality of the alpha power was significantly greater for the lower VF targets than for the upper VF targets (t(20) ⫽ 2.42, p ⫽ 0.025).. Additional analyses of the other measurement windows indicated that the contralaterality was significantly greater for lower VF targets than for upper VF targets in all time windows (200 – 600 ms: t(20) ⫽ 3.99, p ⬍ 0.001; 600 –900 ms: t(20) ⫽ 2.77, p ⫽ 0.011; 900 –1200 ms: t(20) ⫽ 2.11, p ⫽ 0.047). One-sample t tests showed that alpha-band contralaterality was significantly greater than zero for lower VF targets in all time windows (156 –276 ms: t(20) ⫽ ⫺2.28, p ⫽ 0.033; 200 – 600 ms: t(20) ⫽ ⫺4.13, p ⬍ 0.001; 600 –900 ms: t(20) ⫽ ⫺3.45, p ⬍ 0.01; 900 –1200 ms: t(20) ⫽ ⫺2.17, p ⫽ 0.041). For upper VF targets, there were no statistically significant differences from zero in any of the measurement windows (156 –276 ms: t(20) ⫽ 1.53, p ⫽ 0.14; 200 – 600 ms: t(20) ⫽ ⫺0.52, p ⫽ 0.6; 600 –900 ms: t(20) ⫽ 0.4, p ⫽ 0.69; 900 –1200 ms: t(20) ⫽ 0.85, p ⫽ 0.4). Together, the results of this experiment show that visual search targets trigger a contralaterally larger suppression of alpha-band power. Therefore, lateralization of alpha-band activity with respect to the attended location is not limited to spatial precuing paradigms, suggesting that the underlying neural process may be used for active target processing as well as preparatory processing. This target-.
(10) Bacigalupo and Luck • Lateralized Alpha-Band Suppression As a Mechanism of Visual Attention. a. J. Neurosci., January 30, 2019 • 39(5):900 –917 • 909. more crowded. This resulted in a statistically significant main effect of distance in a one-way repeated-measures ANOVA (F(2,40) ⫽ 143.6, p ⬍ 0.001) and post hoc comparisons indicated significant differences among each of the three conditions (all p ⬍ 0.001). RTs showed the complementary pattern, becoming longer as the targetflanker distance decreased (Fig. 9b). The main effect of distance on RT was statistically significant (F(2,40) ⫽ 32.3, p ⬍ 0.001) and post hoc comparisons again indicated significant differences among each of the three conditions (all p ⬍ 0.001).. Experiment 2 ERPs As shown in Figure 10, the voltage was more negative over the hemisphere contralateral to the target than the ipsilateral hemisphere during the N2pc measurement window (132–252 ms) for the 1.6° flanker distance but not for the 0.9° flanker distance or the no-flanker condition. This non-monotonic pattern of b N2pc amplitude exactly replicates our previous study of the effects of crowding on the N2pc component (Bacigalupo and Luck, 2015). As in Experiment 1, the N2pc was followed by two periods of sustained negative potential, one from ⬃300 – 600 ms and another from ⬃700 –1200 ms. A repeated-measures ANOVA showed that differences in N2pc amplitude among the three trial types were statistically significant (F(2,40) ⫽ 5.9, p ⫽ 0.005) and post hoc Tukey comparisons indicated that N2pc amplitude was significantly greater for the 1.6° distance than for both the 0.9° distance and the no-flankers trials (all p ⬍ 0.05). One-sample t tests comparing the average amplitude to zero for each distance indicated that N2pc amplitude was Figure 9. Mean correct response rate (a) and RT (b) for Experiment 2. This is a typical pattern showing decreased accuracy and significantly different from zero only for longer RT for the most crowded conditions. Error bars indicate the within-subjects SEM. *p ⬍ 0.05 for pairwise comparison. the 1.6° distance (t(20) ⫽ ⫺3.83, p ⫽ 0.001). Figure 11 shows that the N2pc at elicited lateralized alpha suppression was similar to the N2pc comthis distance had the typical occipitotemporal scalp distribution. ponent in two main ways. First, the time period of the alpha-band activity overlapped with the time period of the N2pc component. Experiment 2 TF analysis Second, both the N2pc and the contralateral alpha-band suppresAs in Experiment 1, poststimulus alpha-band power decreased sion were observed primarily for lower VF targets. However, the relative to the pre-stimulus period from ⬃200 – 600 ms for all alpha suppression was much longer in duration than the N2pc comthree flanker conditions at both ipsilateral and contralateral scalp ponent. The N2pc was quite brief, although it was followed by 12). The contralateral-minus-ipsilateral subtraction sites (Fig. two later periods of negative potential, whereas the lateralized showed that the lateralization effect had an occipitotemporal alpha-band suppression was present from ⬃100 ms until the scalp distribution (Figs. 13, 14). As in the lower VF target condiend of the epoch. Overall, these results suggest that the N2pc tion of Experiment 1, this effect was stronger over the contralatcomponent and lateralized alpha-band suppression are closely reeral hemisphere than over the ipsilateral hemisphere (relative to lated but separable processes. Experiment 2 was designed to deterthe target) and this contralaterality was greatest in the most mine whether these processes could be further separated. crowded condition (0.9°). The differences among the three conditions were marginally significant for the 200 – 600 ms time winExperiment 2 behavior dow (F(2,40) ⫽ 2.95, p ⫽ 0.063) and did not approach significance As shown in Figure 9a, behavioral accuracy was above 90% on no-flankers trials and decreased steeply as the stimuli became for any of the other time windows (132–252 ms: F(2,40) ⫽ 0.85,.
(11) Bacigalupo and Luck • Lateralized Alpha-Band Suppression As a Mechanism of Visual Attention. 910 • J. Neurosci., January 30, 2019 • 39(5):900 –917. a. b. c. d. e. Figure 10. Experiment 2 grand-averaged ERPs. Contralateral and ipsilateral ERP waveforms are shown for the no-flankers condition (a), 1.6° condition (b), and 0.9° condition (c). d, Contralateralminus-ipsilateral difference waves. e, Bar plots for the N2pc time window. Error bars indicate the within-subjects SEM. #p ⬍ 0.05 for one-sample t test against zero. *p ⬍ 0.05 for pairwise comparison. There was a significant N2pc effect only for the 1.6° condition..
(12) Bacigalupo and Luck • Lateralized Alpha-Band Suppression As a Mechanism of Visual Attention. J. Neurosci., January 30, 2019 • 39(5):900 –917 • 911. a. b. c. Figure 11. Topographic plots of the averaged ERP during the N2pc time window for left and right targets and for the contralateral-minus-ipsilateral difference for the no-flankers condition (a), 1.6° condition (b), and 0.9° condition (c). The N2pc showed a typical occipitotemporal distribution for the 1.6° condition.. p ⫽ 0.43; 600 –900 ms: F(2,40) ⫽ 0.97, p ⫽ 0.38; and 900 –1200 ms: F(2,40) ⫽ 1.02, p ⫽ 0.36). Further lateralization analyses comparing the contralateralminus-ipsilateral difference to zero in each condition indicated that the contralaterality was significant for the 0.9° distance in all time windows for the 1.6° distance during the 600 –900 ms window and for the no-flankers condition during all time windows except for the earliest measurement window (0.9° ⫽ 132–252 ms: t(20) ⫽ ⫺2.31, p ⫽ 0.031; 200 – 600 ms: t(20) ⫽ ⫺4.78, p ⬍ 0.001;. 600 –900 ms: t(20) ⫽ ⫺3.89, p ⬍ 0.001; 900 –1200 ms: t(20) ⫽ ⫺2.51, p ⫽ 0.021; 1.6° ⫽ 132–252 ms: t(20) ⫽ ⫺1.43, p ⫽ 0.16; 200 – 600 ms: t(20) ⫽ ⫺1.77, p ⫽ 0.091; 600 –900 ms: t(20) ⫽ ⫺2.84, p ⫽ 0.01; 900 –1200 ms: t(20) ⫽ ⫺1.52, p ⫽ 0.14; NoFlankers ⫽ 132–252 ms: t(20) ⫽ ⫺1.75, p ⫽ 0.094; 200 – 600 ms: t(20) ⫽ ⫺3.69, p ⬍ 0.01; 600 –900 ms: t(20) ⫽ ⫺2.98, p ⬍ 0.01; 900 –1200 ms: t(20) ⫽ ⫺2.65, p ⫽ 0.015). Therefore, the effects of flanker distance for the target-elicited alpha-band lateralization were quite different from the effects observed for the N2pc component..
(13) 912 • J. Neurosci., January 30, 2019 • 39(5):900 –917. Bacigalupo and Luck • Lateralized Alpha-Band Suppression As a Mechanism of Visual Attention. a. b. c. d. Figure 12. Grand-average TF plots from Experiment 2. Shown are contralateral, ipsilateral, and contralateral-minus-ipsilateral differences for the no-flankers condition (a), 1.6° condition (b), and 0.9° conditions (c). Target processing elicited greater alpha-band suppression over the contralateral hemisphere (right panels). The white region at the bottom right corner of the plots indicates values that are undefined given the epoch length and wavelet duration. d, Time course of the contralateral-minus-ipsilateral difference in alpha-band power.. Correlational analyses for Experiments 1 and 2 We conducted a set of focused correlational analyses to determine whether the magnitude of the contralateral alpha-band suppression was associated with the magnitude of the N2pc component in each experiment. We also conducted a set of exploratory correlational analyses to examine associations between the alpha effect and the behavioral measures. Note, however, that our sample size (N ⫽ 21) was not sufficient to yield high levels of power for detecting correlations. With this sample size, the power. to detect a moderate correlation of r ⫽ 0.4 is only 0.45 (as indicated by G*Power; Faul et al., 2007). Moreover, because these analyses were largely exploratory, no correction for multiple comparisons was performed. Table 1 shows the correlations observed between the alpha-band effect (contralateral minus ipsilateral) in each of the time windows and the other variables (N2pc amplitude, RT, accuracy) for each condition in each of the two experiments. When considering the sign of the correlations, keep in mind that both the N2pc and the lateralized.
(14) Bacigalupo and Luck • Lateralized Alpha-Band Suppression As a Mechanism of Visual Attention. J. Neurosci., January 30, 2019 • 39(5):900 –917 • 913. a. b. c. Figure 13. Topographic plots of induced alpha band (8 –12 Hz) activity during the N2pc time window for left and right targets and for the contralateral-minus-ipsilateral difference for the no-flankers condition (a), 1.6° condition (b), and 0.9° condition (c). Unlike the N2pc component, greater contralaterality was observed for the most crowded condition (c, right).. alpha suppression effects become more negative when they are larger. When alpha-band activity and the N2pc component were both measured during the N2pc time window, the only significant correlation between them occurred in the most crowded condition of Experiment 2. The correlation was negative, indicating that the lateralized alpha-band suppression was greater in participants with smaller N2pc amplitudes in this condition. This is consistent with the possibility that the alpha-band activity is related to effort: participants who were unable to deploy the. N2pc-related attentional mechanism in this condition may have found this condition to be more difficult, yielding a greater alphaband effect. However, a replication with a larger sample size would be necessary before strong conclusions could be drawn from this correlation. When alpha-band activity was measured in the 200 – 600 ms interval, we found a significant negative correlation with N2pc amplitude for the upper VF stimuli in Experiment 1. The alphaband contralaterality in the 600 –900 and 900 –1200 ms time windows was also significantly positively correlated with RT for these.
(15) 914 • J. Neurosci., January 30, 2019 • 39(5):900 –917. Bacigalupo and Luck • Lateralized Alpha-Band Suppression As a Mechanism of Visual Attention. a. b. c. Figure 14. Topographic plots of induced alpha band (8 –12 Hz) activity during a longer time window (200 –1200 ms) for left and right targets and for the contralateral-minus-ipsilateral difference for the no-flankers condition (a), 1.6° condition (b), and 0.9° condition (c). Unlike the N2pc component, greater contralaterality was observed for the most crowded condition (c, right).. stimuli. However, given that neither the N2pc nor the alpha-band contralaterality was significantly different from zero for these stimuli, the meaning of these correlations is unclear. Significant positive correlations were also observed between alpha-band contralaterality in the 200 – 600 and 900 –1200 ms time windows and behavioral accuracy for the no-flanker trials in Experiment 2. However, the correlations were not significant for the other trial types or for the other time windows. Again, it would be important to assess. the replicability of these results using a larger sample size before attempting to draw any conclusions from these correlations.. Discussion The present experiments demonstrate that visual search targets elicit a suppression of alpha-band EEG activity that is greater over the hemisphere contralateral to the target, indicating that alpha lateralization plays a role in target processing and does not solely.
(16) Bacigalupo and Luck • Lateralized Alpha-Band Suppression As a Mechanism of Visual Attention. J. Neurosci., January 30, 2019 • 39(5):900 –917 • 915. Table 1. Correlations between alpha-band (8 –12 Hz) power measured at different time windows with the N2pc and behavioral measures (RT and CR) for Experiment 1 and Experiment 2 Experiment 1 Upper VF target RT Correct response rate N2pc Lower VF target RT Correct response rate N2pc. Experiment 2 No flankers RT Correct response rate N2pc 1.6° RT Correct response rate N2pc 0.9° RT Correct response rate N2pc. Alpha 156 –276 ms. Alpha 200 – 600 ms. Alpha 600 –900 ms. Alpha 900 –1200 ms. r ⫽ 0.22 ( p ⫽ 0.33) r ⫽ ⫺0.26 ( p ⫽ 0.24) r ⫽ 0.18 ( p ⫽ 0.43). r ⫽ 0.38 ( p ⫽ 0.08) r ⫽ ⫺0.09 ( p ⫽ 0.68) r ⫽ ⫺0.44 ( p ⫽ 0.046)*. r ⫽ 0.63 ( p ⫽ 0.002)* r ⫽ ⫺0.18 ( p ⫽ 0.42) r ⫽ ⫺0.16 ( p ⫽ 0.48). r ⫽ 0.43 ( p ⫽ 0.05)* r ⫽ ⫺0.15 ( p ⫽ 0.5) r ⫽ ⫺0.1 ( p ⫽ 0.63). r ⫽ ⫺0.3 ( p ⫽ 0.62) r ⫽ 0.11 ( p ⫽ 0.62) r ⫽ 0.16 ( p ⫽ 0.47). r ⫽ 0.18 ( p ⫽ 0.42) r ⫽ 0.04 ( p ⫽ 0.85) r ⫽ 0.39 ( p ⫽ 0.074). r ⫽ ⫺0.1 ( p ⫽ 0.66) r ⫽ ⫺0.11 ( p ⫽ 0.63) r ⫽ 0.16 ( p ⫽ 0.47). r ⫽ ⫺0.12 ( p ⫽ 0.6) r ⫽ ⫺0.18 ( p ⫽ 0.41) r ⫽ 0.11 ( p ⫽ 0.64). Alpha 132–252 ms. Alpha 200 – 600 ms. Alpha 600 –900 ms. Alpha 900 –1200 ms. r ⫽ 0.04 ( p ⫽ 0.84) r ⫽ 0.35 ( p ⫽ 0.11) r ⫽ 0.23 ( p ⫽ 0.31). r ⫽ 0.23 ( p ⫽ 0.32) r ⫽ 0.43 ( p ⫽ 0.048)* r ⫽ ⫺0.035 ( p ⫽ 0.87). r ⫽ ⫺0.03 ( p ⫽ 0.87) r ⫽ 0.29 ( p ⫽ 0.18) r ⫽ 0.03 ( p ⫽ 0.87). r ⫽ ⫺0.042 ( p ⫽ 0.85) r ⫽ 0.56 ( p ⫽ 0.007)* r ⫽ 0.1 ( p ⫽ 0.65). r ⫽ 0.22 ( p ⫽ 0.32) r ⫽ 0.01 ( p ⫽ 0.96) r ⫽ ⫺0.019 ( p ⫽ 0.93). r ⫽ 0.13 ( p ⫽ 0.55) r ⫽ 0.05 ( p ⫽ 0.82) r ⫽ 0.13 ( p ⫽ 0.56). r ⫽ 0.084 ( p ⫽ 0.71) r ⫽ 0.23 ( p ⫽ 0.29) r ⫽ 0.14 ( p ⫽ 0.52). r ⫽ ⫺0.16 ( p ⫽ 0.49) r ⫽ 0.22 ( p ⫽ 0.33) r ⫽ 0.06 ( p ⫽ 0.79). r ⫽ ⫺0.28 ( p ⫽ 0.21) r ⫽ 0.13 ( p ⫽ 0.56) r ⫽ ⫺0.56 ( p ⫽ 0.008)*. r ⫽ ⫺0.05 ( p ⫽ 0.81) r ⫽ 0.24 ( p ⫽ 0.28) r ⫽ ⫺0.09 ( p ⫽ 0.69). r ⫽ 0.06 ( p ⫽ 0.79) r ⫽ 0.25 ( p ⫽ 0.27) r ⫽ ⫺0.14 ( p ⫽ 0.54). r ⫽ ⫺0.23 ( p ⫽ 0.3) r ⫽ 0.2 ( p ⫽ 0.36) r ⫽ ⫺0.08 ( p ⫽ 0.71). *p ⬍ 0.05.. reflect preparatory processes. Furthermore, we found clear evidence that TELAS can be dissociated from the N2pc ERP component in terms of timing and the effects of crowding, indicating that these two lateralized scalp signals reflect separate mechanisms of attention that presumably play different functional roles. Interestingly, Experiment 1 showed that both the N2pc and the target-elicited lateralized alpha suppression were largely absent for targets in the upper VF, whereas both signals were present for targets in the lower VF. This upper/lower difference has been observed previously for the N2pc component (Luck et al., 1997), but the reason for this effect is still not known. One possible explanation is neuroanatomical: the processing of the upper VF in ventral areas of the visual cortex may lead to dipoles that do not propagate well to the scalp. Another possibility is functional: previous research shows that visual attention operates somewhat differently in the upper and lower VFs (He et al., 1996; Kraft et al., 2011) and the mechanism of attention reflected by the N2pc may be used only when attention is directed to the lower VF. A third possibility is that the same processes are used for the upper and lower VFs, but the activity is lateralized only for the lower VF. The same possibilities also apply to the lack of target-elicited lateralized alpha suppression for upper VF targets. Note, however, that targets in both the upper and lower VFs elicited large reductions in alpha-band activity over both hemispheres; the only difference was that this effect was larger over the contralateral hemisphere for the lower VF targets but not for the upper VF targets. This provides tentative evidence against an anatomical explanation for the lack of a lateralized effect for upper VF targets, because these targets are clearly capable of producing large alpha suppression effects. The nature of the differences in attention for the upper and lower VFs will be an important topic for future research. Differences between the upper and lower VFs were also observed for cue-related alpha lateralization in the seminal study of Worden et al. (2000), which involved precuing one of the four quadrants. Specifically, they reported that the scalp distribution. of the lateralization was significantly more medial for the upper VF cues than for the lower VF cues. The lateralization effects also appeared to be stronger overall for the lower VF cues, consistent with the present target-related alpha lateralization effects, but unfortunately no statistical analysis of this apparent difference in magnitude was provided. It would be useful for future research to directly compare cue-elicited and target-elicited alpha lateralization effects to determine whether they reflect a common underlying mechanism. Alpha lateralization effects have also been reported in relation to stimulus value. For example, Marshall et al. (2018) found that cue-related alpha lateralization was modulated by the presence of targets or distractors that had a positive or negative value. Therefore, alpha lateralization seems to be a ubiquitous mechanism of spatial attention, playing roles in preparation, value-related processing, and active target selection. Although both the N2pc component and the lateralized alpha effects were limited to lower VF targets in Experiment 1, suggesting that they may be related, these effects had different time courses in both Experiments 1 and 2. Even taking into account the poorer temporal precision of the TF analyses, the alpha lateralization clearly lasted much longer than the N2pc (and the sustained contralateral negativity that followed the N2pc). Interestingly, the alpha effects lasted long after the behavioral response and well into the intertrial period, suggesting that they may reflect a relatively long-lasting modulation of processing. As can be observed in the ERP waveforms in both Experiments 1 and 2 (Figs. 4 and 10, respectively), ERP lateralization effects were present long after the N2pc and PD time windows. These effects consisted of contralateral negativities that occurred ⬃300 – 600 ms and 700 –1200 ms after target onset. The effect from 300 – 600 ms is likely the SPCN (Prime and Jolicoeur, 2010), which has been related to the maintenance of information online in working memory. This effect in Experiment 2 replicated the.
(17) 916 • J. Neurosci., January 30, 2019 • 39(5):900 –917. finding of our previous crowding study (Bacigalupo and Luck, 2015). The later effect, from 700 –1200 ms, shares a similar timing with the alpha lateralization effect. Although this effect appeared to be larger for targets in the lower VF than in the upper VF, it was also clearly present for the upper VF targets (unlike the N2pc, SPCN, and alpha lateralization). Therefore, this late lateralized effect seems to be functionally independent from both the SPCN and the alpha lateralization and may be an interesting target for future research. Experiment 2 also demonstrated a functional dissociation between the N2pc and the lateralized alpha suppression. Replicating previous findings (Bacigalupo and Luck, 2015), the N2pc amplitude was greater at the intermediate target-flanker distance (1.6°) compared with the no-flankers condition and the most crowded (0.9°) condition. This effect suggests that the mechanism of attention indexed by the N2pc operates mainly when multiple stimuli compete for access to the same receptive fields (Moran and Desimone, 1985; Luck et al., 1997; Hopf et al., 2006), but cannot operate effectively when the stimuli are too close to be resolved by attention (He et al., 1996; Intriligator and Cavanagh, 2001). The target-elicited lateralized alpha suppression did not show this non-monotonic pattern and instead exhibited a trend for greater lateralization as the difficulty of the task increased. If this increase in alpha lateralization with increases in task difficulty can be replicated, it would suggest that lateralized alpha suppression reflects effort rather than the actual selection of the target from among the distractors (which fails under highly crowded conditions). Cue-elicited alpha lateralization effects have often been interpreted as an increase in alpha-band activity over the hemisphere contralateral to a to-be-ignored location rather than a decrease in alpha-band activity over the hemisphere contralateral to the cued location (Worden et al., 2000; Rihs et al., 2007; Jensen and Mazaheri, 2010; Mazaheri et al., 2014; Doesburg et al., 2016). In other words, the alpha-band activity may suppress the processing of stimuli at irrelevant locations rather than enhancing the processing of stimuli at relevant locations. However, the target-elicited lateralized alpha suppression observed in the present study seems more closely associated with target processing than with distractor suppression. The finding that the lateralized alpha effect varied according to the vertical position of the target in Experiment 1 would be difficult (although not impossible) to explain in terms of distractor suppression. In Experiment 2, the most potent distractors (in terms of effect on behavior) were the flankers immediately above and below the target, so the main items to be suppressed were on the same side as the target. Therefore, suppression of these items via increased alpha over the contralateral hemisphere would have produced increased rather than decreased alpha power over the hemisphere contralateral to the target. Therefore, target-elicited lateralized alpha suppression appears to mainly reflect active processing of the target rather than distractor suppression (Thut et al., 2006; Liu et al., 2016; Noonan et al., 2016). However, given the inverse relationship between alpha-band activity and cortical excitability (Klimesch, 2012), it seems plausible that alpha-band activity is related to both target enhancement and distractor suppression. Although the target-elicited lateralized alpha suppression was dissociated from the N2pc component in terms of both timing and the effects of crowding, these two effects exhibited similar effects of the vertical position of the target. Therefore, although these two effects reflect dissociable mechanisms of attention, these processes appear to be closely related and may be generated in the same areas of visual cortex. Electrophysiological studies in. Bacigalupo and Luck • Lateralized Alpha-Band Suppression As a Mechanism of Visual Attention. monkeys have shown attention effects at the single-cell level in visual areas V2, V4, and inferotemporal cortex that are consistent with human N2pc patterns (Chelazzi et al., 1993; Luck et al., 1997) and Bollimunta et al. (2008) found single-unit attention effects related to alpha oscillations in these same areas (V2, V4, and IT). Therefore, the N2pc component and target-elicited lateralized alpha suppression may operate within the same neural substrates. It will be important for future research to disentangle the neural computations involved in generating these two separable measures of visuospatial attention.. References Adrian ED, Matthews BH (1934) The Berger rhythm: potential changes from the occipital lobes in man. Brain 57:355–385. CrossRef Medline Bacigalupo F, Luck SJ (2015) The allocation of attention and working memory in visual crowding. J Cogn Neurosci 27:1180 –1193. CrossRef Medline Berger H (1929) Uber das elektrenkephalogramm des menschen. Archiv fur Psychiatrie 87:527–570. CrossRef Bollimunta A, Chen Y, Schroeder CE, Ding M (2008) Neuronal mechanisms of cortical alpha oscillations in awake-behaving macaques. J Neurosci 28:9976 –9988. CrossRef Medline Chelazzi L, Miller EK, Duncan J, Desimone R (1993) A neural basis for visual search in inferior temporal cortex. Nature 363:345–347. CrossRef Medline Delorme A, Makeig S (2004) EEGLAB: an open source toolbox for analysis of single-trial EEG dynamics including independent component analysis. J Neurosci Methods 134:9 –21. CrossRef Medline Doesburg SM, Bedo N, Ward LM (2016) Top-down alpha oscillatory network interactions during visuospatial attention orienting. Neuroimage 132:512–519. CrossRef Medline Eimer M (2015) EPS mid-career award 2014: the control of attention in visual search: cognitive and neural mechanisms. Q J Exp Psychol (Hove) 68:2437–2463. CrossRef Medline Faul F, Erdfelder E, Lang AG, Buchner A (2007) G*Power 3: a flexible statistical power analysis program for the social, behavioral, and biomedical sciences. Behav Res Methods 39:175–191. Medline Grandchamp R, Delorme A (2011) Single-trial normalization for eventrelated spectral decomposition reduces sensitivity to noisy trials. Front Psychol 2:236. CrossRef Medline Gunter TC, Wijers AA, Jackson JL, Mulder G (1994) Visual spatial attention to stimuli presented on the vertical and horizontal meridian: an ERP study. Psychophysiology 31:140 –153. CrossRef Medline Hanslmayr S, Gross J, Klimesch W, Shapiro KL (2011) The role of alpha oscillations in temporal attention. Brain Res Rev 67:331–343. CrossRef Medline He S, Cavanagh P, Intriligator J (1996) Attentional resolution and the locus of visual awareness. Nature 383:334 –337. CrossRef Medline Hopf JM, Luck SJ, Boelmans K, Schoenfeld MA, Boehler CN, Rieger J, Heinze HJ (2006) The neural site of attention matches the spatial scale of perception. J Neurosci 26:3532–3540. CrossRef Medline Intriligator J, Cavanagh P (2001) The spatial resolution of visual attention. Cogn Psychol 43:171–216. CrossRef Medline Jensen O, Mazaheri A (2010) Shaping functional architecture by oscillatory alpha activity: gating by inhibition. Front Hum Neurosci 4:186. CrossRef Medline Klimesch W (2012) alpha-band oscillations, attention, and controlled access to stored information. Trends Cogn Sci 16:606 – 617. CrossRef Medline Kraft A, Sommer WH, Schmidt S, Brandt SA (2011) Dynamic upper and lower visual field preferences within the human dorsal frontoparietal attention network. Hum Brain Mapp 32:1036 –1049. CrossRef Medline Lins OG, Picton TW, Berg P, Scherg M (1993) Ocular artifacts in EEG and event-related potentials. I: scalp topography. Brain Topogr 6:51– 63. CrossRef Medline Liu Y, Bengson J, Huang H, Mangun GR, Ding M (2016) Top-down modulation of neural activity in anticipatory visual attention: control mechanisms revealed by simultaneous EEG-fMRI. Cereb Cortex 26:517–529. CrossRef Medline Lopez-Calderon J, Luck SJ (2014) ERPLAB: an open-source toolbox for the analysis of event-related potentials. Front Hum Neurosci 8:213. CrossRef Medline.
(18) Bacigalupo and Luck • Lateralized Alpha-Band Suppression As a Mechanism of Visual Attention Luck S (2012) Electrophysiological correlates of the focusing of attention within complex visual scenes: N2pc and related ERP components. In: The Oxford Handbook of ERP Components (Luck S, Kappenman E, eds), pp 329 –360. New York: Oxford UP. Luck S (2014) An introduction to the event-related potential technique. Cambridge, MA: MIT. Luck SJ, Gaspelin N (2017) How to get statistically significant effects in any ERP experiment (and why you shouldn’t). Psychophysiology 54:146 – 157. CrossRef Medline Luck SJ, Hillyard SA (1994) Spatial filtering during visual search: evidence from human electrophysiology. J Exp Psychol Hum Percept Perform 20: 1000 –1014. Medline Luck SJ, Girelli M, McDermott MT, Ford MA (1997) Bridging the gap between monkey neurophysiology and human perception: an ambiguity resolution theory of visual selective attention. Cogn Psychol 33:64 – 87. CrossRef Medline Maheux M, Jolicœur P (2017) Differential engagement of attention and visual working memory in the representation and evaluation of the number of relevant targets and their spatial relations: evidence from the N2pc and SPCN. Biol Psychol 125:28 –35. CrossRef Medline Marshall TR, den Boer S, Cools R, Jensen O, Fallon SJ, Zumer JM (2018) Occipital alpha and gamma oscillations support complementary mechanisms for processing stimulus value associations. J Cogn Neurosci 30: 119 –129. CrossRef Medline Mazaheri A, van Schouwenburg MR, Dimitrijevic A, Denys D, Cools R, Jensen O (2014) Region-specific modulations in oscillatory alpha activity serve to facilitate processing in the visual and auditory modalities. Neuroimage 87:356 –362. CrossRef Medline Moran J, Desimone R (1985) Selective attention gates visual processing in the extrastriate cortex. Science 229:782–784. CrossRef Medline Noonan MP, Adamian N, Pike A, Printzlau F, Crittenden BM, Stokes MG (2016) Distinct mechanisms for distractor suppression and target facilitation. J Neurosci 36:1797–1807. CrossRef Medline Oostenveld R, Fries P, Maris E, Schoffelen JM (2011) FieldTrip: open source software for advanced analysis of MEG, EEG, and invasive electrophysiological data. Comput Intell Neurosci 2011:156869. CrossRef Medline Payne L, Guillory S, Sekuler R (2013) Attention-modulated alpha-band oscillations protect against intrusion of irrelevant information. J Cogn Neurosci 25:1463–1476. CrossRef Medline. J. Neurosci., January 30, 2019 • 39(5):900 –917 • 917 Pollen DA, Trachtenberg MC (1972) Alpha rhythm and eye movements in eidetic imagery. Nature 237:109 –112. CrossRef Medline Previc F (1990) Functional specialization in the lower and upper visual fields in humans: its ecological origins and neurophysiological implications. Behav Brain Sci 13:519 –575. Previc FH, Blume JL (1993) Visual search asymmetries in three-dimensional space. Vision Res 33:2697–2704. Medline Prime DJ, Jolicoeur P (2010) Mental rotation requires visual short-term memory: evidence from human electric cortical activity. J Cogn Neurosci 22:2437–2446. CrossRef Medline R Development Core Team (2013) R: a language and environment for statistical computing. Vienna: R Foundation for Statistical Computing. Ray WJ, Cole HW (1985) EEG alpha activity reflects attentional demands, and beta activity reflects emotional and cognitive processes. Science 228: 750 –752. CrossRef Medline Rihs TA, Michel CM, Thut G (2007) Mechanisms of selective inhibition in visual spatial attention are indexed by alpha-band EEG synchronization. Eur J Neurosci 25:603– 610. CrossRef Medline Sawaki R, Geng JJ, Luck SJ (2012) A common neural mechanism for preventing and terminating the allocation of attention. J Neurosci 32:10725– 10736. CrossRef Medline Spaak E, de Lange FP, Jensen O (2014) Local entrainment of alpha oscillations by visual stimuli causes cyclic modulation of perception. J Neurosci 34:3536 –3544. CrossRef Medline Thaler L, Schütz AC, Goodale MA, Gegenfurtner KR (2013) What is the best fixation target? The effect of target shape on stability of fixational eye movements. Vision Res 76:31– 42. CrossRef Medline Thut G, Nietzel A, Brandt SA, Pascual-Leone A (2006) Alpha-band electroencephalographic activity over occipital cortex indexes visuospatial attention bias and predicts visual target detection. J Neurosci 26:9494 –9502. CrossRef Medline van Diepen RM, Miller LM, Mazaheri A, Geng JJ (2016) The role of alpha activity in spatial and feature-based attention. eNeuro 3: ENEURO.020416.2016. CrossRef Medline Worden MS, Foxe JJ, Wang N, Simpson GV (2000) Anticipatory biasing of visuospatial attention indexed by retinotopically specific alpha-band electroencephalography increases over occipital cortex. J Neurosci 20:RC63. CrossRef Medline.
(19)
Figure


+7


Documento similar
In this study of the teenage population of the Autonomous Region of the Canary Islands, we observed that teenagers who meet both the moderate and vigorous intensity Physical
To sum up, we can conclude that the processual interpretation of the delim- itatives was preferred over the resultative interpretation, which confirms that the notions of telicity
Mice deficient for the telomerase component Terc and mice deficient for the shelterin component Trf1 represent good models to study telomere dysfunction.. Indeed, those mice show
Using a mean field approximation for the network activity we derive relationships between the parameters of the network that ensure that the overall level of activity of the
For example, the model of Robertson and Marino [23] is based on the fact that EEG activity that would emerge from the dorsolateral and ventrolateral prefrontal
In the preparation of this report, the Venice Commission has relied on the comments of its rapporteurs; its recently adopted Report on Respect for Democracy, Human Rights and the Rule
With this tool the authors seek to simplify the process of getting and visualizing data, with the suppression of menus and other graphical elements that can be
The main findings found in the current dissertation suggest that: (i) the adapted version of the environmental questionnaire ALPHA is a reliable and valid
