Influence of axial load in the seismic behavior of reinforced concrete walls with nonseismic detailing
108
0
0
Texto completo
(2) PONTIFICIA UNIVERSIDAD CATOLICA DE CHILE ESCUELA DE INGENIERIA. INFLUENCE OF AXIAL LOAD IN THE SEISMIC BEHAVIOR OF REINFORCED CONCRETE WALLS WITH NONSEISMIC DETAILING. CRISTÓBAL NICOLÁS ALARCÓN OLIVARI. Members of the Committee: MATÍAS HUBE G. JUAN CARLOS DE LA LLERA M. PEDRO HIDALGO O. GUILLERMO THENOUX Z.. Thesis submitted to the Office of Research and Graduate Studies in partial fulfillment of the requirements for the Degree of Master of Science in Engineering Santiago de Chile, (August, 2013).
(3) Dedicado a mi papa y mamá, Alejandro y María de los Ángeles. Gracias por todo el cariño, los quiero mucho.. ii.
(4) ACKNOWLEDGEMENTS I am grateful to my advisor, Professor Matías Hube, for his knowledge, motivation and support throughout this entire project. I appreciate all the time he spent guiding me and helping me conducting this thesis but also to improve as a professional and person. I am also grateful to the following professors from Pontificia Universidad Católica de Chile who were really interested in this project and gave me helpful advice specially for the laboratory tests: Carl Lüders, Juan Carlos de la Llera, Rosita Jünemann, Hernán SantaMaría, Rodrigo Jordán, Cristián Sandoval, Rafael Riddell, Diego López-García, José Luis Almazán, Esteban Sáez, Mauricio López and Christian Ledezma. Special thanks to Professor Bozidar Stojadinovic who came to Chile a couple of days and participated in one the wall tests. His expertise and advice was very valuable. I am also very thankful to the engineering students who contributed in this research: Andrés Marihuén, Roberto Manieu, Felipe Quitral, José Carlos Remesar, Juan Nicolás Rendic, Máximo Ochagavía, Fabián Riquelme, Mario Saavedra, Cristián Barrueto and Álvaro Gutiérrez. I am thankful to the engineers and technicians from DICTUC S.A and the Laboratory of the Structural and Geotechnical Engineering Department of the University who worked hardly in performing the wall tests: Jaime Arriagada, Nicolás Tapia, Elías Peña, Alejandro Cruz, Manuel Rabello, Atilio Muñoz, Armando, Camilo, Julián, Jairo and Fabián. I would also like to thank Héctor Lizana for controlling the actuators. I am also very thankful to the other postgraduate students at the Structural and Geotechnical Engineering Department which made it a pleasant environment to work, specially: Felipe Rubilar, Felipe Toro, Alix Becerra, Antonio Salazar, Mathias Gelb, Javier Pardo, Gislaine Pardo, Daniel González, Nicolás Zegpi, Francisco Humire, Sebastián Castro and Santiago Brunet, and also to the staff of the Department: Jenifer Flores, Josefina Uribe and Carlos Abarca. Finally, I would like to thank my family and friends for their support for my academic pursuits. I feel very fortunate to have wonderful people around. iii.
(5) This research has been funded by the Chilean Fondo Nacional de Ciencia y Tecnología, Fondecyt, through Grant #1110377 and Fondap through Grant #15110017.. iv.
(6) TABLE OF CONTENTS. ACKNOWLEDGEMENTS ..........................................................................................iii LIST OF FIGURES ..................................................................................................... vii LIST OF TABLES ......................................................................................................... x RESUMEN .................................................................................................................. xii ABSTRACT ............................................................................................................... xiii 1.. INTRODUCTION ................................................................................................. 1. 2.. BACKGROUND ................................................................................................... 4. 3.. 4.. 5.. 2.1. Chilean RC Shear Wall Buildings .................................................................... 4. 2.2. Axial Load Limits for RC Shear Walls in Design Codes .................................. 7. 2.3. Previous Experimental Research in the Field ................................................. 10. SURVEY OF DAMAGED BUILDINGS ............................................................. 13 3.1. Building Characteristics ................................................................................. 13. 3.2. Wall Characteristics ....................................................................................... 14. 3.3. Analytical Study of Selected Wall .................................................................. 21. EXPERIMENTAL PROGRAM ........................................................................... 30 4.1. Specimen Design ........................................................................................... 30. 4.2. Wall Specimens Construction ........................................................................ 33. 4.3. Material Properties......................................................................................... 35. 4.4. Test Setup ...................................................................................................... 36. 4.5. Instrumentation .............................................................................................. 40. 4.6. Load Application and Control ........................................................................ 43. PRE-TEST ANALYSIS ....................................................................................... 45 v.
(7) 6.. 7.. 8.. 5.1. Concrete Stress-Strain Relationship ............................................................... 45. 5.2. Steel Stress-Strain Relationships .................................................................... 47. 5.3. Wall ACI Strength ......................................................................................... 47. 5.4. Moment – Curvature Relationships ................................................................ 49. 5.5. Displacement Estimation ............................................................................... 51. EXPERIMENTAL RESULTS ............................................................................. 53 6.1. Observed Behavior ........................................................................................ 53. 6.2. Vertical Load application ............................................................................... 61. 6.3. Load-Displacement Relationships .................................................................. 62. 6.4. Moment Curvature Relationships ................................................................... 65. 6.5. Top Rotation .................................................................................................. 68. 6.6. Plastic Hinge Length ...................................................................................... 69. Analytical-Experimental comparison .................................................................... 71 7.1. Wall Strength................................................................................................. 71. 7.2. Yield and ultimate displacement .................................................................... 72. 7.3. Ultimate Top Rotation ................................................................................... 77. Conclusions.......................................................................................................... 80. REFERENCES ............................................................................................................ 84 A P P E N D I C E S .................................................................................................... 88 APPENDIX A. MATERIAL TESTING ................................................................... 89 A.1. Concrete ........................................................................................................ 89. A.2. Reinforcing Steel ........................................................................................... 91. vi.
(8) LIST OF FIGURES Figure 1.1. Flexural-compressive failure in damaged Chilean walls ............................... 2 Figure 2.1. Example floor plan of a "fish-bone" Chilean residential building .................. 4 Figure 2.2. Chilean residential building under construction ............................................ 5 Figure 2.3. Residential buildings in Santiago, Chile ....................................................... 5 Figure 3.1. Damaged buildings surveyed ...................................................................... 13 Figure 3.2. Damaged walls in (a) CM (b) AH (c) PR (d) AA buildings ........................ 14 Figure 3.3.. ratio of walls of damaged buildings ............................................... 15. Figure 3.4. Axial load ratio due to gravity loads in walls of damaged buildings ............ 16 Figure 3.5. Axial load ratio due to gravity and earthquake loads in walls of damaged buildings ...................................................................................................................... 17 Figure 3.6. Observed failure in selected wall ................................................................ 22 Figure 3.7. Elevation view of axis E from CM building and Plan view of second story from CM building ........................................................................................................ 23 Figure 3.8. Selected wall cross section ......................................................................... 23 Figure 3.9. Material stress-strain relations (Karthik & Mander, 2011) .......................... 24 Figure 3.10. Moment-curvature relationship for the analyzed wall ............................... 25 Figure 3.11. Interaction curve for selected wall ............................................................ 26 Figure 3.12. Pseudo-Acceleration and displacement spectrum for 2010 ground motions and NCh 433 (INN, 2009) spectrum ............................................................................. 27 Figure 3.13. (a) Plastic hinge and (b) ACI318 approach for estimation of roof displacement of a cantilever wall ................................................................................. 29 Figure 4.1. Wall specimens geometry (in cm) .............................................................. 31 vii.
(9) Figure 4.2. Wall specimens reinforcement detailing ..................................................... 32 Figure 4.3. Wall specimen construction process ........................................................... 34 Figure 4.4. Wall specimens W1, W2 and W3 ............................................................... 35 Figure 4.5. Test setup. Lateral view shown in higher scale. .......................................... 37 Figure 4.6. Test Setup (picture) .................................................................................... 38 Figure 4.7. Fixed base beam for wall specimens ........................................................... 38 Figure 4.8. Horizontal actuator attached to the top beam .............................................. 39 Figure 4.9. Vertical actuator and rolling supports ......................................................... 39 Figure 4.10. Load cell and displacement transducer channel configuration ................... 41 Figure 4.11. Strain gauge configuration........................................................................ 42 Figure 4.12. Spots and grid for image correlation ......................................................... 42 Figure 4.13. Horizontal displacement loading cycles .................................................... 44 Figure 5.1. Confined concrete area at the stirrups level................................................. 45 Figure 5.2. Concrete stress-strain relationships ............................................................. 46 Figure 5.3. Steel stress-strain relationships ................................................................... 47 Figure 5.4. Nominal interaction curve of wall specimens according to ACI .................. 48 Figure 5.5. Analytical moment-curvature relationships of wall specimens .................... 50 Figure 6.1. Specimen W1 observed behavior................................................................ 56 Figure 6.2. Specimen W2 observed behavior................................................................ 57 Figure 6.3. Specimen W3 observed behavior................................................................ 58 Figure 6.4. Strain versus time for strain gauge V1M for specimens W1, W2 and W3 (first four displacement amplitudes) ............................................................................. 59. viii.
(10) Figure 6.5. Strain versus time for strain gauge V7M for specimens W1, W2 and W3 (first four displacement amplitudes) ............................................................................. 59 Figure 6.6. Failure mode from the 2010 Chile Earthquake reproduced by the wall tests 60 Figure 6.7. Wall displacements versus time and observed behavior of wall specimens . 60 Figure 6.8. Vertical load recorded for wall specimens .................................................. 62 Figure 6.9. W1 load-displacement relationship ............................................................. 63 Figure 6.10. W2 load-displacement relationship ........................................................... 64 Figure 6.11. W3 load-displacement relationship ........................................................... 64 Figure 6.12. W1, W2 and W3 load-displacement relationships ..................................... 65 Figure 6.13. W1 Moment-curvature relationship .......................................................... 67 Figure 6.14. W2 Moment-curvature relationship .......................................................... 67 Figure 6.15. W3 Moment-curvature relationship .......................................................... 68 Figure 6.16. Top rotation versus time for wall specimens ............................................. 69 Figure 6.17. Damage concentration at the bottom of wall specimens ............................ 70 Figure 7.1. Reinforcement Slip Model (Sezen & Setzler, 2008).................................... 74 Figure A.1. Concrete samples and compressive test ..................................................... 90 Figure A.2. Test setup for steel bars ............................................................................ 91 Figure A.3. Stress-strain for ϕ5 A560-500H ................................................................. 93 Figure A.4. Stress-strain for ϕ10 A630-420H .............................................................. 94 Figure A.5. Stress-strain for ϕ10 A630-420H .............................................................. 94. ix.
(11) LIST OF TABLES Table 2.1. Limit of ALRs (. ) in design codes ................................................... 10. Table 3.1. Number of stories of surveyed buildings ...................................................... 13 Table 3.2. Comparison between inelastic design spectrum and response spectrum for buildings located in Concepción. .................................................................................. 18 Table 3.3. Vertical boundary reinforcement ratio of walls of the damaged buildings .... 19 Table 3.4. Vertical distributed reinforcement ratio of walls of the damaged buildings .. 20 Table 3.5. Horizontal reinforcement ratio of walls of the damaged buildings ................ 20 Table 3.6. Average wall properties of damaged buildings............................................. 21 Table 4.1. Characteristics of the surveyed walls and wall specimens ........................... 33 Table 4.2. Average parameters for AT560-500H (ϕ 5) and A630-420H (ϕ 8 and ϕ 10) . 36 Table 4.3. Load cell and displacement transducer channel list ...................................... 41 Table 4.4. Applied axial loads for wall specimens ........................................................ 43 Table 5.1. Parameters for unconfined and confined concrete ........................................ 46 Table 5.2. Moment and lateral strengths of wall specimens from ACI interaction diagram........................................................................................................................ 49 Table 5.3. Moment and maximum lateral strengths of wall specimens from momentcurvature relationships ................................................................................................. 50 Table 5.4. Curvature and ductility estimation from moment-curvature relations ........... 51 Table 5.5. Displacement (and % drift) and ductility estimation from plastic hinge approach ...................................................................................................................... 51 Table 6.1. Amplitude of cycles corresponding to observed behavior (mm) ................... 61 Table 7.1. Analytical and experimental lateral strength of wall specimens .................... 71 x.
(12) Table 7.2. Analytical (effective 160 cm wall height) and experimental wall strength .... 72 Table 7.3. Analytical and experimental yield displacement .......................................... 73 Table 7.4. Analytical contribution to yield displacement and experimental yield displacement ................................................................................................................ 75 Table 7.5. Analytical and experimental ultimate displacement ..................................... 76 Table 7.6. Analytical contribution to ultimate displacement and experimental ultimate displacement ................................................................................................................ 77 Table 7.7. Analytical and experimental ultimate top rotation ........................................ 78 Table 7.8. Analytical contribution to ultimate top rotation and experimental ultimate top rotation ........................................................................................................................ 78 Table A.1. Concrete mix design for wall base beams ................................................... 89 Table A.2. Measured concrete strength for wall specimens ......................................... 90 Table A.3. ϕ5 A560-500H bar properties .................................................................... 92 Table A.4. ϕ8 A630-420H bar properties .................................................................... 92 Table A.5. ϕ10 A630-420H bar properties ................................................................... 93. xi.
(13) RESUMEN Aproximadamente el 2% de los edificios de hormigón armado de 9 pisos o más sufrió daño serio en el terremoto de Chile de 2010. El daño observado en estos muros consistió principalmente en aplastamiento del hormigón, pandeo del refuerzo vertical y apertura del refuerzo horizontal. Este daño se atribuye al bajo confinamiento del hormigón, el detallamiento inadecuado de la armadura de borde y cargas axiales elevadas. Los objetivos de esta tesis son reproducir el daño observado y estudiar la influencia de la carga axial en el comportamiento sísmico de muros de hormigón armado sin detallamiento sísmico. Para cumplir estos objetivos, se diseñaron tres muros a escala 1:2 con características representativas de los edificios chilenos dañados. Estas características fueron obtenidas de cinco edificios que sufrieron daño en el terremoto del 2010. Los muros se ensayaron bajo ciclos de desplazamientos laterales y sujetos a diferentes razones de carga axial de 0.15, 0.25 y 0.35. El modo de falla de flexo-compresión observado en los muros dañados durante el terremoto del 2010 fue reproducido en los ensayos. Los resultados experimentales indican que la carga axial elevada tiene un efecto significativo en el comportamiento y en el modo de falla de los muros de hormigón armado; ésta gatilla una peligrosa falla frágil de aplastamiento de hormigón inmediatamente después de la pérdida de recubrimiento de la sección. Se concluye que la capacidad de desplazamiento de los muros de hormigón armado se reduce casi a la mitad cuando la razón de carga axial aumenta de 0.15 a 0.35. A pesar de que las nuevas disposiciones chilenas para el diseño de muros están destinadas a prevenir este tipo de falla, más estudios se necesitan para validar el límite de razón de carga axial de 0.35 para muros con detallamiento sísmico.. Palabras Clave: hormigón armado, carga axial, muros, comportamiento sísmico, terremoto Chile.. xii.
(14) ABSTRACT About 2% of reinforced concrete buildings taller than nine stories suffered serious damage during 2010 Chile Earthquake. The observed damage in reinforced concrete walls involved mostly crushing of concrete, vertical reinforcement buckling and horizontal reinforcement opening. Damage in these walls is attributed to poor concrete confinement, inadequate boundary reinforcement detailing, and high axial loads. This thesis aims to reproduce the observed damage and evaluate the influence of axial loads in the seismic behavior of reinforced concrete walls with nonseismic detailing. To achieve these objectives, three identical ½-scale wall specimens were tested. These wall specimens were designed with representative characteristics that were obtained from a survey of five buildings damaged during the 2010 Earthquake. The wall specimens were tested under equal lateral displacements cycles and subjected to different constant axial load ratios of 0.15, 0.25 and 0.35. The flexural-compressive failure mode exhibited by damaged walls during the earthquake was reproduced in these tests. The experimental results indicate that high axial load has a significant effect on the seismic performance and failure mode of reinforced concrete walls. Indeed, it triggers a dangerous brittle concrete crushing failure which occurs immediately after cover concrete spalling. It is concluded that the displacement capacity of reinforced concrete walls is reduced by almost half when the axial load ratio is increased from 0.15 to 0.35. Although new Chilean provisions for reinforced concrete wall design are intended to prevent this type of failure, more studies should be performed in order to validate the axial load ratio limit of 0.35 for walls with seismic detailing imposed in the new provisions.. Keywords: reinforced concrete, axial load, shear wall, seismic behavior, Chile earthquake.. xiii.
(15) 1. 1. INTRODUCTION On February 27th, 2010, the central south region of Chile was struck by an M w=8.8 earthquake, one of the strongest ever measured (EERI, 2010). This earthquake impacted 500 km of Chilean coast and over 12 million people (about 72% of the country‟s population) experienced a Mercalli intensity of VII or stronger. A tsunami was triggered after the earthquake, which devastated several towns near the coast. Serious damage was imparted to residential and industrial buildings, highways, railroads, ports and airports. More than 80,000 residences were destroyed and more than 100,000 had substantial damage caused by the earthquake and the tsunami. The performance of tall reinforced concrete (RC) wall buildings with 9 or more stories was acceptable; about 2% of the newer building inventory presented severe damage (Jünemann et al., 2012; Massone et al., 2012) and only one of these buildings collapsed. Damage in this type of structures was most likely attributed to poor concrete confinement, inadequate boundary reinforcement detailing, and high axial loads (Jünemann et al., 2012; Wallace et al., 2012). This research is aimed to study the third factor; how the level of axial load affects the seismic performance of RC walls. Chile is a country located in an active subduction zone and has a significant seismic history. However, its residential buildings are designed with somehow different characteristics than other seismic countries, which make them special and relevant to study after a strong earthquake. Chilean residential buildings rely on a structural system with a large number of RC walls to resist gravity and lateral loads, which provides high stiffness (Wood, 1991). The good building performance in 1985 earthquake was attributed to this high stiffness, and it was concluded that confinement in RC walls was not needed in this type of buildings. However, after 1985 Chilean construction practice evolved, mutating these buildings into taller structures with thinner walls, which led to and increase of the axial loads in walls (Massone et al., 2012). The survey performed by Jünemann et al. (2012) indicates that most of damaged buildings in 2010 were mainly.
(16) 2. new structures constructed after year 2000 and that high axial load was a relevant factor that may have triggered the observed damage. According to Zhang and Wang (2000), and Su and Wong (2007), high axial loads reduce the wall ductility significantly. However, these conclusions were obtained by testing RC walls with transverse boundary reinforcement, which provides concrete confinement and which was not required by Chilean design codes. During a compressive failure of a well confined RC wall, the axial strength is not reduced after cover concrete spalling; the concrete core becomes stronger due to confinement, and the plasticity is distributed along the wall height. However, if confinement is poor, damage concentrates in a reduced region of the wall causing a brittle flexural-compressive failure which is induced by crushing of concrete and buckling of vertical reinforcement bars, as was observed in some walls of damaged Chilean buildings (Figure 1.1).. Figure 1.1. Flexural-compressive failure in damaged Chilean walls This thesis aims to reproduce the damage observed is walls during the 2010 Earthquake and to evaluate the cyclic behavior of RC walls subjected to high axial load ratios (ALRs) using an experimental campaign. The ALR is the defined as the axial load,. , where N is. the concrete compressive strength, and Ag the gross cross section of the. wall. The findings from this thesis are intended to be considered in future design provisions in Chile for RC walls in order to avoid the brittle failure mode observed in 2010..
(17) 3. To achieve the presented objectives, three ½-scale identical RC wall specimens were tested. These wall specimens were designed with representative characteristics of damaged buildings, which were obtained from a survey of walls from five damaged RC wall buildings. The average reinforcement ratios, wall thicknesses, ALRs and ratios (where M is the moment at the base of the wall, V the shear load and lw the wall length) were studied to design the prototype wall for conducting the experiments. The three wall specimens were tested under equal lateral cyclic displacements and subjected to different constant ALRs in order to reproduce the observed failure in RC walls. The influence of ALR in the cracking process, strength and deformation capacity of walls was studied from the observed behavior and the load-displacement relationships of the wall specimens. The literature review of this research is given in Chapter 2 which describes the characteristics of Chilean buildings that made them susceptible to the observed damage in 2010. The ALR limits for RC walls in design codes from other countries are compared in Chapter 2 with the new ALR limit adopted in Chile, and also previous experimental research involving RC wall tests are also summarized in this Chapter. Chapter 3 describes the survey performed to five damaged RC buildings in order to obtain representative wall characteristics that were considered in the experimental campaign. Additionally, an analytical study was performed to a selected RC wall that was damaged during the 2010 Earthquake in order to explain the observed failure. The experimental program which includes the specimen design, construction, material testing, test setup, instrumentation and load application, is described in Chapter 4. A pretest analysis in order to study the flexural behavior of the wall specimens is shown in Chapter 5. Chapter 6 shows the test results and a comparison between the behaviors of the three wall specimens is discussed in this Chapter. Finally, the analytical and experimental results are compared in Chapter 7 and conclusions obtained after this study are listed in Chapter 8, where the Chilean wall characteristics which triggered the damage and the findings from the test results are discussed..
(18) 4. 2. BACKGROUND The structural characteristics of Chilean RC walls for residential buildings and how they have been evolving through history is discussed in this Chapter. After the strong earthquakes of 1985 and 2010, the Chilean seismic design codes had been modified, and a limit to the axial load for RC walls was introduced in 2011. This limit is discussed in this Chapter and compared with the limit of other design codes. At the end on this Chapter, previous experiments conducted to study the seismic behavior of walls are reviewed, leading to a discussion of how high axial loads affect the seismic behavior of RC walls.. 2.1. Chilean RC Shear Wall Buildings. Chilean residential buildings follow a special type of configuration called “fish-bone” (Jünemann et al., 2012). It consists on a structural system of RC walls that follow the architectural layout of the building (Figure 2.1). Each floor usually has a central longitudinal corridor with long walls and shorter transverse walls that separate apartments and rooms from each other. The transverse walls typically run from the central corridor towards the exterior of the building. Figure 2.2 and Figure 2.3 show pictures of representative Chilean residential buildings.. Figure 2.1. Example floor plan of a "fish-bone" Chilean residential building.
(19) 5. Figure 2.2. Chilean residential building under construction. Figure 2.3. Residential buildings in Santiago, Chile Although the Chilean seismic design philosophy with respect to acceptable damage and safety is similar to the one accepted worldwide, Chilean residential buildings are usually different than those from other countries with important seismic history like the U.S. or Japan. Most of Chilean moderate-rise residential buildings rely on a large number of RC.
(20) 6. walls to resist gravity and lateral loads which provide high lateral stiffness for the buildings (Wood, 1991). Chilean RC wall buildings performed extremely well during 1985 Chile Earthquake. In the city of Viña del Mar, less than 4% of the buildings suffered major damage (Riddell et al., 1987). Most of the buildings sustained no structural damage because of the large amount of wall area in each direction of the building. The ratio of wall cross sectional area to floor plan area in Chilean RC buildings is independent of their height and age, and its average ratio is about 3% in each direction of the building (Riddell et al., 1987; Jünemann et al., 2012; Massone et al., 2012). As a result of this large amount of wall area, Chilean buildings are very stiff, which explain the good performance during the 1985 earthquake even in cases where deficiencies in detailing, construction and inspection were identified (Wood et al., 1987). This satisfactory performance contradicted the philosophy in US building codes where the emphasis is on providing reinforcement confinement to ensure a ductile behavior. Wood (1991) concluded that building stiffness can eliminate the need for toughness in structural walls and reinforcement confinement might not be required at wall boundaries if drift is controlled. For building with such wall ratio, drift is likely to be in the order of 1% during a strong earthquake (Wood, 1991). Because of the lesson learned after the 1985 earthquake, the ACI 318-95 (1995) requirements for special boundary elements in RC walls were excluded in NCh433 (INN, 1996). Chilean design and construction of buildings evolved after the 1985 earthquake. A boom in the construction that started in the 90‟s plus the introduction and development of computing modeling programs have influenced changes in the design. Buildings became taller and more slender, and wall thicknesses decreased (Jünemann et al., 2012; Massone et al., 2012). In many cases, buildings with 20 stories were built with 15- 20 cm wall thicknesses. These changes lead to an increase of the wall axial loads due to gravity loads. A survey of 34 damaged buildings after 2010 Chile earthquake conducted by Jünemann et al. (2012) concluded that walls of damaged RC buildings were subjected to.
(21) 7. an average ALR of 0.10 for walls located in the first floor. The average ALR increased to 0.12 in walls of the first subterranean floor due to large vertical irregularities between the first story and the subterranean level. When earthquake loads are added, ALRs reach higher levels varying generally from 0.20 to 0.50 (Massone et al., 2012). At the time of the 2010 earthquake the seismic design of Chilean RC buildings followed two codes: NCh433 (INN, 2009) which refers to the seismic design of structures and NCh430 (INN, 2008) which focuses on the design of RC structures. The NCh433 (INN, 1996) neglected the ACI 318-95 (1995) transverse reinforcement requirements for providing concrete confinement before the modification done in 2009. This implies that about 2000 mid-rise and high-rise RC buildings were built without special boundary elements (Wallace et al., 2012). NCh430 is based on the ACI 318-05 (2005) and the confinement provisions are not excluded in this code. Although, NCh430 lacks a limit to both wall thickness and wall axial load. After 2010 earthquake, the Chilean seismic codes where modified by decree DS 60 (2011) and decree DS 61 (2011). The first one uses ACI 318-08 (2008) as the base code but among other modifications, it imposes a limit for the ALR of walls, a criteria for the confinement of wall boundaries, and a minimum wall thickness of 30 cm for walls that require confinement.. 2.2. Axial Load Limits for RC Shear Walls in Design Codes. An axial load limit for RC walls was introduced in Chilean seismic design code after the 2010 earthquake in decree DS 60 (2011). The factored ALR is limited to 0.35. In seismic design codes around the world, there are also some limitations for ALR which are summarized below. In the Eurocode (European Comittee for Standardization, 2004), the maximum allowed ALR for primary seismic RC walls is 0.40 or 0.35 for medium ductility class or high ductility class, respectively. The ductility class depends on the hysteretic dissipation.
(22) 8. capacity of the wall. This limit is similar than that of UBC-97 (1997), where the ALR is limited to 0.35. In the case of the ACI 318-11 (2011), the axial strength in compression members is limited in section 10.3.6 for non prestressed member with tie reinforcement by: (. Where. ). (1). is the design axial strength of the element, ϕ is the strength reduction. factor for compression-controlled sections, and. is the vertical reinforcement area. If. the strength reduction factor is not considered, and the reinforcement contribution is neglected, the maximum ALR for walls is 0.68. However, in the empirical design method proposed for rectangular RC walls in Section 14.5 of the ACI code, the axial wall strength is limited by: ( Where. (. (2). ) ). is the nominal axial strength of the cross section, k is the effective length. factor (k = 0.8 was considered, which corresponds for a wall with restricted lateral displacement at both ends and restricted rotation at one or both ends),. is the wall. height, and h is the wall thickness. Assuming typical dimensions of Chilean walls ( 2-3 m and h = 15-30 cm) and without considering the reduction factor ϕ, the maximum ALR for walls is limited to about 0.4-0.5. The axial strength limit in Canadian design code, CSA A23.3-04 (2004), is similar than that of ACI318. Equation 14-1 of the Canadian code limits the axial strength of walls with the following equation: ( Where. (. is the factored axial strength of the wall,. compression block to the specified concrete strength,. ) ). (3). is the ratio of average stress in the is the strength reduction factor,.
(23) 9. is the gross area of the section, k is the effective length factor,. is the unsupported. vertical height of wall between horizontal supports and t is the walls thickness. Similar to the ACI 318, the maximum ALR is limited to about 0.40-0.50 when typical dimensions of Chilean RC walls are taken into consideration and without considering the reduction factor. .. In the NSZ 3101 (Standards New Zealand, 2006) the stability of walls in terms of the prevention of buckling is important in the design. Clause 11.3.7 establishes that if the design axial load at the ultimate state (N*) is larger than. , wall slenderness. must be controlled as: (4). ( Where k is the effective length factor,. is the clear vertical distance between floors or. other effective horizontal lines of lateral support, or clear span of the wall, t is the wall thickness. In the Mexican code, NTCC-04 (Gobierno del Distrito Federal, 2004) if the ALR of RC walls exceeds 0.3, requirements for vertical reinforcement are more exigent and wall buckling must be restricted with lateral support. Finally, in the Chinese Code for seismic design of buildings (China Ministry of Construction, 2010) the axial stress should not be greater than 0.50 high rise buildings located in severe seismic zones. In this code axial compressive strength of concrete, different from. for RC walls in. is the design value of. considered in the other codes. which refers to the compressive cylinder strength of concrete. Assuming that the relation between concrete strengths is. , the axial stress limit in the Chinese code is. equivalent to 0.59 . From the bibliographical study described here it can be concluded that the axial load limit adopted by the recent Chilean decree DS60 (2011) is the same that the one from Eurocode 8 for walls with high ductility and the one from UBC-97. Additionally, the.
(24) 10. limit of DS60 (2011) is more conservative than the implicit limits established by the American and Canadian Codes. For the Mexican and the New Zealander codes, there is no axial load limit, but if the ALR is higher than the limits shown in Table 2.1, some requirements to prevent wall buckling must be satisfied. Table 2.1. Limit of ALRs ( Decree N60. Eurocode 8. (Chile). (Europe). 0.35. 0.35-0.4. UBC-97. 0.35. ACI 318-11 (USA). ~ 0.4-0.5. ) in design codes CSA. A23.3-04 (Canada). NZS3101-2006. NTCC-04. (New Zealand). (Mexico). 0.2*. 0.3*. ~ 0.40.5. GB500112010 (China). 0.50**. *Not a limit, but if the ALR is higher the design is restricted. ** The Chinese code considers a different definition for the concrete strength. 2.3. Previous Experimental Research in the Field. The seismic behavior of RC walls had been widely studied experimentally and analytically. Walls should be designed to develop a ductile flexural behavior consistent with the structural modification factor R, and hence, brittle modes of failure should be avoided. However, the ductile flexural behavior may be affected if the wall is subjected to high compressive stresses. This section describes previous experimental research of RC walls that are relevant for this study. Hidalgo et al. (2002) tested 26 squat walls to study the shear failure mode of Chilean RC walls. Because shear strength was the goal, these walls were tested conservatively without axial load to provide a lower bound of the shear strength, since ACI 318 (2011) neglects this effect. The walls tested had low aspect ratio with. ratios from 0.35. to 1.00, where M is the bending moment at the base of the wall, V is the shear load and the length of the wall. It was concluded that deformation capacity of walls gets smaller as the with the variation of. ratio decreases but the energy dissipation of walls is not affected ratio..
(25) 11. Takahasi et al. (2013) tested 10 specimens in order to study the flexural drift capacity of RC walls with low confinement. Their research is influenced by the damaged wall buildings after 2010 Chile Earthquake, which exhibited a brittle performance. All the wall specimens had a boundary column on only one side. The test parameters were wall length, thickness, detailing and ALR. One wall was tested without axial loads and for the other walls an ALR around 0.2 was used. The. ratios of the walls were between. 1.26 and 2.48, the wall thicknesses between 90 and 140 mm and the wall lengths between 720 and 1800 mm. The lateral and vertical reinforcement ratios were between 0.0054 and 0.0084 and between 0.0019 and 0.0030, respectively. All the tested walls failed in compression after flexural yielding and their observed drift capacity were between 0.004 and 0.012. From the experiments, Takashi et al. proposed equations to predict the drift capacity of walls where the plastic hinge length is assumed as 2.5 times the wall thickness. The effect of high axial loads on the behavior of RC shear walls was studied by Zhang and Wang (2000). They tested four walls designed as a prototype of a 50-story RC building located in Shanghai, China, subjected to ALRs of 0.24 and 0.35. The authors noticed that in past experiments, most walls were tested under ALRs smaller than 0.15 and they claimed that in China: “it is not uncommon, in practice, that axial-load ratios of shear walls under design gravity load and seismic action are as high as 0.3 to 0.6”. The aspect ratio. of the wall specimens was 2.5 and the. ratio was 2.14.. Three specimens (SW7, SW8 and SW9) were typical RC walls and the forth one (SRCW12) included a steel channel as longitudinal reinforcement. Adequate confinement was provided to prevent buckling of the longitudinal bars. The vertical and horizontal web reinforcement ratios of the four specimens were 0.0067 and 0.0101, respectively, but the ratio of main flexural reinforcement was different is each specimen: 0.0088 for SW7, 0.0065 for SW8, 0.0180 for SW9, and 0.0153 for SRCW12. Each specimen was tested under different combinations of axial load and horizontal load reversals. An ALR of 0.25 was applied to specimen SW7 and SW9, and 0.35 was applied to specimen SW8 and SRCW12. A shear compressive ratio. of.
(26) 12. 0.106 was applied to SW7, 0.109 to SW8, 0.134 to SW9 and 0.151 to SRCW12. After performing the experiments and analyzing the results, Zhang and Wang concluded that the axial load affects the cracking pattern, the flexural strength, the failure mode, and the ductility of RC walls. Su and Wong (2007) tested three slender RC walls subjected to ALRs of 0.25 and 0.5. They noticed that the axial load could reach high levels in medium and high rise buildings in Hong Kong. Under working conditions, the ALR in walls could be between 0.3 and 0.5. Three RC walls were fabricated with. ratios of 4. The first two. specimens (W1 and W2) were detailed identical, with a longitudinal reinforcement ratio of 0.0196 and a transverse reinforcement ratio in the plastic hinge zone of 0.0054, but wall W1 was tested with an ALR of 0.25 and wall W2 with 0.5. The third wall (W3) was detailed with a longitudinal reinforcement ratio of 0.0196 and a transverse reinforcement ratio in the plastic hinge zone of 0.0108, and was tested under and ALR of 0.5. The experiments showed a ductile flexural failure in wall W1 and a brittle compressive failure in walls W2 and W3 which were subjected to high ALR. Thus, high axial load had a suppressive effect on ductility and energy dissipation of the walls. Based on the test results of Zhang and Wang (2000) and Su and Wong (2007) it can be concluded that ALR affects the performance of RC shear walls. High axial loads reduce the ductility significantly mainly because of the brittle out-of-plane buckling mode of failure. However, in both research projects their authors concluded that more experiments are required in order to develop a rational procedure to limit the ALR in RC walls based on performance..
(27) 13. 3. SURVEY OF DAMAGED BUILDINGS A survey of critical walls of damaged RC buildings was conducted to obtain representative characteristics of damaged walls. These characteristics were used to define a prototype wall for conducting the experimental campaign of this research. General characteristics of five seriously damaged RC buildings and relevant properties of their walls are considered. Only rectangular walls are included in this survey because the experiments were limited to such sections. At the end on this Chapter one damaged wall is studied analytically in order to explain the damage. 3.1. Building Characteristics. Five damaged buildings (Figure 3.1) were considered in this survey in order to study the relevant characteristics of their RC walls. Four of these buildings are located in Concepción (CM, AH, PR and AA) and one in Santiago (EM). All these buildings can be considered high-rise buildings because they have between 12 and 20 stories (Table 3.1). The specified concrete strength is. = 20 MPa for PR and EM buildings and. =. 25 MPa for CM, AH and AA buildings. The characteristics of the buildings located in Concepción were obtained from the survey performed by Westenenk et al. (2012).. Figure 3.1. Damaged buildings surveyed Table 3.1. Number of stories of surveyed buildings Building. CM. AH. PR. AA. EM. Number of stories + subterranean floors. 18+1. 15+2. 13+1. 20+1. 20+4.
(28) 14. 3.2. Wall Characteristics. Some relevant characteristics of RC walls of the five damaged buildings are summarized in this section. The wall characteristics considered are: wall length, wall thickness, ALR, ratio, and reinforcement ratios. For this purpose walls of the first two stories and the basements - where damage usually concentrated– were considered. For this survey, 27, 20, 14, 22 and 4 critical walls were considered for CM, AH, PR, AA and EM buildings respectively. Some examples of the induced damage on these walls are show in Figure 3.2. The wall thicknesses of the four buildings located in Concepción range between 15 and 20 cm and, for the EM building, the range was between 17 and 25 cm.. (a). (b). (c). (d). Figure 3.2. Damaged walls in (a) CM (b) AH (c) PR (d) AA buildings.
(29) 15. The vertical loads and the. ratios were obtained from finite element models of the. buildings using ETABS software (Computers & Structures, 2011) and following the Chilean Code NCh433 (INN, 2009). The finite element models were constructed by Westenenk et al. (2012). The. ratio is an important property for the behavior of. walls, where M is the moment at the base of the wall, V the shear load and lw the length of the wall. If this ratio is small the wall is considered squat and probably will exhibit a shear mode of failure (Hidalgo et al., 2002). This ratio was calculated at the base of the walls using the finite element models. The seismic load following the NCh433 (INN, 2009) was considered for the calculation of M and V. The wall length ( ) was obtained from the structural drawings of the buildings. The average of the mean. ratios of. the selected walls of damaged buildings is 2.02, which means that these walls are not squat, and hence, flexural behavior is relevant. The. ratios of walls from the. damaged buildings and the average ratio are shown in Figure 3.3.. Figure 3.3.. ratio of walls of damaged buildings.
(30) 16. The ALRs of the surveyed walls of the damaged buildings for gravitational load considering dead load and 25% of live load (D+0.25L) are shown in Figure 3.4. The average of the mean ALRs of walls of the five damaged buildings is 0.18. The ratios are distributed mostly between 0.1 and 0.25 in CM, AH and PR buildings. The average ALR of the walls is 0.13, 0.17, 0.13, 0.11, and 0.36, for buildings CM, AH, PR, AA, and EM, respectively.. Figure 3.4. Axial load ratio due to gravity loads in walls of damaged buildings The axial load in walls increases significantly due to the seismic overturning moment (Jünemann et al., 2012). The axial load in the walls induced by an earthquake was estimated using modal spectrum analysis according to NCh433 (INN, 2009). Figure 3.5 shows the ALRs of walls of damaged buildings under gravitational plus earthquake loads (D+0.25L+E). The average of the means of the five buildings is 0.27, which is 50% larger than that with only gravitational loads. The average ALR of the walls is 0.20, 0.28, 0.27, 0.19, and 0.42, for buildings CM, AH, PR, AA, and EM, respectively. Figure 3.5 shows that about 10% of the walls are subjected to ALRs higher than 0.35, which is the limit imposed after the 2010 Chile Earthquake (DS 60, 2011) for ultimate loads. Also, only 20% of the walls exhibit ALRs lower than 0.15 which are unlikely to trigger.
(31) 17. compression-controlled failure modes and about 70% of the walls exhibit ALRs between 0.15 and 0.35. This range of ALRs was considered in the experimental program described later in Chapter 4. However, if the load combination 1.2D+1.0L+1.4E is considered in this analysis according to NCh3171 (INN, 2010) the average of the mean ALR of the five buildings increases to 0.38 and the percentage of walls with ALR higher than 0.35 increases to 37%.. Figure 3.5. Axial load ratio due to gravity and earthquake loads in walls of damaged buildings The comparison between the inelastic design spectrum and the elastic response spectrum from ground motions recorded near the four buildings located in Concepción is summarized in Table 3.2. The fundamental period of the buildings, soil type, the ordinate of the elastic design spectrum (Sae) at the fundamental periods, and the ordinate of the response spectrum at the fundamental period of the buildings corresponding to the closets sites with a recorded ground motion, were obtained from Westenenek et al. (2012). Table 3.2 also summarizes the strength reduction factor (R*) according to the design code and the factored inelastic design spectrum (1.4 Sae/R*). If an elastic behavior of the buildings is assumed, which is a reasonable assumption before the brittle.
(32) 18. damage occurred in RC walls, the response spectrum ordinate is 12.0, 5.4, 2.1, and 12.1 times the factored inelastic design spectrum. for buildings CM, AH, PR and AA,. respectively. Therefore, the actual axial load demands in RC walls during the 2010 earthquake may be even larger than those estimated previously, Table 3.2. Comparison between inelastic design spectrum and response spectrum for buildings located in Concepción. Building Building Soil period. Elastic design Strength. Type spectrum (m/s2). (sec). reductio n factor. Inelastic design Response spectrum. spectrum. (m/s2). (m/s2). CM. 0.80. II. 4.05. 8.8. 0.65. 7.74. AH. 0.78. III. 10.49. 6.3. 2.31. 12.56. PR. 0.50. III. 12.11. 5.2. 3.29. 7.06. AA. 0.71. II. 4.79. 8.5. 0.79. 9.51.
(33) 19. The vertical boundary reinforcement ratios (. ) of the surveyed walls of the. five buildings are summarized in Table 3.3. The table includes for each building, the minimum, maximum, mean and the standard deviation of the boundary reinforcement ratios. The average. of the means of the five buildings is 0.0043. The largest mean ratio. is 0.0057 for CM building and the lowest mean ratio is 0.0022 for AH building Table 3.3. Vertical boundary reinforcement ratio of walls of the damaged buildings Building. Mean. Max. Min. St. Deviation. CM. 0.0057. 0.0123. 0.0009. 0.0032. AH. 0.0022. 0.0051. 0.0004. 0.0011. PR. 0.0045. 0.0089. 0.0005. 0.0030. AA. 0.0040. 0.0096. 0.0016. 0.0019. EM. 0.0051. 0.0086. 0.0008. 0.0030. 0.0043. 0.0123. 0.0004. 0.0025. The vertical distributed reinforcement ratios (ρl) of the walls of damaged buildings are summarized in Table 3.4, where the average ratio of the five buildings is 0.0108. AH building has the highest average ratio (0.0249) and the maximum ratio in a single wall is 0.0327, which is about 13 times the minimum reinforcement ratio of 0.0025 required by the ACI 318-11 (2011). The high average ρl in building AH seems to compensate the low average ratio of vertical boundary reinforcement (ρ=0.022 in Table 3.3). EM building also has a high ρl=0.0134 compared to the other three buildings (CM, PR and AA) whose average is 0.0053..
(34) 20. Table 3.4. Vertical distributed reinforcement ratio of walls of the damaged buildings Building. Mean. Max. Min. St. Deviation. CM. 0.0061. 0.0224. 0.0025. 0.0061. AH. 0.0249. 0.0327. 0.0169. 0.0065. PR. 0.0050. 0.0168. 0.0027. 0.0048. AA. 0.0048. 0.0268. 0.0020. 0.0070. EM. 0.0134. 0.0236. 0.0075. 0.0063. 0.0108. 0.0327. 0.0020. 0.0061. The horizontal reinforcement ratios (ρt) of the walls of the damaged buildings are summarized in Table 3.5, where the average ratio of the five buildings is 0.0045 which is about 1.8 times the minimum reinforcement ratio of 0.0025 required by the ACI 31811 (2011). Table 3.5 shows that the standard deviation is relatively small, the maximum ratio is 0.0151 in PR Building and the minimum ratio is 0.0025 in CM and AA. Table 3.5. Horizontal reinforcement ratio of walls of the damaged buildings Building. Mean. Max. Min. St. Deviation. CM. 0.0032. 0.0039. 0.0025. 0.0005. AH. 0.0068. 0.0075. 0.0052. 0.0011. PR. 0.0050. 0.0151. 0.0033. 0.0041. AA. 0.0032. 0.0057. 0.0025. 0.0009. EM. 0.0043. 0.0062. 0.0025. 0.0015. 0.0045. 0.0151. 0.0025. 0.0016.
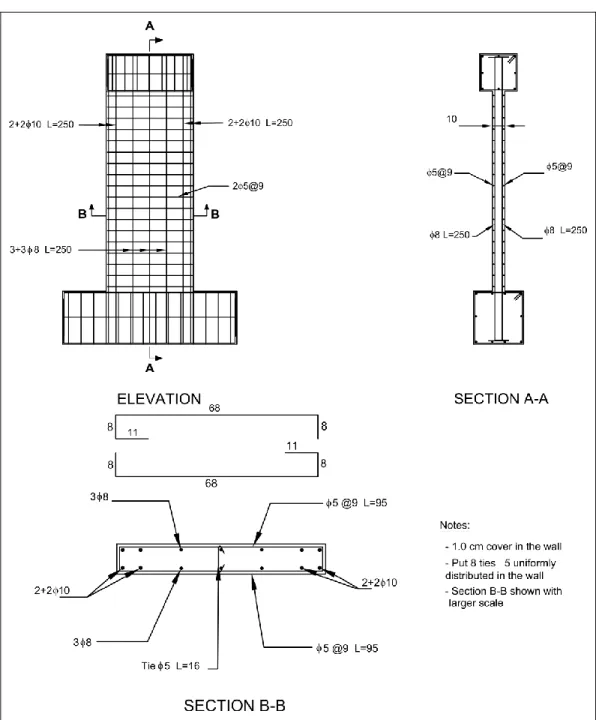
(35) 21. From the described survey it can be summarized that the thickness of the walls from damaged buildings varied from 15 cm to 25 cm and the average M/Vlw ratio was 2.02, which implies that flexural behavior was relevant. The walls were subjected to relatively high ALRs which made them susceptible to brittle compression controlled behavior. The walls were provided with large vertical reinforcement ratios to provide strength but inadequate confinement was provided. The average wall properties of each of the five damaged buildings studied are shown in Table 3.6 Table 3.6. Average wall properties of damaged buildings. Building. D+L ALR. D+L+E ALR. ρ. ρl. ρt. CM. 2.96. 0.16. 0.24. 0.0057. 0.0061. 0.0032. AH. 1.36. 0.17. 0.28. 0.0022. 0.0249. 0.0068. PR. 2.35. 0.13. 0.27. 0.0045. 0.0050. 0.0050. AA. 2.23. 0.11. 0.19. 0.0040. 0.0048. 0.0032. EM. 1.19. 0.29. 0.34. 0.0051. 0.0134. 0.0045. Average. 2.02. 0.17. 0.26. 0.0043. 0.0108. 0.0045. 3.3. Analytical Study of Selected Wall. An analytical study of one of the RC walls considered in the previous survey, which failed during the earthquake, is described in this section. This analysis is aimed to explain the observed damage. The wall is located in CM building and the failure is shown in Figure 3.6, where a horizontal region of concrete crushing and longitudinal bars buckling is observed. This flexural-compressive failure mode seems to be attributed to high axial loads, poor confinement and inadequate transverse reinforcement detailing. The selected wall is located in the second story in axis „E‟ (Figure 3.7) of CM building which was designed with H30 concrete (. ) and A630-420H steel (fy.
(36) 22. ). The period of the CM building in the Y-axis (direction of the E axis and the selected wall) and in the X-axis are 0.8 sec and 0.56 sec, respectively. The length of the selected wall is 220 cm, the thickness 20 cm, the cross section 2.67 m2, and the story height 2.6 m. The building has a significant irregularity; the floor area of the second story is considerably larger than that of the first story. Therefore, high loads are concentrated in walls of the second story. In order to resist these high loads, this wall was strengthened with additional 28 ϕ 12 mm vertical bars in the second story. These bars were added in between the vertical reinforcement of 30 ϕ 16 mm bars that this wall has along the height of the building (Figure 3.8). The transverse reinforcement consists in ϕ 10 mm bars spaced at 20 cm. These reinforcement results in reinforcement ratios of ρl=0.021 and ρt=0.0040. The. ratio is 16.7, where s. is the spacing between transverse bars and db is the diameter of the smallest longitudinal bar. This high. ratio suggests that reinforcement bar buckling should have happened. immediately in the next compressive cycle after yielding in tension (Monti & Nuti, 1993; Rodriguez et al., 1999).. Figure 3.6. Observed failure in selected wall.
(37) 23. Figure 3.7. Elevation view of axis E from CM building and Plan view of second story from CM building. Figure 3.8. Selected wall cross section A fiber-model for RC sections was developed in MATLAB (Mathworks, 2010) in order to obtain the moment-curvature relationships of RC walls. The stress-strain constitutive models for concrete and steel were the ones proposed by Karthik & Mander (2011).
(38) 24. where the model for concrete in compression depends on the confinement reinforcement of the section. Because of the lack of confinement in the selected wall, low effective confining stresses are obtained in the section following Mander‟s procedure (Mander et al., 1988). The highest confinement stress in the selected wall is less than 0.1% of the concrete strength, thus, the resulting confinement ratio is. . Therefore, only. unconfined concrete was considered in the model (Figure 3.9). The peak and ultimate stresses of the concrete are 25 MPa and 12 MPa at strain levels of 0.0019 and 0.0036 respectively, and a failure strain of 0.0095 was considered for concrete. For the reinforcing steel (Figure 3.9), nominal properties were considered with fy= 420 MPa, fu= 630 MPa and a modulus of elasticity of 200,000 MPa. Additionally, a strain hardening modulus of 5,000 MPa, a hardening strain of 0.01 and an ultimate strain of 0.16 were considered. These last three parameters were obtained from average properties of the reinforcing bars tested for the experimental campaign conducted as part of this research project (Appendix A.2).. Figure 3.9. Material stress-strain relations (Karthik & Mander, 2011) The axial loads of the wall were obtained from the finite element model of the building using ETABS (Computers & Structures, 2011). The wall is subjected to axial loads of 1364 kN, 265 kN and 1775 kN for dead, live and earthquake loads, respectively. The earthquake load is obtained from a modal spectral analysis following NCh433 code (INN, 2009). The shear load and the bending moment at the base of the wall in the second story for the earthquake loads are 153 kN and 266.6 kN-m, respectively..
(39) 25. Therefore, the. ⁄. ratio is 0.67. This small ratio suggests that the wall behavior. should be controlled by shear action. However, the failure (Figure 3.6) does not show diagonal shear cracks, but shows an horizontal failure which is induced by concrete crushing and vertical bar buckling. The total axial load of the wall under service condition during an earthquake is estimated as. kN, which is. equivalent to an ALR of 0.29. Considering ALRs of 0.1, 0.2 and 0.3 (axial loads of 1,100 kN, 2,200 kN and 3,301 kN respectively) and the described material properties, the moment curvature relationship was computed for the wall section (Figure 3.10). The moment curvature relation that corresponds to 0.3 ALR can be supposed as the behavior of the selected wall.. The yield curvature is estimated as 1.8E-05 1/cm and the ultimate curvature as 7.5E-05 1/cm. Therefore, the estimated curvature ductility of the wall is only 4.14 and a negative slope in the moment curvature relationship is predicted beyond the peak moment strength of 4310 kN-m. This curvature ductility is relatively small and is not consistent with the load reduction factor (R*) of 6.42 that is used in the transverse direction according to NCh433 (2009).. Figure 3.10. Moment-curvature relationship for the analyzed wall.
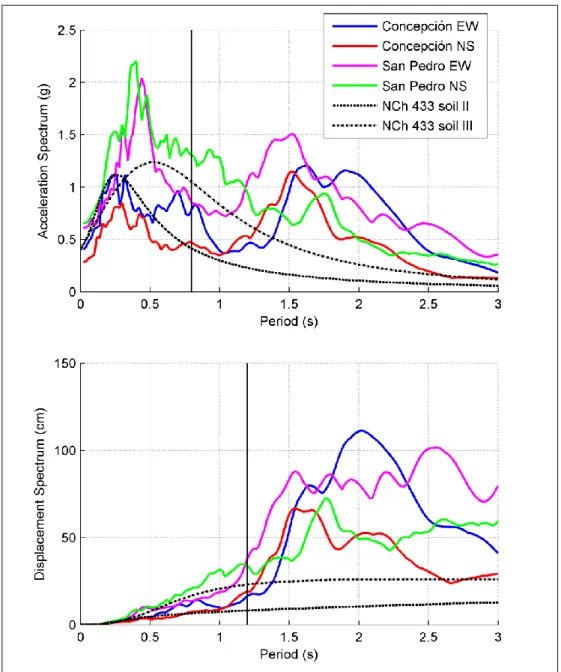
(40) 26. The strength of the selected wall was verified according to NCh433 (INN, 2009), where the earthquake loads are obtained from a modal spectral analysis and the ultimate loads are obtained using the load combinations of NCh3171 (INN, 2010). The interaction diagram of moment and axial load of the selected wall (Figure 3.11) shows that the ultimate loads are smaller than the factored capacity, thus, the wall was designed adequately. Additionally, the design earhquake at the fundamental period of the building (0.8 sec) was comparable to the ground motions recorded at the vecinity of the building. The factored pseudo acceleration for soil type III, which was the soil classification of the building, is. , which is 12% larger than the maximum pseudo. acceleration from the two ground motion recorded at the vecinity of the building (1.3g for San Pedro Ground motion NS compoment; Figure 3.12).. Figure 3.11. Interaction curve for selected wall.
(41) 27. Figure 3.12. Pseudo-Acceleration and displacement spectrum for 2010 ground motions and NCh 433 (INN, 2009) spectrum A plastic hinge approach was used to estimate the roof displacement capacity of the building considering a wall height of 40.70 m (hw) measured from the bottom of the second story to the roof (Figure 3.13(a)). If a plastic hinge length of cm is considered, the yield and ultimate roof displacement are 99.9 cm (2.46% drift) and 125.1 cm (3.07% drift) respectively, and the provided displacement ductility is 1.25..
(42) 28. The estimated roof displacement demand for the E-W direction (same as the axis of the selected wall) of CM building during 2010 Earthquake is 49.1 cm. This displacement is estimated as. following DS 61 (2011) recommendations. In this. calculation Sd is obtained from the maximum displacement spectra of the two ground motions recorded near the building (Figure 3.12) considering Tcr = 1.2 s (1.5 times Ty = 0.8 s). From this analysis it can be conlcuded that the roof displacement capacity of the wall using the plastic hinge approach is 2.5 times the displacement demand. This is not consistent with the failure of the wall and the plastic hinge approach does not correlate with the oberved damage. The ACI318 (2011) approach to estimate the roof displacement of a cantilever wall is shown in Figure 3.13(b) where the elastic cuvature is neglected. If the displacement demand (δu = 49.1 cm) is considered in this equation, the curvature demand for the wall is φu = 1.09E-04 1/cm, which is impossible to attain for this wall whose ultimate curvature is estimated as 7.5E-05 1/cm. If the ALR of this wall is reduced from 0.29 to 0.1, the ultimate curvature capacity increases to 1.09E-04, and the displacement demand is possible to attain in this case. However, Wallace et al. (2012) suggests that for poorly detailed walls, which is this case, the plastic hinge length should be smaller than Hence, considering a platic hinge length of. ⁄ .. cm, which resulted in an. accurate prediction for the ultimate displacement for Takahasi et al. (2013), the curvature demand increases to 2.4E-04 1/cm, which is impossible to attain for the selected wall even in the case with ALR of 0.1. This analysis shows that considering that the wall failed, the ACI approach for estimating the roof displacement capacity of a wall of a Chilean building seems to be more realistic than the platic hinge approach. Although the wall satisfy the design strength requirements, it is not able to sustain the displacement demand from the 2010 Earthquake. It is important to highlight the high potentitial for bar buckling of this wall ( ⁄. ) which was not considered in the. fiber model. The cyclic loading during the earthquake should have triggered an early bar buckling on the onset of yielding, which results an even more brittle and dangerous behavior than that predicted by the fiber model..
(43) 29. V. V. (5). (a). (b). Figure 3.13. (a) Plastic hinge and (b) ACI318 approach for estimation of roof displacement of a cantilever wall The analysis performed for the selected wall suggest that the strength provided to the wall was adequate according to the seismic code and that the actual ground shaking was comparable to that of the design code. However, the provided ductility was not consistent with the load reduction factor used in the design of the building. The high ALR, the inadequate concrete confinement, and the lack of restrain for longitudinal bar buckling compromised the displacement capacity of walls and a brittle compressive damage was generated..
(44) 30. 4. EXPERIMENTAL PROGRAM Three identical RC wall specimens (W1, W2 and W3) were designed with representative characteristics obtained from the survey of RC walls from damaged buildings performed in Chapter 3. The design and construction of the wall specimens and the test setup including instrumentation and load application protocol are described in this Chapter. Double-cycle displacements with increasing amplitude and constant ALR of 0.15, 0.25 and 0.35 were applied to specimen W1, W2 and W3 respectively in order to reproduce the observed failure in walls during the 2010 Chile Earthquake and evaluate the influence of axial load in the seismic behavior of the walls.. 4.1. Specimen Design. Based on the survey of walls from damaged buildings conducted in Chapter 3 a prototype RC wall was defined for conducting the experimental program. A ½-scale was selected for the wall prototype due to the maximum loads that can be applied with the available equipment at Pontificia Universidad Catolica de Chile. The wall cross section is 70 cm wide, 10 cm thick and the wall height is 160 cm. Thus, the. ratio of the. wall prototype is 2.3. The wall is designed with base and top RC beams to connect it to the loading frame. The base beam is 140 cm wide, 40 cm thick and 42.5 cm high. The top beam is 70 cm wide, 30 cm thick and 30 cm high. The geometry of the wall specimen is shown in Figure 4.1. The lateral load was applied at mid height of the top beam (at 175 cm from the base), therefore, the resulting. ratio of the wall. specimen is 2.5. This ratio is slightly higher than the average ratio of the walls from the survey but it is perfectly in the actual range in practice and also was selected in order to ensure a flexural-compressive mode of failure as observed in most damaged walls during the 2010 Chile Earthquake. Squat unconfined Chilean walls have already been studied by Hidalgo et al. (2002) and thus a shear failure mode is intended to be avoided in this project..
(45) 31. Figure 4.1. Wall specimens geometry (in cm) The vertical boundary reinforcement is 2+2 ϕ10 mm (ρ=0.0045) and the distributed reinforcement is ϕ8 mm bars spaced at 140 mm (ρl=0.0072). For the horizontal distributed reinforcement ϕ5 mm bars spaced at 90 mm (ρt=0.0044) are used. The selected reinforcement results in an s/db ratio of 9 which is within the typical range of 8 to 11 in Chilean walls (Wallace et al., 2012). Additionally, 8 ϕ5 ties in the central vertical bar are distributed uniformly throughout the height of the wall in order to follow Chilean construction practice. The reinforcement ratios for vertical boundary and horizontal reinforcement ratio are similar to the average ratios obtained from the survey of damaged walls (Table 3.3 and Table 3.5). The ratio of the vertical distributed reinforcement is smaller than the average of the survey, because the mean ratios of two buildings are considered excessively high compared to the other three buildings (Table 3.4). Therefore, a ratio of 0.0072 seems to be reasonable for the vertical distributed reinforcement. The reinforcement detailing of the wall specimens is shown in Figure 4.2. The horizontal reinforcement detailing follows typical construction practice in Chile which consists on hoops with 90-degree hooks outside the vertical bars which are not.
(46) 32. anchored into the concrete core and become ineffective after spalling of concrete cover (Wallace et al., 2012). The reinforcement detailing of the base and top beams, not detailed in Figure 4.2, consist on ϕ12 mm longitudinal bars with intermediate ϕ10 longitudinal bars and ϕ8 mm stirrups spaced at 10 cm. A summary of relevant characteristics of the surveyed walls and the specimens are shown in Table 4.1.. Figure 4.2. Wall specimens reinforcement detailing.
(47) 33. Table 4.1. Characteristics of the surveyed walls and wall specimens. 4.2. Property. Average. Max. Min. M/Vlw ratio. 2.02. 11.67. 0.19. ρ. 0.0043. ρl ρt. St. Deviation Specimens 2.01. 2.5. 0.0123 0.0004. 0.0025. 0.0045. 0.0108. 0.0327 0.0020. 0.0061. 0.0072. 0.0045. 0.0151 0.0025. 0.0016. 0.0044. Wall Specimens Construction. A total of 11 wall specimens were built in the laboratory of the Structural and Geotechnical Engineering Department at Pontificia Universidad Católica de Chile. Three of these walls are part of this thesis which is aimed to study the effect of axial load and their design was described in Section 4.1. The other eight walls are not part of this thesis and were built to study the effect of other parameters such as wall thickness, M/Vlw ratio and reinforcement detailing. Pictures of the construction process are shown in Figure 4.3. The wall specimens were built with wooden formwork and the steel bars were bent at the construction site. The concrete of the bottom bases was cast at the construction site using a mixer. Eight days later, the concrete of the walls and top bases was cast using pre-mixed concrete. The specimens were cured with plastic for 7 days at both stages and the finished walls are shown in Figure 4.4..
(48) 34. (a) Wooden formwork. (b) Folding of base reinforcement. (c) Reinforcement of walls. (d) Reinforcement of walls and beams. (e) Wooden formwork assembled. (f) Pre-mixed concrete truck. Figure 4.3. Wall specimen construction process.
(49) 35. Figure 4.4. Wall specimens W1, W2 and W3. 4.3. Material Properties. The concrete of the wall specimens was specified with a characteristic strength of 20 MPa and with a maximum aggregate size of 11 mm. For the reinforcement, A630-420H steel (fy= 420 MPa) was specified for ϕ8, ϕ10 and ϕ12 mm bars, and AT560-500H steel (fy=500 MPa) for ϕ5 mm bars. The properties of concrete and steel were measured in laboratory tests and were considered for the stress strain relations in the pre-test analysis of Chapter 5. For concrete, cylindrical samples with 10 cm diameter and 30 cm height were tested in the laboratory in order to obtain its compressive strength. The details of the test are shown in Appendix A.1. The average concrete strength after 7 and 28 days was fc7 = 14.4 MPa and fc28 = 24.1 MPa respectively. Five larger cylindrical samples with 15 cm diameter and 30 cm height were also tested a day before the first test (260 days after specimen construction) where the average concrete strength was fc’ = 27.4 MPa. This strength is considered as the compressive concrete strength for the axial loads applied in the tests and for the analytical predictions in Chapter 5..
(50) 36. For reinforcing steel (Appendix A.2), three ϕ 8 mm and three ϕ 10 mm bars of A630420H were tested in order to obtain the properties of the vertical bars. Also, three ϕ 5 mm bars of AT560-500H, which were used for the horizontal reinforcement, were tested. The average yield strength, ultimate strength, yield strain, hardening strain, ultimate strain, and strain hardening modulus of each bar type are summarized in Table 4.2. The yield strain was not measured in the test and was considered as ⁄. in order to use the same modulus of elasticity for all the steel. specimens. The ϕ 5 mm AT560-500H bars are not ductile as the A630-420H steel bars, and strains during test were difficult to measure, hence, only yield strength and ultimate strength and ultimate strain are shown for ϕ 5 mm bars in Table 4.2. Table 4.2. Average parameters for AT560-500H (ϕ 5) and A630-420H (ϕ 8 and ϕ 10) Parameter Yield strength (MPa). 608.9. 445.6. 469.2. Ultimate strength (MPa). 667.7. 598.9. 675.7. Yield Strain. -. 0.0022. 0.0023. Hardening strain. -. 0.0139. 0.0138. 0.057. 0.151. 0.166. -. 4133.6. 5430.9. Ultimate strain Strain hardening modulus (MPa). 4.4. ϕ 5 mm ϕ 8 mm ϕ 10 mm. Test Setup. The aim of the proposed tests is to apply different levels of constant axial load and equal cyclic incremental lateral loads to each wall specimen. To achieve this, the wall specimens were placed in a steel loading frame. The test setup is shown in Figure 4.5 and Figure 4.6 where the wall is fixed at the base and pinned at the top. The base beam was fixed to the strong floor in order to simulate a rigid foundation (Figure 4.7). The.
(51) 37. horizontal 500kN actuator was pinned at its two sides and was attached to the top RC beam with 4 steel bars that were bolted against 400 x 300 x 30 mm steel plates at each side of the specimen. This connection (Figure 4.8) could transfer the lateral load reversals. At the other end, the horizontal actuator was supported by a steel IN beam which was bolted to the steel frame. As the horizontal load was applied at the center of the top beam, the effective height of the wall specimen is 175 cm. A 50 kN concrete counterweight was connected to the clevis of the horizontal actuator at the specimen side using two pulleys. This counterweight was used to hang the actuator and eliminate the vertical reaction induced by the actuator weight in the specimen. The vertical 700 kN actuator was bolted to the steel frame and connected to the specimen using rollers to allow horizontal displacement of the top beam (Figure 4.9). Therefore, the P-delta effect was included in the test setup. The out-of-plane displacement of the wall specimens was restrained with rolling supports that were connected to a steel I beam at each side of the top beam (Figure 4.5).. Figure 4.5. Test setup. Lateral view shown in higher scale..
(52) 38. Figure 4.6. Test Setup (picture). Figure 4.7. Fixed base beam for wall specimens.
(53) 39. Figure 4.8. Horizontal actuator attached to the top beam. Figure 4.9. Vertical actuator and rolling supports.
(54) 40. 4.5. Instrumentation. The specimens were instrumented with 2 load cells, 14 displacement transducers, and 16 strain gauges attached to the reinforcement bars, and also using a photography camera to conduct image correlation processing in future studies. Loads cells were connected to both horizontal and vertical actuators in order to measure the applied loads. The displacement transducers were installed in the wall specimens to measure displacements and to obtain curvatures. The channel configuration and list of load cells and displacement transducers are shown in Figure 4.10 and Table 4.3, respectively. The strain gauges were used in each specimen to measure strains in the reinforcing steel bars and were installed during the construction of the wall specimens. The strain gauge configuration is shown in Figure 4.11 where V1, V2, V3, V4, V5, V6 and V7 were installed in the vertical bars through the wall length; V1M, V1T, V7M and V7T were installed at the boundary vertical bars to measure strains at higher levels of V1 and V7 bars respectively; and H1E, H1W, H2E, H2W and HT were installed in the horizontal steel bars. For the image correlation method, the wall was painted with small black spots (Figure 4.12) and a high resolution digital camera was installed at the north of the specimen. The camera took pictures during the tests every 5 seconds and adequate light was provided to the specimen. The MATLAB (MathWorks, 2010) image correlation toolbox was used to process the pictures and measure displacements along time..
Figure


+7


Documento similar
1) The implementation of a planning and seismic strategy with fast action protocols is necessary. These protocols should incorporate damage assessment forms, which
In this paper, the influence of imperfection on the buckling load is studied for the case of shells of different geometries (such as spherical dome, barrel vault and
With the Wavelet Transform applied to the moving load induced response time his- tory of the bridge, the damage is localized by the 3D contour plots of the wavelet coe±cient and
2) We want to understand what is the concrete influence of the previous knowledge of the Pokemon universe on the gamer experience – we will take in account the tv
In the “big picture” perspective of the recent years that we have described in Brazil, Spain, Portugal and Puerto Rico there are some similarities and important differences,
The values of the of corrosion rate corroborate the active passive state of the reinforce of 12 of the 18 rods of the exposed side, given that in 6 of them, two of the beam 5 of
Technical report, NCEER-89-0033, National Center for Earthquake Engineering Research, State University of New York at Buffalo.. Brencich, A., y
vulnerability to the influence of Concrete Significant Others, which is manifested in more frequent recognition of significance of ethnic and spiritual leaders and
