LINKING PHYSIOLOGY, CLIMATE, AND SPECIES DISTRIBUTIONAL RANGES
15
0
0
Texto completo
(2) 17 LINKING PHYSIOLOGY, CLIMATE, AND SPECIES DISTRIBUTIONAL RANGES Francisco Bozinovic1 and Daniel E. Naya2 1 Departamento. de Ecología and Center of Applied Ecology and Sustainability (CAPES), Facultad de Ciencias Biológicas, Universidad Católica de Chile, Santiago 6513677, Chile 2 Departamento de Ecología y Evolución, Facultad de Ciencias, Universidad de la República, Montevideo, Uruguay. INTRODUCTION “As an ecological problem, the question of why a species has a restricted distribution, given its present physiological and other features, can be answered, even if with difficulty. But range limits pose an evolutionary problem that has not been solved” – (Futuyma 1998: 535). The extent to which an organism’s physiology determines its geographic range remains an unresolved problem in integrative biology. In a recent review, Bozinovic et al. (2011) concluded that the cause of geographic range limits is both an ecological problem focused on finding a relationship between physiological traits and geographic distributions, and an evolutionary problem focused on why populations do not evolve to expand their distributions. For example, the analysis of how physiological traits vary along a geographical range is considered a powerful approach for evaluating the selective pressures driving the evolution of physiological diversity (e.g., Spicer & Gaston 1999; Chown et al. 2004), but can also be viewed as a constraint determining the limits on geographic ranges (Bozinovic & Rosenmann 1989; McNab 2002). The variation in physiological traits across a gradient can also reflect evolved or plastic responses to the environment, making it difficult to know Integrative Organismal Biology, First Edition. Edited by Lynn B. Martin, Cameron K. Ghalambor, and H. Arthur Woods. © 2015 John Wiley & Sons, Inc. Published 2015 by John Wiley & Sons, Inc.. 277.
(3) 278. LINKING PHYSIOLOGY, CLIMATE, AND SPECIES DISTRIBUTIONAL RANGES. what the causal relationship are; do evolved physiological tolerances limit the environments an organism can occupy, or do organisms occupy and acclimatize to the environments in which they are found (see also Gaston 2003)? Finally, physiological tolerances to the abiotic environment may also influence the outcome of biotic interactions such as competition (see Chapter 18, this volume), and in turn shape species distributions and patterns of biodiversity along environmental gradients. Thus, identifying the specific factors that determine the geographic range of populations and species remains a difficult challenge. Nevertheless, we know the limits to distributional ranges must ultimately be the consequence of complex interactions between species-specific physiological, phenological and ecological traits, as well as dispersal ability and ecological interactions between species (Bozinovic et al. 2011). We also know that many of the underlying traits may be phylogenetically conserved amongst related species, which could also affect the ability to colonize new environments (Bozinovic et al. 2011). The relatively new discipline named macrophysiology seeks to incorporate these complicating factors that span different disciplines (e.g., physiology, ecology, evolution) to explain how levels of environmental variability encountered over large spatial scales shape physiological traits, and how physiology can provide mechanistic answers to macroecological patterns (Gaston et al. 2009). This interdisciplinary convergence compares physiological features between individuals possessing different geographical distributions and provides a conceptual framework for understanding how physiographic patterns are related to the mechanistic responses underling these large-scale patterns (Gaston et al. 2009). We take such a macrophysiology approach here and review what is known about how climatic variation shapes physiological traits and in turn how this can help explain distributional range limits. Over the last decade a number of climate-based hypotheses have been put forward to explain variation in the distributional ranges of species and populations. These hypotheses typically use spatial and temporal changes in temperature to predict geographic ranges. For example, the annual range in temperature (the climate variability hypothesis), the lowest minimum or maximum temperature (the climate extreme hypothesis) or the average temperature over some time period (the optimal climate hypothesis) can all be used to build predictive models of geographic range size (Pither 2003). These hypotheses all assume that variation in physiological traits across latitude and altitude reflect on organisms tolerance (Spicer & Gaston 1999) and use the intrinsic physiological properties of species to predict their responses to climatic variables and how it may affect the geographic range of assemblages, species and populations (e.g., Addo-Bediako et al. 2000; Somero 2005; Compton et al. 2007; Calosi et al. 2010). Consequently, in this chapter, we evaluate what is known of how geographic range size and distributional limits can be shaped by physiological capacity, tolerance, and plasticity (see Box 17.1 for definition of terms). We also consider the importance of understanding the proximate mechanisms through which climatic variability interacts with the physiological function to generate macrophysiological patterns. We end the chapter with some thoughts on future directions that may lead to advances in our understanding of the physiological basis for geographic distributions.. LIMITS TO GEOGRAPHIC RANGES: EXAMPLES INVOLVING CAPACITIES AND TOLERANCES One of the most commonly invoked explanations for a link between climatic variability and geographic ranges is Rapoport’s rule (see Stevens 1989), which states that when the latitudinal extent of the geographic ranges of organisms is plotted against the latitude middle.
(4) LIMITS TO GEOGRAPHIC RANGES: EXAMPLES INVOLVING CAPACITIES AND TOLERANCES. Box 17.1. Physiological tolerance: Organism exhibit different patterns in dealing with environmental variability. They may avoid them by behavioral traits or they may allow to be exposed to the environment and thus tolerate it. They are two groups of tolerators: (a) some may conform to changes by follows the external environmental conditions, and (b) some may regulate their internal state to maintain independence (within limits) of the environment. This may occur as a result of acclimatization/acclimation (see below) but also by selection of more tolerant or capable genotypes. For instance, animals vary in their tolerance of varying body temperatures and consequently in the temperatures that elicit acclimatory response Physiological range: A measure of the overall spread of physiological variation in relation to environmental factors. Physiological plasticity: is the capability of an organism to change its physiology in response to changes in the environmental variables; when these changes are reversible in time the concept of physiological flexibility is commonly used. Plasticity is a pervasive trait that can be extended equally to both physiological limits (tolerance) and performances (capacities) Acclimation: is the physiological adjustment to cope with variable environmental conditions under laboratory conditions. Acclimatization: is the process in which the physiology under field conditions is adjusted to cope with change in environmental variables, allowing to maintain performance and homeostasis.. point, a simple positive correlation is found. Stevens (1989)– based on previous work done by Janzen in 1967 (see below) – suggested that the variability among species’ physiological tolerance level is the possible explanation for this pattern, what became later known as the climatic variability hypothesis (CVH). Specifically, this hypothesis posits that: (1) as the range of climatic fluctuation experienced by terrestrial animals increases with latitude (or altitude), individuals at higher latitudes (or altitudes) require a broader range of tolerances or greater acclimation abilities to persist at a site (see Box 17.1); (2) the broader range of tolerance or the greater acclimation abilities, in turn, allow species to occupy more habitats and then to become more widely distributed (Janzen 1967; Stevens 1989; Gaston 2003; Chown et al. 2004). In other words, for terrestrial animals, there is expected to exist a match between levels of climatic variability experienced (typically increasing with increased latitude or altitude) and the width of their thermal tolerance range and/or their acclimation abilities (Compton et al. 2007). Note that the assumption to link the CVH with the Rapoport’s rule is that geographic range is maintained only by differences in physiological tolerances or acclimation abilities. However, in most cases it is difficult to determine whether current physiological tolerance ranges and/or acclimation ability are the byproduct of local adaptation after colonization to a new climate or the driving force allowing changes in species distribution (Gaston 2003). Thermal environmental conditions hold considerable significance for most levels of biological hierarchies, and thus, thermal physiology may be a significant factor underpinning the ecological and evolutionary success (see Chapter 14, this volume). Not surprisingly, thermoregulatory capacities have often been invoked to explain the distribution of endothermic animals. For instance, Root (1988) suggests that the Northern boundary of the winter distribution of several passerines species is related with the annual minimum. 279.
(5) 280. LINKING PHYSIOLOGY, CLIMATE, AND SPECIES DISTRIBUTIONAL RANGES. temperature isotherm, in such a way that the metabolic rate at this distribution boundary is close to 2.5 times the basal metabolic rate (BMR). More recently, Humphries et al. (2002) suggest that the distribution of the little brown bat in North America is constrained by thermal effects on hibernation energetics, and provide a mechanistic explanation of how energetics, climate, and distribution are related. In addition, Lovegrove (2000) showed that Nearctic and Palearctic mammals had higher BMR than, their Afrotropical, Australasian, Indomalayan, and Neotropical counterparts. This author explained these patterns with a model describing geographical variance in BMR in terms of the influence of climate variability along geographic ranges and zones (see also Speakman 2000; Lovegrove 2003; Naya et al. 2013a). The relationships between geographic distributions and physiological traits have also been complimented by comparative physiological studies of species from different environments. For example, Rezende et al. (2004) and Bozinovic and Rosenmann (1989) demonstrated a significant correlation between maximum cold-induced metabolic rate (MMR) of rodent species and the environmental temperature from which they came from. Also, Rodriguez-Serrano and Bozinovic (2009) analyzed the diversity of physiological responses in nonshivering thermogenesis (NST) among rodents from different biogeographic zones, and found a negative correlation between NST and ambient temperature, suggesting that selection may act to shape thermoregulatory performance (Figure 17.1). Collectively, these results put forward that temperature is an important selective pressure not only on basal metabolic rates in endotherms, but also on maximum thermoregulatory capabilities. In line with this, biogeographic analyses of passerine birds demonstrate that suboscines are dominant in South America, whereas oscines are dominant elsewhere. One hypothesis for oscine “superiority” is that oscines hold higher metabolic capacities than suboscines, and this favors oscines in most geographic areas (Swanson & Bozinovic 2011). Specifically, Swanson and Bozinovic (2011) tested the hypothesis by comparing MMR between oscines and suboscines using conventional and phylogenetically corrected approaches. They found that oscines have generally higher cold-induced maximum metabolism than suboscines, which suggests that metabolic capacity is one factor influencing the evolution of broad biogeographical patterns in passerines (Swanson & Bozinovic 2011). Lastly, it is important to note that since higher or lower values of metabolic rates among endothermic species are associated with acclimation to temperature and photoperiod, a component of phenotypic plasticity may partially account for all these. 0.5. Residuals of NST. Figure 17.1. Correlation between mean minimum habitat temperature and the residuals of the relationships between body mass and nonshivering thermogenesis or NST (mass-independent NST) among rodents species.. 0.0. Statistical parameters are r = −0.41, P = 0.009. Source: Modified from Rodriguez-Serrano, E. & Bozinovic, F. (2009) Interplay between global patterns of environmental temperature and variation in non-shivering thermogenesis of. −0.5 −60 −50 −40 −30 −20 −10 0 Minimum temperature (°C). 10. rodents species across large spatial scales. Global Change Biology, 15, 2116–22..
(6) LIMITS TO GEOGRAPHIC RANGES: EXAMPLES INVOLVING TOLERANCES AND PLASTICITY. large-scale biogeographical patterns. However, a gross comparison of current data on intra and inter-specific variability on BMR indicates that the inter-specific component of variation is greater than the intra-specific component (Naya et al. 2013b). This suggests that all of the above mentioned patterns are likely due to differences among species in their physiological capacities more than in their physiological plasticity (see also below). The macrophysiological patterns between climate, temperature, and the thermal physiology of ectotherms provides an interesting and complimentary contrast to those of endotherms. The classic metabolic cold adaptation hypothesis (Scholander et al. 1953) posits that at equivalent environmental temperature the metabolic rate of species from cold climates is greater than that of their warm climates relatives. The increase in metabolic rate is considered to be adaptive, that is, there is compensation for the short period of favorable environmental conditions for development, growth and reproduction (Clarke 1993; Addo-Bediako et al. 2002). The metabolic cold adaptation hypothesis has also been extended to explain metabolic differences across altitude, latitude and habitat conditions, since it is thought to be a general evolutionary physiological adaptation among ectotherms to compensate for low environmental temperature. Even though several studies support this hypothesis (Chown et al. 1997; Addo-Bediako et al. 2002), some authors have failed to find an increase in metabolic rate at lower environmental temperature in marine organisms (e.g., Clarke 1991). Nevertheless, it is important to point out that there is also a cost to the higher metabolic rate in terms of greater food requirements. In theory the evolution of higher metabolic rates should reflect both the costs and benefits, and may explain why there are exceptions to this hypothesis (see also Chapter 18, this volume). Although factors such as acclimatization and acclimation (Box 17.1), activity level, sex, reproductive status, food intake and experimental technique employed may strongly influence measurements of metabolic rate, the general pattern of increasing metabolic rates with lower environmental temperature, seems to provide a physiological explanation in support of Rapoport’s rule. That is, as the mean temperature experienced by species decreases with latitude, animals require a higher level of metabolic expenditure and hence a broader tolerance to survive and persist in the habitat, and as consequence species can become more widely distributed. One underlying assumption of this hypothesis is that metabolic plasticity lies within a limited range, which is characteristic of each species or population. Yet, the role of physiological plasticity in these kinds of studies has been largely ignored (see below).. LIMITS TO GEOGRAPHIC RANGES: EXAMPLES INVOLVING TOLERANCES AND PLASTICITY As mentioned above, the first part of the CVH posits that as the range of climatic variability increases with latitude, individuals from populations inhabiting higher latitudes require a broader range of physiological tolerances and/or greater acclimation abilities (i.e., greater plasticity) to persist at that site. With regard to the range of physiological tolerance, studies of ectothermic animals do show a strong positive relationship between thermal tolerance range and geographic latitude for several taxa (e.g., genus Drosophila (Levins 1969; Kimura 1988; Hoffman & Watson 1993; Overgaard et al. 2011), diving beetles (Calosi et al. 2008, 2010), insects (Addo-Bediako et al. 2000; Deutsch et al. 2008), porcelain crabs (Stillman & Somero 2000), fish (Brett 1970), amphibians (Brattstrom 1968; Snyder & Weathers 1975), and reptiles (van Berkum 1988; Cruz et al. 2005; Deutsch et al. 2008)). By contrast, comparative studies of endotherms examining latitudinal variation in physiological ranges are. 281.
(7) 282. LINKING PHYSIOLOGY, CLIMATE, AND SPECIES DISTRIBUTIONAL RANGES. still very scarce. Endothermic species can cope with lower temperature, if they have enough food and also the ability to convert this food into heat, which in turn is related with their digestive and metabolic attributes (Naya et al. 2012). Thus, macrophysiological patterns for endothermic animals could be more noticeable for a different set of traits than in ectothermic animals. In line with this, Naya et al. (2012) evaluated the correlation between metabolic scope (cold-induced MMR-BMR) in rodent species and different abiotic variables such as latitude, altitude, rainfall, and temperature. The main result of this work is that, as predicted from the CVH, absolute metabolic scope is positively correlated with geographic latitude (Naya et al. 2012). The prediction that acclimation abilities should increase with latitude or climatic variability also has mixed support, however analyzing physiological flexibility for a population or species tends to be a more complex goal than analyzing their physiological tolerance ranges (see Box 17.1). Consequently, studies designed to evaluate latitudinal patterns in physiological flexibility are scarce in comparison to those analyzing physiological ranges of tolerance. In addition, the former kinds of studies usually have a reduced taxonomic (e.g., one genus or one family) and geographic (e.g., one continent) scope in relation to the latter ones. Probably and as a consequence, latitudinal patterns in physiological flexibility do not support any clear pattern of variation. That is, while some studies suggest a positive relationship between physiological flexibility in metabolic and thermal traits and geographic latitude (e.g., amphibians (Feder 1982), lizards (Tsuji 1988)) others do not (e.g., genus Drosophila (Mitchell et al. 2011; Overgaard et al. 2011); diving beetles (Calosi et al. 2010)). Naya et al. (2008) applied a meta-analytical approach to data of rodents’ small intestine length flexibility distributed along the five continents, under the rationale that flexibility in digestive traits should be connected with metabolic flexibility, and then with thermal tolerance (see above). Naya et al. (2008) found a positive correlation between small intestine length flexibility and latitude, a result that comprises important evidence on the adaptive value of physiological flexibility in small mammals, which is also consistent with the CVH. Finally, latitudinal patterns in plasticity have been recently analyzed for three eco-physiological and three life-history traits in five populations of a plant species (Taraxacum officinale), which inhabit a latitudinal range from 0∘ to 53∘ . Again, a strong correlation between latitude and both plasticity for each specific trait and overall mean was observed (Molina-Montenegro & Naya 2012). The second part of the CVH states that broader ranges of tolerance or greater acclimation abilities allow species to occupy more habitats and then to become more widely distributed. Studies on this topic are still very scarce, but some works suggest that tolerance ranges and physiological flexibility are positively related with species distributional range extension (e.g., genus Drosophila (Kellerman et al. 2009), diving beetles (Calosi et al. 2008), and amphibians (Brattstrom 1970)) or with the number of habits occupied by different species (Naya et al. 2008). For instance, recent works done by Calosi et al. (2008, 2010) found a positive relationship between diving beetles acclimatory ability to heat tolerance and their geographical range, thus showing that widespread species appear to possess a higher degree of plasticity. By contrast, Stillman and Somero (2000) and Stillman (2003) have shown that in porcelain crab species tolerance levels and their related plastic response are negatively related, thus indicating the existence of an physiological trade-off between these traits, both for tolerance to heat and cold. A potential explanation for these contrasting results could be due differences in the evolutionary trajectory of thermal tolerance in diving beetles and crabs (J.H. Stillman, personal communication, in Bozinovic et al. 2011). In any case, it is clear that much more work needs to be done before we understand the relationship between physiological range, physiological flexibility, and species distributional ranges..
(8) PROXIMATE CAUSES BEHIND MACROPHYSIOLOGICAL PATTERNS. PROXIMATE CAUSES BEHIND MACROPHYSIOLOGICAL PATTERNS Interestingly, most of the studies analyzing latitudinal patterns in physiological ranges or physiological flexibility document a greater association with geographic latitude, rather than with climatic variables (Naya et al. 2012). There are three reasons commonly invoked to explain this result. First, latitude is probably a better predictor of long-term regimens of climatic variables than current climate values provided by weather stations (Speakman 2000; Rezende et al. 2004). Second, latitude is correlated with several other environmental factors that are often not assessed, such as climatic (e.g., wind speed), ecological (e.g., day length, environmental productivity), and historical factors (e.g., geographical boundaries) that could affect physiological traits (Rezende et al. 2004; Naya et al. 2008). Third, species included in physiological studies are not present only at the collection site(s), but occur over large areas. Thus, we should not expect adaptation to environmental conditions to be more fine-tuned than adaptation to the conditions taking place over these large areas. Consequently, given the smooth variation of climatic variables in the space, latitude may represent a weighted variable of climatic conditions acting over spatial scales that are much closer to the scale at which adaptation is expected to occur than the conditions at the collection sites (Naya et al 2012; Figure 17.2). These three, not mutually exclusive, arguments may be the reason why many times geographical latitude is a better predictor of physiological ranges and flexibility than local climatic conditions, despite the fact that climatic variables (and not latitude) should be the ultimate factors underlying physiological variation. On the other hand, in some cases physiological patterns are more clearly related with mean values of climatic variables than with variability indexes (e.g., Molina-Montenegro & Naya 2012; Naya et al. 2012). This result appears to be contradictory with the CVH since temperature variability and not temperature mean should be the putative cause of physiological ranges and flexibility. We believe that these differences between theoretical predictions and observed data could be due to several possible explanations. First, the indices of climatic variability that are usually used may be too coarse to reflect the proper variability that organisms have to cope with. For instance, the fact that diurnal variation in temperature at high altitudes in the tropics is close to seasonal variation in the temperate north (Ghalambor et al. 2006) is probably not captured by the climatic variability indexes commonly used, such as annual temperature range or temperature seasonality. Second, behavior may buffer variation in environmental temperature, allowing animals to avoid exposure to extreme temperatures (Huey et al. 2003). For instance, if behavior isolates an organism from one extreme temperature (e.g., maximum temperatures) more than the other one (e.g., minimum temperatures), a better correlation with the variable from which the organism is less isolated than with the temperature range is expected (Figure 17.3). Interestingly, the hypothetical example depicted in Figure 17.3 also illustrates the fact that the final impact of environmental variation on organisms is usually mediated by their behavior, and hence, illustrates how different phenotypic traits are integrated (see below). In any case, current data indicate that it remains unclear to what extent climatic variability or other factors related with latitude, act on the physiological phenotype and account for any observed geographical gradient in physiological range flexibility (Maldonado et al. 2011; Naya et al. 2011). In recent years, some interesting attempts have been made to explore the proximate causes behind geographical patterns in physiological flexibility. For example, Maldonado et al. (2011) analyzed the physiological flexibility within the CVH framework by using a within species comparative approach and tested if there was a positive relationship between digestive flexibility, latitude, climate and diet variability in populations of the rufous-collared sparrows (Zonotrichia capensis) inhabiting desert, Mediterranean, and. 283.
(9) 284. LINKING PHYSIOLOGY, CLIMATE, AND SPECIES DISTRIBUTIONAL RANGES. 18 16. 31 ° 18. 18. 16. 32 ° 13. Tc (°C). 22. 14 12 10 8 6 4. 17. 2 13. 11. r = 0.99. 0 31 33 °. 18 16. 8 6 34 ° Tc (°C). 7. 3. 3. 1. 14 12 10 8 6. 35 °. 4. (A). r = 0.84. 2 0. Temperature. 35. (B). 12. 8. 33 34 32 Geographical latitude (°). 4. 6 8 10 12 14 16 Temperature at sampled sites (°) (C). 18. Figure 17.2. A hypothetical example showing the “spatial scale problem” (see text). Four different species (shown in different colors) each inhabit four different localities (circles) that are connected by migration (arrows); the population of each species that is sampled is marked with an asterisk, and the data above each locality represent a climatic variable, e.g., minimum temperature (A). If the physiological variable under study (e.g., minimum critical temperature, Tc ) is fitted to the entire distributional range – for example, it is equal to the minimum temperature recorded over the entire range – it will be better correlated with latitude (B) than with minimum temperatures at the sampled localities (C). (See plate section for color version.). cold-temperate habitats. In agreement with the CVH, they found a positive relationship between the magnitude of digestive flexibility and environmental variability but not latitude. The greatest digestive flexibility was observed in birds at middle latitudes, which experience the most environmental variability (Mediterranean climate), whereas individuals from the most stable climates (desert and cold-temperate) exhibited little or no digestive flexibility in response to experimental diets. Maldonado et al. (2012) also investigated the relationship between the magnitude of BMR flexibility in response to inter-annual rainfall variability in the same three populations. These authors addressed the question of whether birds from a desert environment are more flexible in BMR than those from nondesert habitats, and found a positive trend between BMR flexibility and rainfall variability. At the same time and following the same rationale, Naya et al. (2011) tested for physiological flexibility in digestive and metabolic traits for three populations.
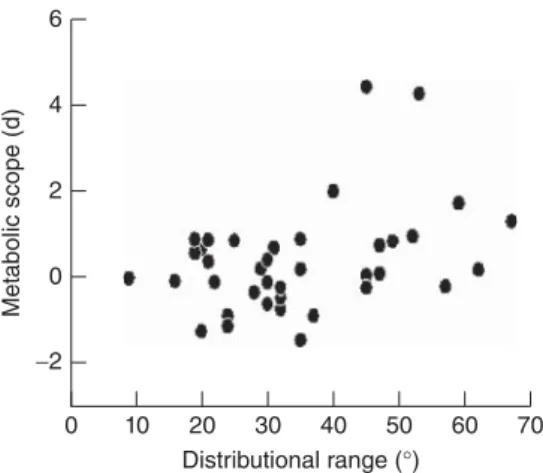
(10) 285. PROXIMATE CAUSES BEHIND MACROPHYSIOLOGICAL PATTERNS. Tmax. Tmin Latitude (A). Tmin Thermal range Experienced thermal range (B). Figure 17.3. An hypothetical example showing the latitudinal change in minimum and maximum temperatures obtained from weather stations (continuous lines) and minimum and maximum temperatures experienced by an organism (dotted lines) (A). Given that, in this example, a behavioral mechanism allows the organism to isolate from maximum temperature more than from minimum temperature, the real thermal range experienced by the organism is better correlated with minimum temperature (open circles) than with the temperature range obtained from weather stations (closed circles) (B).. of the snail C. aspersum for which climatic variability (both in temperature and rainfall) and latitude were inversely correlated. As expected, they found that digestive flexibility was positively related with climatic variability and negatively correlated with latitude. An additional perspective on the relationship between latitude and climatic variability was taken by Naya and Bozinovic (2012) within aquatic systems. They rationed that in aquatic systems, physiological ranges should be related with species distributional range but not with latitude. This is because thermal variability in water is fairly constant along latitudinal gradients, and thus, the only way to increase thermal variability is through increasing distributional range. To test this idea with real data they evaluated metabolic scope (i.e., routine metabolic rate minus standard metabolic rate) in 38 fish species, finding that, as expected, metabolic scope was positively correlated with species’ distributional range (and also marginally correlated with the thermal range within species’ distributional area), but not with species distribution middle point (Figure 17.4). Taken together all these results strongly suggest that, as predicted by the CVH, climatic variability and not latitude is the ultimate factor affecting both physiological flexibility and physiological ranges. To summarize, numerous organisms are able to adjust their physiological abilities following daily and seasonal fluctuations of environmental variables along geographic gradients. Acclimatization can thus allow individual organisms to exploit a broad thermal.
(11) 286. LINKING PHYSIOLOGY, CLIMATE, AND SPECIES DISTRIBUTIONAL RANGES. Metabolic scope (d). 6. 4. 2. 0 −2 0. 10. 20 30 40 50 Distributional range (°). 60. 70. Figure 17.4. Correlation between metabolic scope (difference between routine and standard metabolic rates, expressed as the Hedge’s difference) and distributional range (difference between northern and southern distribution limit, expressed in latitudinal degrees) among fish species. Statistical parameters are r = 0.38, P < 0.001. Modified from Naya and Bozinovic (2012).. capacity window, as well as express broader thermal tolerance ranges. This represents a form of plasticity, which clearly helps explain levels of intra- and inter-individual physiological variation over time and space (Spicer & Gaston 1999). Where present it could clearly modulate species and populations resilience to climatic variability (Stillman 2003). As suggested by Bozinovic et al (2011) plasticity is a pervasive phenomenon, which can be equally extended to physiological limits (tolerance), performances (capacities) and affecting or perhaps determining geographic ranges and its limits.. CONCLUSIONS AND FUTURE DIRECTIONS In conclusion what seems to be clear is that we need to advance our current understanding of the relationship between species and populations physiological responses and how they are linked to their distribution. Ultimately, this will lead to a better understanding of the relationship among tolerance, capacity and plasticity, and guide the integration of these traits in the investigation of “what determines a species range size?” The dispute on how to integrate physiological traits, how to better parameterize each and every trait considered fundamental for the modeling of species range limits is a vigorous one (see Gaston et al. 2009; Bozinovic et al. 2011). This complex problem requires an understanding of the regional impact of climate, the physiological mechanisms (tolerance, capacity and plasticity) by which animals cope to climate during their life cycles, and the nature of the differential effects of climate on life history of species and populations along geographic gradients. Perhaps more importantly is the fact that Earth’s climate is changing rapidly. The data of the ICPP 2007-2008 signal an evident trend toward increasing global temperatures. The causes of these changes are complex and associated with a network of events in which human action appears to have a determinant role. Climate change reflects changes at the global, regional, and local levels. The observed responses to recent climate change are many and important but no doubts include shifts in geographic ranges (Parmesan 2006). Although these trends are expected to cause pervasive effects on the biota, the nature, span, and final consequences of climate change on biogeography must differ among taxa. In fact,.
(12) REFERENCES. the diversity in physiological traits and ecological associations are evident in the fauna and flora, even among individuals. For instance, the response of endotherms distributional range to climate change likely would be very different from that found in ectotherms, as it would be between mobile and sedentary species. Thus, understanding the nature of differential effects of climate change on animal and plant species geographic range is one of the many urgent interdisciplinary challenges faced by contemporary science (McNab 2012; Kirkpatrick & Barton 1997). Indeed, recently, Araújo et al. (2013) asked if species physiologically adapt to climate warming. These authors analyzed thermal tolerances of a large number of terrestrial ectotherms, endotherms, and plant species across the world. Araújo et al. (2013) observed that that tolerance to heat is largely conserved across lineages, but tolerance to cold varies between and within species. This pattern challenges the classic view that physiological tolerances of species change continuously across climatic gradients, and portrays an alternative view in which the thermal component of climatic niches would overlap across species more than expected. One consequence of conservatism of upper tolerances is that estimated niches for cold-adapted species will be likely to underestimate their upper thermal limits, so potentially inflating assessments of risk from climate change. On the contrary, species whose climatic preferences are close to their upper thermal limits will unlikely evolve physiological tolerances to increased heat, and could be predictably more affected by global warming. To end this chapter, we wish to point out three very simple questions that, in our opinion, should be taken into account more seriously in future studies aimed to disentangle the complex relationship between integrative biology and species distribution. First, what is the mechanistic link between the focal trait and organism fitness? This question is critical in establishing a link between individual physiological responses and population viability. Second, to what degree is a trait under selection integrated with other organismal traits (e.g., behavior), in such a way that alternative solutions could emerge from this integration? This theme of understanding trait integration is shared throughout many chapters in this book (e.g., Chapters 1 and 19), and will require a more multivariate approach that simultaneously examines how multiple traits change in response to climatic variability. And finally, to what extent does the environmental variables being tested reflect the real environments in which organisms are living? This last point may seem obvious, but if we ultimately want to predict geographic range limits and responses to changes in climate, we will need much more environmental data collected at the scale organisms live. Our hope is that a focus on these questions will allow for progress to be made on the links between climate, physiology, and patterns of distribution.. ACKNOWLEDGMENTS The editors of this book and Piero Calosi made relevant contributions and comments. Funded by FONDECYT 1130015 to FB and Programa Iberoamericano de Ciencia y Tecnología para el Desarrollo (CYTED 410RT0406) to FB and DEN. The authors thank Fondo Basal FONDECYT FB-002 for support.. REFERENCES Addo-Bediako, A., Chown, S.L. and Gaston, K.J. (2000) Thermal tolerance, climatic variability and latitude. Proceedings of the Royal Society of London B, 267, 739–45. Addo-Bediako, A., Chown, S.L. and Gaston, K.J. (2002) Metabolic cold adaptation in insects: a large-scale perspective. Functional Ecology, 16, 332–8.. 287.
(13) 288. LINKING PHYSIOLOGY, CLIMATE, AND SPECIES DISTRIBUTIONAL RANGES. Araújo, M.B., Ferri-Yañez, F., Bozinovic, F. et al. (2013) Heat freezes niche evolution. Ecology Letters, 16, 1206–19. Block, B.A. and Finnerty, J.R. (1994) Endothermy in fishes: A phylogenetic analysis of constraints, predispositions, and selection pressures. Environmental Biology of Fish, 40, 283–302. Bozinovic, F., Calosi, P. and Spicer, J.I. (2011) Physiological correlates of geographic range in animals. Annual Review of Ecology, Evolution and Systematics, 42, 155–79. Bozinovic, F. and Rosenmann, M. (1989) Maximum metabolic rate of rodents: physiological and ecological consequences on distributional limits. Functional Ecology, 3, 173–81. Brattstrom, B.H. (1968) Thermal acclimation in anuran amphibians as a function of latitude and altitude. Comparative Biochemistry and Physiology, 24, 93–111. Brattstrom, B.H. (1970) Thermal acclimation in Australian amphibians. Comparative Biochemistry and Physiology, 35, 69–103. Brett, J.R. (1970) Temperature. Animals. Fishes, in Marine Ecology (ed O. Kinne), John Wiley & Sons, Inc., New York, pp. 515–60. Calosi, P., Bilton, D.T. and Spicer, J.I. (2008) Thermal tolerance, acclimatory capacity and vulnerability to global climate change. Biology Letters, 4, 99–102. Calosi, P., Bilton, D.T., Spicer, J.I. et al. (2010) What determines a species’ geographical range? Thermal biology and latitudinal range size relationships in European diving beetles (Coleoptera: Dytiscidae). Journal of Animal Ecology, 79, 194–204. Chown, S.L., van der Merwe, M. and Smith, V.R. (1997) The influence of habitat and altitude on oxygen uptake in sub-Antarctic weevils. Physiological Zoology, 70, 116–24. Chown, S.L., Gaston, K.J. and Robinson, D. (2004) Macrophysiology: large-scale patterns in physiological traits and their ecological implications. Functional Ecology, 18, 159–67. Clarke, A. (1991) What is cold adaptation and how should we measure it? American Zoologist, 31, 81–92. Clarke, A. (1993) Seasonal acclimatization and latitudinal compensation in metabolism: do they exist? Functional Ecology, 7, 139–49. Compton, T.J., Rijkenberg, M.J.A., Drent, J.S. and Piersma, T. (2007) Thermal tolerance ranges and climate variability: a comparison between bivalves from differing climates. Journal of Experimental Marine Biology and Ecology, 352, 200–11. Cruz, F.B., Fitzgerald, L.A., Espinoza, R.E. and Schulte, J.A. II (2005) The importance of phylogenetic scale in tests of Bergmann’s and Rapoport’s rules: lessons from a clade of South American lizards. Journal of Evolutionary Biology, 18, 1559–74. Deutsch, C.A., Tewksbury, J.J., Huey, R.B. et al. (2008) Impacts of climate warming on terrestrial ectotherms across latitude. Proceedings of the National Academy of Science USA, 105, 6668–72. Feder, M.E. (1982) Environmental variability and thermal-acclimation of metabolism in tropical anurans. Journal of Thermal Biology, 7, 23–8. Futuyma, D.J. (1998) Evolutionary Biology, 3rd edn, Sinauer Associates, Inc, p. 763. Gaston, K.J. (2003) The structure and dynamics of geographic ranges, Oxford University Press, Oxford, p. 276. Gaston, K.J., Chown, S.L., Calosi, P. et al. (2009) Macrophysiology: a conceptual reunification. American Naturalist, 174, 595–612. Ghalambor, C.K., Huey, R.B., Martin, P.R. et al. (2006) Are mountain passes higher in the tropics? Janzen’s hypothesis revisited. Integrative and Comparative Biology, 46, 5–17. Hoffman, A.A. and Watson, M. (1993) Geographical variation in the acclimation response of Drosophila to temperature extremes. American Naturalist, 142, S93–S113. Huey, R.B., Hertz, P.E. and Sinervo, B. (2003) Behavioral drive versus behavioral inertia in evolution: a null model approach. American Naturalist, 161, 357–66..
(14) REFERENCES. Humphries, M.M., Thomas, D.W. and Speakman, J.R. (2002) Climate-mediated energetic constraints on the distribution of hibernating mammals. Nature, 418, 313–16. IPCC (2007) Climate Change 2007: The Physical Science Basis. Summary for Policymakers. http://www.ipcc.ch/SPM2feb07.pdf Jacobsen, D. and Brodersen, K.P. (2008) Are altitudinal limits of equatorial stream insects reflected in their respiratory performance? Freshwater Biology, 53, 2295–2308. Janzen, D.H. (1967) Why mountain passes are higher in the tropics. American Naturalist, 101, 233–49. Kellerman, V., van Heerwaarden, B., Sgro, C.M. and Hoffmann, A.A. (2009) Fundamental evolutionary limits in ecological traits drive Drosophila species distributions. Science, 325, 1244–6. Kimura, M.T. (1988) Adaptations to temperate climates and evolution of overwintering strategies in the Drosophila melanogaster species group. Evolution, 42, 1288–97. Kirkpatrick, M. and Barton, N.H. (1997) Evolution of a species’ range. American Naturalist, 46, 954–71. Levins, R. (1969) Thermal acclimation and heat resistance in Drosophila species. American Naturalist, 103, 483–99. Lovegrove, B.G. (2000) The zoogeography of mammalian basal metabolic rate. American Naturalist, 156, 201–19. Lovegrove, B.G. (2003) The influence of climate on the basal metabolic rate of small mammals: a slow-fast metabolic continuum. Journal of Comparative Physiology, 73B, 87–112. Maldonado, K., Bozinovic, F., Rojas, J.M. and Sabat, P. (2011) Within-species digestive tract flexibility in rufous-collared sparrow and the climatic variability hypothesis. Physiological and Biochemical Zoology, 84, 377–84. Maldonado, K., Bozinovic, F., Cavieres, G. et al. (2012) Phenotypic flexibility in basal metabolic rate is associated with rainfall variability among populations of rufous-collared sparrow. Zoology, 115, 128–33. McNab, B.K. (2002) The Physiological Ecology of Vertebrates. A View from Energetics, Comstock, Cornell. McNab, B.K. (2012) Extreme Measure: The Ecological Energetics of Birds and Mammals, The University of Chicago Press, Chicago and London. Mitchell, K.A., Sgro, C.M. and Hoffmann, A.A. (2011) Phenotypic plasticity in upper thermal limits is weakly related to Drosophila species distributions. Functional Ecology, 25, 661–70. Molina-Montenegro, M.A. and Naya, D.E. (2012) Latitudinal patterns in phenotypic plasticity and fitness-related traits: assessing the climatic variability hypothesis (CVH) with an invasive plant species. PloS One, 7, e47620. Naya, D.E. and Bozinovic, F. (2012) Metabolic scope of fish species increase with distributional range. Evolutionary Ecology Research, 14, 769–77. Naya, D.E., Bozinovic, F. and Karasov, W.H. (2008) Latitudinal trends in digestive flexibility: testing the climatic variability hypothesis with data on the intestinal length in rodents. American Naturalist, 172, 122–34. Naya, D.E., Catalan, T.P., Artacho, P. et al. (2011) Exploring the functional association between physiological flexibility, climatic variability and geographical latitude: lesson from land snails. Evolutionary Ecology Research, 13, 647–59. Naya, D.E., Spangenberg, L., Naya, H. and Bozinovic, F. (2012) Latitudinal patterns in rodent metabolic flexibility. American Naturalist, 179, 172–9. Naya, D.E., Spangenberg, L., Naya, H. and Bozinovic, F. (2013a) How does evolutionary variation in basal metabolic rates arise? A statistical assessment and a mechanistic model. Evolution, 67, 1463–76.. 289.
(15) 290. LINKING PHYSIOLOGY, CLIMATE, AND SPECIES DISTRIBUTIONAL RANGES. Naya, D.E., Spangenberg, L., Naya, H., & Bozinovic, F. (2013b) Thermal conductance and basal metabolic rate are part of a coordinated system for heat transfer regulation. Proceedings of the Royal Society of London B, 280, 20131629, 10.1098/rspb.2013.169. Overgaard, J., Kristensen, T.N., Mitchell, K.A. and Hoffmann, A.A. (2011) Thermal tolerance in widespread and tropical Drosophila species: does phenotypic plasticity increase with latitude? American Naturalist, 178, S80–S96. Parmesan, C. (2006) Ecological and evolutionary responses to recent climate change. Annual Review of Ecology Evolution and Systematic, 37, 637–69. Pither, J. (2003) Climate tolerance and interspecific variation in geographic range size. Proceedings of the Royal Society of London B, 270, 475–81. Rezende, E.L., Bozinovic, F. and Garland, T. Jr. (2004) Climatic adaptation and the evolution of basal and maximum rates of metabolism in rodents. Evolution, 58, 1361–74. Rodriguez-Serrano, E. and Bozinovic, F. (2009) Interplay between global patterns of environmental temperature and variation in non-shivering thermogenesis of rodents species across large spatial scales. Global Change Biology, 15, 2116–22. Root, T. (1988) Energy constraints on avian distributions and abundances. Ecology, 69, 330–9. Scholander, P.F., Flagg, W., Walters, V. and Irving, L. (1953) Climatic adaptation in Arctic and tropical poikilotherms. Physiological Zoology, 26, 67–92. Snyder, G.K. and Weathers, W.W. (1975) Temperature adaptations in amphibians. American Naturalist, 109, 93–101. Somero, G. (2005) Linking biogeography to physiology: evolutionary and acclimatory adjustments of thermal limits. Frontiers in Zoology, 2, 1–9. Speakman, J.R. (2000) The cost of living: field metabolic rates of small mammals, in Advances in Ecological Research (eds A.H. Fisher and D.G. Raffaelli), Academic Press, San Diego, California, pp. 178–294. Spicer, J.I. and Gaston, K.J. (1999) Physiological Diversity and Its Ecological Implications, Blackwell Scientific Publications, Oxford. Stevens, G.C. (1989) The latitudinal gradient in geographical range: how so many species coexist in the tropics. The American Naturalist, 133, 240–56. Stillman, J.H. (2003) Causes and consequences of thermal tolerance limits in rocky intertidal porcelain crabs, genus Petrolisthes. Integrative and Comparative Biology, 42, 790–6. Stillman, J.H. and Somero, G.N. (2000) A comparative analysis of the upper thermal tolerance limits of Eastern Pacific porcelain crabs, genus Petrolisthes: Influences of latitude, vertical zonation, acclimation, and phylogeny. Physiological and Biochemical Zoology, 73, 200–8. Swanson, D.L. and Bozinovic, F. (2011) Metabolic capacity and the evolution of biogeographic patterns in oscine and suboscine passerine birds. Physiological and Biochemical Zoology, 84, 185–94. Tsuji, J.S. (1988) Thermal-acclimation of metabolism in sceloporus lizards from different latitudes. Physiological Zoology, 61, 241–53. van Berkum, F.H. (1988) Latitudinal patterns of the thermal sensitivity of sprint speed in lizards. American Naturalist, 132, 327–43.. View publication stats.
(16)
Figure


Documento similar
For a short explanation of why the committee made these recommendations and how they might affect practice, see the rationale and impact section on identifying children and young
The expansionary monetary policy measures have had a negative impact on net interest margins both via the reduction in interest rates and –less powerfully- the flattening of the
Jointly estimate this entry game with several outcome equations (fees/rates, credit limits) for bank accounts, credit cards and lines of credit. Use simulation methods to
The exhibition and the catalogue provide a series of samples that exemplify a phase in the ongoing dialectic between local identities versus connected and communicative
In this review, we will focus on recent data available concerning the following aspects of the K V channel modulation by PUFAs: (i) the exact residues involved in PUFAs-K
In Chapter III, the effects of several UV–C pretreatments (1.5, 4.5, 9 and 15 kJ m −2 ) on changes in physiological characteristics, sensory and microbial quality, and some
In the preparation of this report, the Venice Commission has relied on the comments of its rapporteurs; its recently adopted Report on Respect for Democracy, Human Rights and the Rule
The effect size of UVR and temperature × UVR on the N cell quota was found to be greater in both species (exceeding 50%, Fig. galbana and, notably, the effect size of UVR
