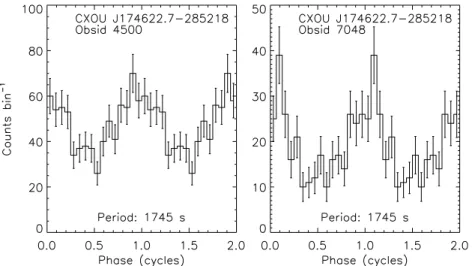
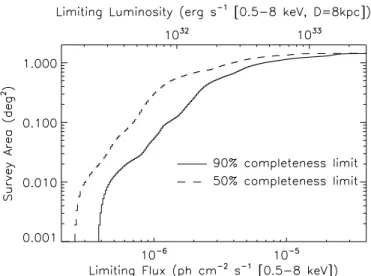
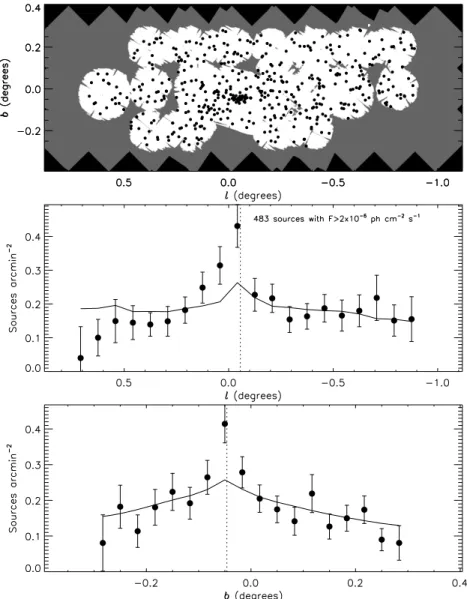
A Catalog of X ray Point Sources from Two Megaseconds of Chandra Observations of the Galactic Center
Texto completo
Figure


Documento similar
1 the distance to the core for sources of the S5 polar cap sample that were observed at least three times, and in Table 4 we present proper motions obtained from model fitting
The general idea of the language is to “thread together,” so to speak, existing systems that parse and analyze single web pages into a navigation procedure spanning several pages of
As a first step, we verify the analysis procedure using simu- lated point-like sources with the computed spectra correspond- ing to (1) the inner part of the lunar disk (the total
• Analysis of long-term variability of high-energy sources in the optical and X-ray bands, using INTEGRAL observations from IBIS (the gamma-ray imager), JEM-X (the X-ray monitor)
The science foreseen for the previous co-additions of the Stripe 82 survey has been focused on ‘point sources science’ (i.e. Unfortunately, the pipeline used for the reduction of
The data handled by the researchers in the Center for Fast Ultrasound Imaging for the study of the blood flow comes from different sources depending on the ultrasounds scanner used,
From the analysis of the position and shape of the emission bands we derive a best-fit grain temperature for pure forsterite grains of around 150−200 K for all sources except for AB
The blue triangles are source counts from the 1FHL catalog; Top left: all 1FHL sources, excluding those associated with extragalactic sources, right: 1FHL pulsars, Bottom left: all


