TítuloMarkov mean properties for cell death related protein classification
16
0
0
Texto completo
(2) Keywords Markov Chains; Cell Death; Protein classification; QSAR; Machine Learning. 1. Introduction Life requires a balance between cell division to generate new cells and cell death (CD). The adult human body creates more than a thousand billion cells every day. In parallel, a similar number of cells are programmed to die. Cell death is generally classified using the morphological appearance as apoptosis (Kerr et al., 1972), necrosis (Golstein and Kroemer, 2007), autophagy (Galluzzi et al., 2008 and Levine and Yuan, 2005) and cornification (Candi et al., 2005 and Melino et al., 2000). Thus, apoptosis is not the synonym of programmed cell death or caspase activation (Kroemer et al., 2009) but it is characterized by rounding-up of the cell, retraction of pseudopodes, reduction of cellular and nuclear volume (pyknosis), nuclear fragmentation (karyorrhexis), minor modification of cytoplasmic organelles, plasma membrane blebbing and engulfment by resident phagocytes (in vivo). Necrosis identifies the cell death lacking of apoptosis or autophagy and it involves cytoplasmic swelling (oncosis), rupture of plasma membrane, swelling of cytoplasmic organelles and moderate chromatin condensation (Golstein and Kroemer, 2007). Authophagic cell death occurs during the autophagy, a process that often promotes cell survival (Galluzzi et al., 2008 and Levine and Yuan, 2005). The cornification envelope formation (keratinization) is a particular type of skin protection localized in the granular layer and stratum corneum (upper layers) (Candi et al., 2005 and Melino et al., 2000). The cell death process can be classified according to other criteria such as immunological characteristics (immunogenic or nonimmunogenic), functional aspects (programmed or accidental, physiological or pathological) or enzymological criteria (with or without the participation of nucleases or some proteases such as caspases, calpains, cathepsins and transglutaminases) (Melino, 2001). The Nomenclature Committee on Cell Death (NCCD) presented its recommendations for cell death classifications in 2005 (Kroemer et al., 2005). The dying process of the cell is reversible until the first “point-of-no-return” is trespassed such as massive activation of caspases, mitochondrial transmembrane permeabilization dissipation, mitochondrial permeabilization or phosphatidylserine exposure (Kroemer et al., 2009). Cell death is very important in pathological and physiological processes and, at the same time, it has a high complexity due to the involved molecules. Thus, there is a necessity for new computational methods to predict new molecules involved in cell death. The current work is presenting for the first time a classification model to predict new proteins involved in any type of CD processes. The model is based on 3D topological indices of the protein amino acid networks and on Machine Learning classification techniques (Frank, 2005 and Sternberg et al., 1994). The new molecular descriptors are encoding physicochemical amino acid properties in a similar way with the previous molecular descriptors. One example is the descriptors based on electrostatic potential that have been used to predict enzyme class (Munteanu et al., 2008), DNA-cleavage protein activity (Munteanu et al., 2009), protein–protein interactions in parasites (Rodriguez-Soca et al., 2010a and Rodriguez-Soca et al., 2010b), drug–protein interactions (Gonzalez-Diaz et al., 2011) or lipid-binding proteins (Gonzalez-Diaz et al., 2012). The classifier represents a Quantitative-Structure–Activity-Relationship (QSAR) (Archer, 1978) between the protein 3D structure and the biological activity. The QSAR models (Puzyn et al., 2010) for drugs have been intensively used for a large spectrum of studies such as target searching (Aparna et al., 2005, SpeckPlanche and Kleandrova, 2012 and Speck-Planche et al., 2012), antifungal (Gonzalez-Diaz et al., 2006), antiviral (Prado-Prado et al., 2011), and antimalarial (Katritzky et al., 2006) activity. Other types of QSAR models used the structures of peptides (Ivanciuc, 2009), proteins (González-Díaz et al., 2009) and DNA promoters (Gonzalez-Diaz et al., 2005b). The current study presented QSAR models between the protein chain 3D structure and the CD biological function..
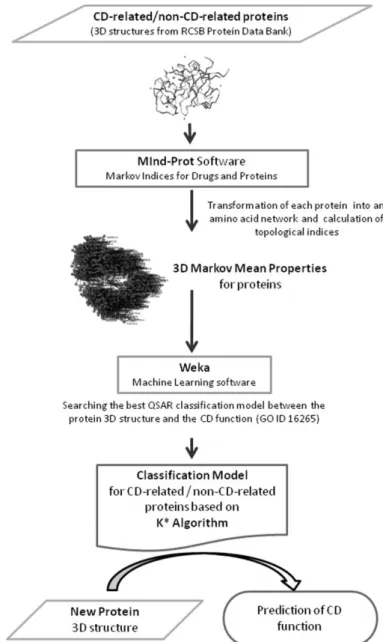
(3) 2. Materials and methods The description of the methodology used to predict proteins linked with CD processes is presented in Fig. 1. In the first step, the model database was constructed by including two known classes of protein chains: one CD-related and the other non-CD-related. CD proteins are described by the Gene Ontology (Carbon et al., 2009) biological process ontology GO:0016265. The 3D structures of these proteins were transformed into molecular descriptors using MInD-Prot tool (Munteanu and González-Díaz, 2012). These indices are used as the input for Machine Learning methods from Weka (Hall et al., 2009) in order to search for the best model that can classify a new 3D protein structure to be related with the cell death. The obtained model is a QSAR (Devillers and Balaban, 1999) between the 3D protein structure and the CD molecular function.. Fig. 1. The flow chart of the methodology of using 3D Markov mean properties for proteins and Machine Learning technologies to obtain a CDrelated/non-CD-related protein classification model..
(4) Weka (Hall et al., 2009) represents a collection of Machine Learning algorithms (Frank, 2005 and Witten and Frank, 2000) for solving data mining problems such as structural biology (Sternberg et al., 1994), inhibitors of glycoproteins (Wang et al., 2005), protein functional class (Han et al., 2006), gene identification (Hayes and Borodovsky, 1998), DNA-binding proteins (Bhardwaj et al., 2005), phenotype–genotype mapping (Prank et al., 2005), single nucleotide polymorphism in diseases (AguiarPulido et al., 2010), microarray data (Lavine et al., 2004) or cancer prediction using mass spectra (Hilario et al., 2003). Therefore, we used Weka tool to find the best classification model for CD-related protein chains. 2.1. Protein set/death proteins The protein 3D structure dataset was obtained from two databases. The sets of protein are made up of a total of 2423 protein chains: 336 CD-related protein chains (positive group) and 2087 non-CD-related protein chains (negative group). The PDBs for positive group have been downloaded from the Protein Databank (Berman et al., 2000), the “Death” list (GO ID16265; Perez-Bello et al., 2009) obtained with the “Molecular Function Browser” in the “Advanced Search Interface” (sequence identity cut-off=30%, downloaded on November 3, 2012). Thus, the positive group of protein chains can share a maximum of 30% of the sequences (the best accuracy in Protein Databank). The negative group was created using the PISCES CulledPDB (Wang and Dunbrack, 2003) list of 2111 protein chains (downloaded on November 16, 2012 from http://dunbrack.fccc.edu/PISCES.php) with identity (degree of correspondence between two sequences) less than 20%, resolution of 1.6 Å and R-factor 0.25. This list of protein chains is representative for all the known proteins (with any function), heaving the parameters described above. As a second step, the protein chains from the positive group (CD-related) that are presented in the negative group were eliminated from the last one. Therefore, a set of 2087 non-CD-related protein chains have been obtained as the final negative group. The PDBs of the negative groups were downloaded from the same Protein Databank. Thus, the dataset contains one positive group with protein chains linked with the cell death biological process and the negative group with a representative list of proteins without this function. In the next step, a classification model for this biological property was created. In order to obtain a classifier, the protein chains should be characterized by a series of numbers, the next model variables (attributes). The conversion of a 3D protein structure in molecular descriptors was done with MInD-Prot tool. 2.2. Markov mean properties MInD-Prot tool (Munteanu and González-Díaz, 2012) represents a Python/wxPython application for the calculation of the mean properties Markov indices for drugs and proteins. It uses as inputs the PDB/FAST files for proteins and the SMILE codes for drugs. The current study used the 3D coordinates of the amino acids from the PDB files of the protein chains. The software MInD-Prot calculates Markov mean properties (MP) using different molecular physicochemical properties for the characterization of chemical structures. It is based on modifications of the classic Markov Chains (MC) algorithm, called MARCH-INSIDE (MI), introduced by Gonzalez-Díaz et al. ( Gonzalez-Diaz et al., 2008, Gonzalez-Diaz et al., 2010a and Gonzalez-Diaz et al., 2010b). It uses essentially the same algorithm for all classes of molecular structures but performs different approximations for low-weight molecules (drugs, ligands, metabolites) with respect to large bio-polymers (proteins in this case). In the case of proteins, the values of the amino acid physicochemical properties are calculated as a sum of all atomic properties from each type of amino acid. Four types of physicochemical properties have been used: Mulliken Electronegativity (EM), Kang-Jhon Polarizability (PKJ), van der Waals area (vdWA) ( Todeschini and Consonni, 2002) and Atom Contribution to P (AC2P) ( Hou and Xu, 2003). The representation of a protein chain is considered as a static model where the amino acids are spatially distributed having the corresponding 3D coordinates (xi,yi, zi) for the Cα atoms. These coordinates are used to obtain the amino acid contact network for a protein chain by using a cutoff.
(5) distance (roff) of 7 Å, the optimal Cα–Cα distance (da Silveira et al., 2009). The amino acids at a distance less than roff are connected (αij=1 elements in the connectivity matrix A). The 3D structure of the protein is virtually divided in spherical spatial regions (R): core (c), inner (i), middle (m) and surface (s). The diameters of these regions are calculated as a percentage of the longest distance rmax with respect to the protein chain geometrical center: c between 0% and 25%, i between 25% and 50%, m between 50% and 75%, and s between 75% and 100%. Additionally, the total region (t) is considered (region diameter between 0% and 100%). The Markov Chain theory is used to calculate the probabilities to interact any two amino acids placed at a topological distance k (0–5). The obtained values are averaged by all k values for each region R. Consequently, we can calculate different k-averaged parameters (MPR) for the amino acids contained in a region (R=c, i, m, s, t) ( Concu et al., 2009, Gonzalez-Diaz et al., 2005a, GonzalezDiaz et al., 2007a, González-Díaz et al., 2007b and González-Díaz et al., 2007c) and a specific physicochemical property. The indices for each physicochemical property are obtained after the following steps: Calculation of a squared connectivity matrix of Cα atoms (A) by using the 3D coordinates from PDB protein file; n×n matrix where n is the number of the amino acids in the protein chain and αij elements have values of 1 for connected amino acids and 0 for the non-connected ones; Calculation of the weighted matrix (W) by adding the values of the physicochemical property for each type of connected amino acid (wj elements from vector w as amino acid weight vector), Calculation of the interaction probability matrix ( 1Π) obtained by normalization of W, Calculation of similar interaction probability matrices ( kΠ) for other k steps of interactions (k=0– 5), for a specific molecular property, The matrices kΠ are used to calculate the 3D Markov mean properties corresponding to the entire protein chain, kMPt, for a specific k (see Eq. (1)); the central matrix kΠ is multiplied from the left by the probability vector 0p for all amino acids without considering the network connectivity; the result is multiplied from the right by the vector of the amino acid weights (w); the values correspond to elements from 1 to n (the total number of the amino acids in the protein chain), The other MPs corresponding to the other protein regions (c, i, m, s) are obtained from the same formula by multiplying only the values that corresponds with the amino acids in a specific 3D region, Finally, the kMPR values are averaged for all k values as the Markov mean properties MPR (see Eq. (2)). Thus, for each protein, MInD-Prot (Munteanu and González-Díaz, 2012) calculates a total of 20 descriptors MPR for the 4 types of physicochemical properties, and averages for all the k values into 5 regions R: EMR, PKJR, vdWAR and AC2PR. 𝑘. 𝑀𝑃𝑡 = [ 0 𝑝(𝑤1 ) 0 𝑝(𝑤2 ) … 0 𝑝(𝑤𝑛 )] 1. 𝑝1,2 1 𝑝2,1 ⋅ . . 1 [ 𝑝𝑛,1 5. 𝑀𝑃𝑅 = ∑ 𝑘𝑀𝑃𝑅. 1. 𝑝1,2 1 𝑝2,2 . . .. 1. 𝑝1,3 1 𝑝2,3 . . .. . . . . .. (1) 1. 𝑘. 𝑝1,𝑛 𝑤1 𝑛 1 𝑤 2 𝑝2,𝑛 𝑘 . ⋅ = ∑ 𝑝(𝑤𝑗 ) 𝑤𝑗 . . 𝑗=1 . 1 𝑝𝑛,𝑛 ] [𝑤𝑛 ] (2). 𝑘=0. The indices that are encoding the 3D structure and physicochemical property information of the protein chains were used as input for the Machine Learning methods from Weka (Hall et al., 2009) in order to find the best QSAR classification model that can predict the CD-related proteins..
(6) 2.3. Classification methods In statistics, two events are independent when the occurrence of one does not modify the probability of the other one. An observation is normal when its behavior follows a normal or the Gaussian distribution with a certain value of mean and variance. In order to respect this independence condition, the authors have tested the different classification techniques using 10-fold cross-validation to split data (McLachlan et al., 2004). Dataset is randomly partitioned into 10 equal-sized bins. Nine bins were picked 10 times to train the models and the remaining bin was used to test them, each time leaving out a different bin. This tries to minimize influence of the configuration of training and validation sets. The performance of prediction models for a two-class problem (i.e. CD-related proteins or non-CDrelated protein) is typically evaluated using a confusion matrix. There are several numbers of well-known accuracy measures for a two-class classifier in the literature such as classification rate, precision, sensitivity, specificity, F-measure and Area Under the Receiver Operating Characteristic Curve (AUROC). An experimental comparison of performance measures for classification could be found in Ferri et al. (2009). The higher the precision, the less the effort wasted in testing and inspection; and the higher the recall, the fewer the defective modules that go undetected. However, there is a trade-off between precision and recall and therefore a combination of both is needed in a single efficiency measure, known as F-measure, which considers both precision and recall equally important (Witten and Frank, 2005). Jin, (2005) suggested that AUROC is a better measure than accuracy when comparing classifiers and in general. The ROC is a comparison of two operating characteristics (a true positive rate and a false positive rate) as the criterion changes (Swets, 1996). ROC curve is a graphical plot which illustrates the performance of a binary classifier system as its discrimination threshold is varied. It is created by plotting the fraction of true positives out of the positives (TP rate=true positive rate) vs. the fraction of false positives out of the negatives (FP rate=false positive rate), at various threshold settings. TP rate is also known as sensitivity, and FP rate is one minus the specificity or true negative rate. ROC analysis provides tools to select possibly optimal models and to discard suboptimal ones independently of (and prior to specifying) the cost context or the class distribution. ROC analysis is related in a direct and natural way to cost/benefit analysis of diagnostic decision making. The dataset is divided randomly into two parts (training and validation) extracting a total of 20% of the training data. Furthermore a preprocessing of the data was performed to check the non-correlation between variables by means of the findCorrelation function in statistical software R ( Teetor, 2011) that searches through the correlation matrix columns to remove the pair-wise correlations. The objective of this paper is to evaluate the ability of a classification model to compare CD-related vs. non-CD-realated proteins. Several experiments have been performed in order to select the best models. Different classification models included in the Machine Learning library provided by Weka (Hall et al., 2009) were used: AdaBoost (AB) (Liu and Setiono, 1996), MultiLayer Perceptron (MLP) (Bishop, 1995 and Bishop, 2006), Naïve Bayes (NB) (John and Langley, 1995), Random Forest (RF) (Breiman, 2001), LibLinear (LL) (Fan et al., 2008), J48 (Witten and Frank, 2005) (the weka implementation of c4.5 algorithm) and K*. The complete set of the classifier from Weka has been tested for the CD-related proteins. Between all these classifiers, K* (Cleary and Trigg, 1995) was elected for the first models because of the reasons presented in Section 3. K* is one of the instance-based learning algorithms among the several included in Weka which try to get advantage of some of the benefits of the use of entropy as a distance measure. Thus, K* algorithm attempts to offer an efficient approach in problems that deal with missing values, real valued attributes or symbolic attributes. Instance Based Learning (Aha et al., 1991) makes comparisons between test samples and previously annotated samples in a dataset so it needs a similarity function (usually based on some distance measure like the Euclidean distance) to perform that comparison. Nearest neighbor algorithms (Cover and Hart, 1967) are a simple way to address this point by means of a distance function specific to the problem domain which is used to compare a sample with the nearest instance within the training set to establish the classification. More complex algorithms, like k-nearest neighbor algorithms, compare this sample.
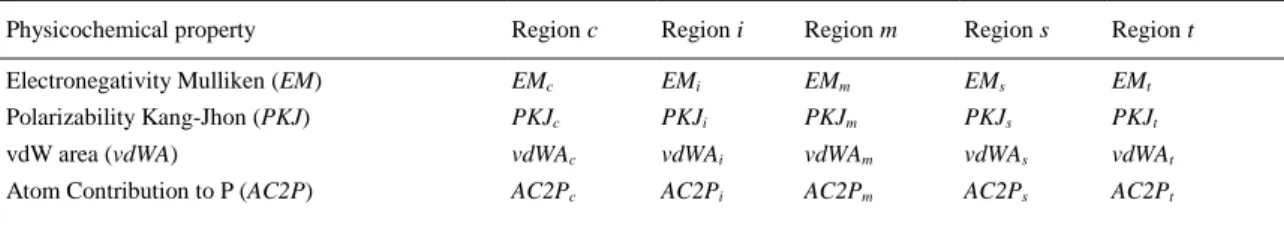
(7) with a subset of the k nearest samples in the training set and assign the most common class within that subset to the new instance. Several approaches use this algorithm and add different modifications to deal with the amount of space required by the training data set, to provide correct classifications under noisy data or to be able to manage non relevant, new attributes or symbolic values ( Aha, 1992, Aha and Kibler, 1989, Aha et al., 1991 and Cost and Salzberg, 1993). K* algorithm differs from other instance-based algorithms because it uses an entropy-based distance function, extracted from the information theory (MacKay, 2003 and Shannon et al., 1949), in order to compute the similarity between two different samples. In short, entropy can be defined as a measure of how unsorted the data are.. 3. Results 3.1. Dataset description The dataset used in the next trials is composed of 2423 samples. These samples can be divided into two different groups: one of them with 336 samples corresponding to CD-related protein chains (the positive group) and the other 2087 samples assigned to non-CD-related protein chains (the negative group). In order to resample this dataset, and generate a more balanced one, a synthetic minority oversampling technique (Chawla et al., 2002) can be applied using Weka. These protein sequences have been processed by MInD-Prot (Munteanu and González-Díaz, 2012) in order to obtain 20 Markov mean properties (attributes) for each protein chain, divided into 4 classes corresponding to each physicochemical property (EM, PKJ, vdWA and AC2P) or divided into 5 classes corresponding to the protein chain regions R (c, i, m, s, t) (see Table 1).. Table 1. Attributes calculated with MInD-Prot. Physicochemical property. Region c. Region i. Region m. Region s. Region t. Electronegativity Mulliken (EM). EMc. EMi. EMm. EMs. EMt. Polarizability Kang-Jhon (PKJ). PKJc. PKJi. PKJm. PKJs. PKJt. vdW area (vdWA). vdWAc. vdWAi. vdWAm. vdWAs. vdWAt. Atom Contribution to P (AC2P). AC2Pc. AC2Pi. AC2Pm. AC2Ps. AC2Pt. Note: Protein chain 3D regions (R): core (c), inner (i), middle (m) and surface (s).. 3.2. Reference model In the first step, all the information available has been used to find the best classification model. As Section 2.2 points, in order to minimize the influence of the configuration of training and validation sets, 10-fold cross validation was used. Table 2 summarizes the results and presents for each one of the classification models the scores obtained: TP/FP rates, F-measure, the ROC values for both training and validation dataset and the total number of features or attributes that were considered (in this case all the available data). These results show that K* algorithm provides the bests results because it obtains an AUROC value higher than 0.9 (this situation is reflected with bolded data in the different tables). In this case, the values of AUROC of 0.934 in training and 0.927 in validation are substantially higher than the values obtained by other methods. Only the algorithm RF offers ratios higher than 0.8 for F-Measure, AUROC or TP rates..
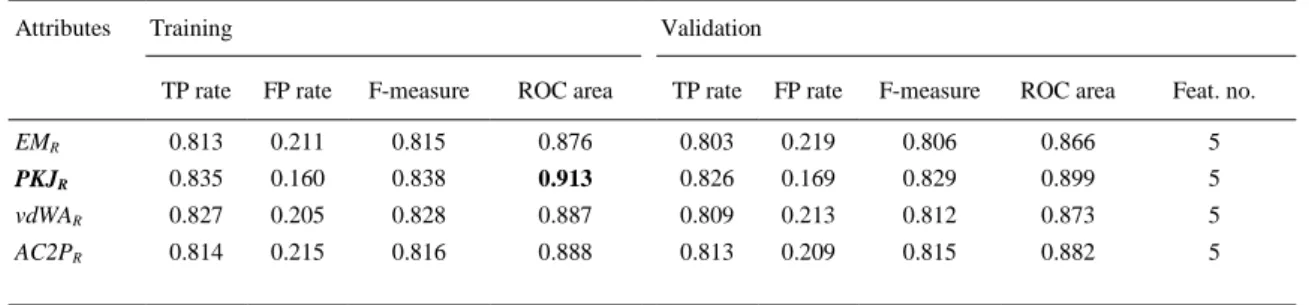
(8) Table 2. Classification models results Training. AB. a. Validation. TP Rate. FP Rate. F-measure. AUROC. TP rate. FP rate. F-measure. AUROC. No. of features. 0.708. 0.556. 0.649. 0.711. 0.695. 0.588. 0.624. 0.670. 20. MLPb. 0.730. 0.428. 0.714. 0.723. 0.704. 0.393. 0.702. 0.736. 20. NBc. 0.658. 0.375. 0.666. 0.690. 0.630. 0.408. 0.639. 0.671. 20. RFd. 0.831. 0.226. 0.830. 0.884. 0.808. 0.260. 0.806. 0.866. 20. LL. 0.677. 0.617. 0.597. 0.607. 0.667. 0.635. 0.582. 0.581. 20. J48e. 0.761. 0.360. 0.753. 0.757. 0.759. 0.384. 0.747. 0.729. 20. K*f. 0.849. 0.140. 0.852. 0.934. 0.814. 0.175. 0.819. 0.927. 20. weka.classifiers.meta.AdaBoostM1 -P 100 -S 1 -I 10 –W. functions.MultilayerPerceptron ‘-L 0.3 -M 0.2 -N 500 -V 0 -S 0 -E 20 -H a’ -5990607817048210779. bayes.NaiveBayes -D 5995231201785697655. d trees.RandomForest ‘-I 10 -K 0 -S 1’ 4216839470751428698. e trees.J48 ‘-C 0.25 -M 2’ -217733168393644444. f lazy.kstar –B 20 –M a. a. b c. 3.3. Feature subset selection The main question is how many and which are the most relevant features to discriminate between CDrelated and non-CD-related proteins. Thus, after Table 2 presented a comparison for the main Weka algorithms, several approaches to reduce the number of variables were performed. The first approach is the most simple and it consists of a feature selected based on the grouping of the features by physicochemical property or protein 3D regions. As Table 2 shows, K* is the best algorithm to perform this task, and it will be used in the rest of the trials. Table 3 shows the results obtained using the attributes that correspond to one physicochemical property (EM, PKJ, vdWA and AC2P) and all regions R. It should be noted that using only 5 attributes, the results offered by all the datasets are very close to the best result comparing the AUROC values.. Table 3. Feature selection grouping by each type of physicochemical property using K*. Attributes. Training. Validation. TP rate. FP rate. F-measure. ROC area. TP rate. FP rate. F-measure. ROC area. Feat. no.. EMR. 0.813. 0.211. 0.815. 0.876. 0.803. 0.219. 0.806. 0.866. 5. PKJR vdWAR. 0.835. 0.160. 0.838. 0.913. 0.826. 0.169. 0.829. 0.899. 5. 0.827. 0.205. 0.828. 0.887. 0.809. 0.213. 0.812. 0.873. 5. AC2PR. 0.814. 0.215. 0.816. 0.888. 0.813. 0.209. 0.815. 0.882. 5. R=all protein 3D regions (c, i, m, s, t); ex.: EMR=EMc, EMi, EMm, EMs, EMt.. Table 4 presents the results when the classification method used attributes for one region R and all physicochemical properties. In this case, the results are significantly lower than the reference values in Table 2, with maximum AUROC and TP rates around 0.7. Table 3 and Table 4 demonstrate that the information encoded in the physicochemical properties is more important than the exact location of the amino acids in the regions for this type of classification. The information coded by amino acids located in.
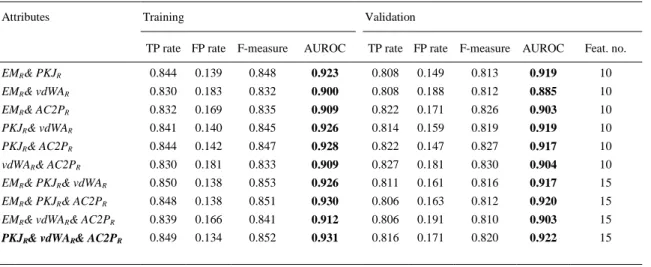
(9) a specific protein 3D region cannot help to predict the CD-related protein chains. In addition, Table 3 shows that the polarity is the most important property for the classification of CD-related proteins: with only 5 variables based on PKJ and all the regions, the model has an AUROC of 0.913/0.873 and TP rates of 83.5%/82.6% for the training/validation dataset.. Table 4. Feature selection grouping by regions using K*. Attributes. Training. Validation. TP rate. FP rate. F-measure. AUROC. TP rate. FP rate. F-measure. AUROC. Feat. no.. MPc. 0.699. 0.564. 0.640. 0.698. 0.695. 0.581. 0.629. 0.673. 4. MPi. 0.687. 0.628. 0.590. 0.636. 0.685. 0.627. 0.593. 0.613. 4. MPm. 0.694. 0.589. 0.622. 0.659. 0.685. 0.603. 0.611. 0.600. 4. MPs. 0.693. 0.600. 0.614. 0.620. 0.690. 0.614. 0.604. 0.638. 4. MPt. 0.716. 0.539. 0.663. 0.708. 0.717. 0.549. 0.658. 0.699. 4. Note: MP=all physicochemical properties (EM, PKJ, vdWA, AC2P); ex.: MPc=EMc, PKJc, vdWAc, AC2Pc.. In the next step, different combinations of the attributes have been used to find the best classification models for CD-related proteins. Thus, the results obtained with combination attributes based on several physicochemical properties are presented in Table 5. The results confirmed that the presence of attributes based on polarity (PLJ) determined better classification models (greater AUROC values). Therefore, using PKJR& AC2PR/PKJR& vdWAR& AC2PR sets of 10/15 variables, the models presented similar characteristics with the initial one from Table 2 with all the attributes (AUROC>0.92, TP rates>81.0%).. Table 5. Feature selection grouping by mixed physicochemical property using K*. Attributes. Training. Validation. TP rate FP rate F-measure. AUROC. TP rate FP rate F-measure. AUROC. Feat. no.. EMR& PKJR. 0.844. 0.139. 0.848. 0.923. 0.808. 0.149. 0.813. 0.919. 10. EMR& vdWAR. 0.830. 0.183. 0.832. 0.900. 0.808. 0.188. 0.812. 0.885. 10. EMR& AC2PR. 0.832. 0.169. 0.835. 0.909. 0.822. 0.171. 0.826. 0.903. 10. PKJR& vdWAR. 0.841. 0.140. 0.845. 0.926. 0.814. 0.159. 0.819. 0.919. 10. PKJR& AC2PR. 0.844. 0.142. 0.847. 0.928. 0.822. 0.147. 0.827. 0.917. 10. vdWAR& AC2PR. 0.830. 0.181. 0.833. 0.909. 0.827. 0.181. 0.830. 0.904. 10. EMR& PKJR& vdWAR. 0.850. 0.138. 0.853. 0.926. 0.811. 0.161. 0.816. 0.917. 15. EMR& PKJR& AC2PR. 0.848. 0.138. 0.851. 0.930. 0.806. 0.163. 0.812. 0.920. 15. EMR& vdWAR& AC2PR. 0.839. 0.166. 0.841. 0.912. 0.806. 0.191. 0.810. 0.903. 15. PKJR& vdWAR& AC2PR. 0.849. 0.134. 0.852. 0.931. 0.816. 0.171. 0.820. 0.922. 15. Note: R=all protein 3D regions (c, i, m, s, t)..
(10) Other type of attribute combination is based on mixed protein 3D protein regions and all physicochemical properties (see Table 6). The results confirm the necessity of using the information encoded in the entire protein chain structure for predicting CD-related proteins (according to the results in Table 4). Thus, the best AUROC values for this combination of indices were obtained with the entire protein (t) or all the regions (c, i, m, s).. Table 6. Feature selection grouping by mixed protein 3D regions using K*. Attributes. Training. Validation. TP rate FP rate. F-measure. AUROC. TP rate. FP rate. F-measure. AUROC. Feat. no.. MPc, MPi. 0.755. 0.384. 0.743. 0.785. 0.753. 0.385. 0.741. 0.785. 8. MPc, MPm. 0.758. 0.395. 0.743. 0.787. 0.737. 0.442. 0.715. 0.763. 8. MPc, MPs. 0.729. 0.455. 0.705. 0.745. 0.743. 0.444. 0.719. 0.774. 8. MPc, MPt. 0.747. 0.375. 0.739. 0.768. 0.719. 0.419. 0.708. 0.754. 8. MPi, MPm. 0.756. 0.356. 0.749. 0.785. 0.758. 0.354. 0.751. 0.789. 8. MPi, MPs. 0.745. 0.417. 0.728. 0.762. 0.746. 0.414. 0.730. 0.784. 8. MPi, MPt. 0.750. 0.353. 0.743. 0.781. 0.775. 0.340. 0.768. 0.808. 8. MPm, MPs. 0.740. 0.403. 0.728. 0.780. 0.742. 0.398. 0.730. 0.782. 8. MPm, MPt. 0.756. 0.344. 0.751. 0.794. 0.746. 0.365. 0.740. 0.771. 8. MPs, MPt. 0.731. 0.397. 0.722. 0.754. 0.725. 0.432. 0.710. 0.744. 8. MPc, MPi, MPm. 0.809. 0.243. 0.809. 0.862. 0.771. 0.273. 0.773. 0.841. 12. MPc, MPi, MPs. 0.790. 0.270. 0.789. 0.846. 0.816. 0.220. 0.817. 0.872. 12. MPc, MPi, MPt. 0.791. 0.251. 0.793. 0.852. 0.775. 0.266. 0.778. 0.845. 12. MPc, MPm, MPs. 0.786. 0.279. 0.786. 0.848. 0.801. 0.258. 0.801. 0.841. 12. MPc, MPm, MPt. 0.794. 0.253. 0.795. 0.848. 0.766. 0.270. 0.769. 0.832. 12. MPc, MPs, MPt. 0.792. 0.262. 0.793. 0.846. 0.790. 0.277. 0.789. 0.836. 12. MPi, MPm, MPs. 0.818. 0.216. 0.819. 0.877. 0.809. 0.231. 0.811. 0.879. 12. MPi, MPm, MPt. 0.809. 0.205. 0.812. 0.876. 0.809. 0.200. 0.813. 0.890. 12. MPm, MPs, MPt. 0.809. 0.209. 0.812. 0.881. 0.801. 0.214. 0.805. 0.878. 12. MPc, MPi, MPm, MPs. 0.836. 0.181. 0.838. 0.903. 0.830. 0.172. 0.833. 0.887. 16. MPc, MPi, MPm, MPt. 0.830. 0.166. 0.833. 0.912. 0.814. 0.180. 0.818. 0.908. 16. MPc, MPi, MPs, MPt. 0.843. 0.158. 0.846. 0.916. 0.819. 0.188. 0.822. 0.903. 16. MPc, MPm, MPs, MPt. 0.837. 0.163. 0.840. 0.917. 0.796. 0.212. 0.800. 0.894. 16. MPi, MPm, MPs, MPt. 0.837. 0.160. 0.840. 0.918. 0.827. 0.163. 0.831. 0.919. 16. Note: MP=all physicochemical properties (EM, PKJ, vdWA, AC2P).. The second approach to make a feature subset selection is related with the use of the WrapperSubsetEval technique from Weka (Kohavi and John, 1997). This technique evaluates features sets by using a learning scheme and searches for an optimal feature subset tailored to a particular algorithm and a domain. In this particular case, the AUROC value was used as evaluation measure, K* as the classifier algorithm and the BestFirst algorithm as a search method. Trails are made with the same schema 10-fold cross-validation and WrapperSubsetEval algorithm applies over each one of the 10-folds, selecting the most representative features for each fold. Table SM1 (Supplementary material) shows all the features selected once the algorithm was applied over the 10 folds and the total number of folds where each one of this features appears. The results of WrapperSubsetEval algorithm were very similar for all the folds. A total of 15 attributes were selected considering the 10 runs and 9 of these attributes where selected for each one of the folds..
(11) Taking into account this information, a classification method can be developed considering only the most representative attributes as the attributes selected in at least one of the runs of the WrapperSubsetEval algorithm. Furthermore, this approach can be tailored considering only those attributes that appears in a higher number of executions. Thus, a threshold value can be established and only those variables that appear in at least n selection processes should be considered as relevant (a threshold value of 0 will use all the selected variables). Results provided by both the approaches are summarized in Table 7. These results correspond with the classification performance provided by a K* algorithm that only uses as inputs the features selected by the wrapper. It should be noted that these results are better (in terms of AUROC) than the results summarized in Table 2 (reference model). Table 7 presents the best classification model for CD-related proteins based on 11 variables: EMi, EMm, EMs, PKJi, PKJm, PKJt, vdWAi, vdWAs, vdWAt, AC2Pc, and AC2Pi. This model presents excellent values of AUROC (0.992/0.978) and TP rate (88.2%/88.9%) for validation and training sets.. Table 7. Summary for feature selection WrapperSubsetEvaluator. Threshold. Training. Validation. TP rate. FP rate. F-measure. AUROC. TP rate. FP rate. F-measure. AUROC. Feat. no.. All variables. 0.890. 0.108. 0.890. 0.976. 0.887. 0.121. 0.885. 0.990. 15. > = 90%. 0.889. 0.110. 0.888. 0.978. 0.882. 0.126. 0.881. 0.992. 11. 100%. 0.883. 0.115. 0.883. 0.976. 0.870. 0.139. 0.868. 0.985. 9. 3.4. CD-related protein prediction The best model has been used to predict the CD biological activity for 7409 PDB chains (3370 proteins) that have “unknown function” in the PDB Databank. These protein chains were not included into the model dataset. We filter the results using a prediction probability greater than 95%. Table SM2 (Supplementary material) presents the chains of 40 proteins with more than one chain predicted to be CDrelated, ordered by organism. The results predicted CD-related proteins in diverse organisms. We can observe that CD-related proteins have been predicted in organisms with high pathology such as Helicobacter pylori (chronic gastritis), Bacteroides thetaiotaomicron (peritonitis, septicemia), Mycobacterium tuberculosis (tuberculosis), Staphylococcus aureus (pneumonia, meningitis, osteomyelitis, endocarditis, toxic shock syndrome, bacteremia, sepsis), Streptococcus pneumonia (meningitis, bacteremia, sepsis, septic arthritis, endocarditis, peritonitis, pericarditis, brain abscess) or Vibrio cholera (cholera). Some examples of proteins from the above organisms are as follows: 2G3V is a CAG pathogenicity island protein 13 from Helicobacter pylori ( Stein et al., 2001). Pathogenicity islands (PAIs) are a distinct class of genomic islands acquired by microorganisms through horizontal gene transfer ( Hacker and Kaper, 2000 and Hacker et al., 1990). 4G5A is a hypothetical protein in Bacteroides thetaiotaomicron with unknown function (the structure will be soon published). 1YLK is a carbonate dehydratase (lyase=EC 4.2.1.1) involved in the nitrogen metabolism of Mycobacterium tuberculosis ( Murakami and Sly, 1987). 1XSV is a hypothetical protein in Staphylococcus aureus with possible DNA/RNA binding domains according to the Structural Classification of Proteins (SCOPE) ( Murzin et al., 1995) and with homology with a repressor DNA binding domain according to CATH classification.
(12) (hierarchical domain classification of protein structures based on Class, Architecture, Topology and Homologous superfamily) (Orengo et al., 1998). Other organisms live in extreme environment such as Desulfotalea psychrophila (temperature below 0 °C), Geobacillus thermodenitrificans (temperatures, pH and salinities ranging from 45 to 69 °C, 7.0 to 8.5 and 0% to 5% w/v), Listeria innocua (extreme pH and temperature, and high salt concentration), Pyrobaculum aerophilum (boiling marine water), Pyrococcus horikoshii (hyperthermophilic extermophile, 98 °C, dwells at a depth of 1395 m), Shewanella oneidensis (reduce poisonous heavy metal), Sulfolobus solfataricus (volcanic hot springs with ample sulfur and low pH), Thermococcus onnurineus (sulfur-reducing hyperthermophilic), Thermotoga maritime (waters at 55–90 °C) or Thermus thermophilus (extremely thermophilic). For the next description of the biological processes for predicted proteins is used the information from the Structural Biology Knowledgebase (Berman et al., 2009 and Gabanyi et al., 2011). The human proteins in Table SM2 are 3DRX and 4DWF. The first one (3DRX) is a pentameric assembly of potassium channel tetramerization domain-containing protein 5 involved in virus–host interaction biological process and protein homooligomerization. The second one (4DWF) is involved in several biological processes such as cell differentiation, chromatin modification, embryo development, DNA damage response, signal transduction by p53 class mediator resulting in induction of apoptosis, apoptosis in response to endoplasmic reticulum stress, negative regulation of proteasomal ubiquitin-dependent protein catabolic process, protein stabilization, regulation of cell proliferation or tail-anchored membrane protein insertion into ER membrane. In Table SM3 (Supplementary material) are presented human proteins that have been predicted to be CD-related (even proteins with one chain) with the same CD-related probability (>95%). 1IUR is a protein involved in ATP binding, chaperone binding, negative regulation of inclusion body assembly and protein folding. Therefore, it is directly linked with the cell death (Gabanyi et al., 2011). 1J7D is an ubiquitin-protein ligase involved in diverse biological processes liked with the CD: DNA double-strand break processing, histone ubiquitination, nucleotide-binding oligomerization domain containing signaling pathway, regulation of DNA repair, regulation of histone modification and postreplication repair. Protein 1UTU is linked with important cell processes such as DNA repair, regulation of transcription, DNA-dependent, transcription and DNA-dependent. 3EEC is a protein participating with the cellular membrane organization, egress of virus within host cell, class mediator resulting in cell cycle arrest, negative regulation of epidermal growth factor, negative regulation of ubiquitin-protein ligase activity involved in mitotic cell cycle and apoptotic process. No direct link with important cellular activities was found for protein 2KKQ. It is a structural constituent of muscle, involved in muscle contraction. Based on these results, it can be observed that the final classification model can predict possible CDrelated proteins, involved in important biological processes, similar with the known CD-proteins. The identification of new CD-related proteins can help to understand the complex pathologies at molecular level. Knowing the CD-related proteins in human can help to identify these proteins and target them. In the case of other organisms such as pathogenic bacteria, it is possible to find better treatment options.. 4. Conclusions The current work presents the first classification model to predict cell death-related proteins based on Markov mean properties calculated with MInD-Prot tool. These protein descriptors have calculated 2423 protein chains using the topological information of the amino acid contact networks of the proteins, the atom physicochemical properties (Mulliken Electronegativity, Kang-Jhon Polarizability, vdW area, Atom Contribution to P) and the protein 3D regions. Several tests were performed and K* algorithm seems to be the most accurate to solve this problem according to the different statistics calculated. In the first step, a reference model was provided using all the attributes (20) calculated with MInD-Prot. Several feature subset methods were proposed and the trials show that the reference results can be improved using only 11 from 20 original variables. This model was used to predict the CD-related activity of 7409 protein chains labeled with “unknown.
(13) function” in the PDB Databank. The best predictions were presented for several types of organisms such as bacteria, parasites and Homo sapiens. These results can help to predict CD-related proteins using only a reduced amount of molecular information encoded into the protein 3D structure. Therefore, with the new predictions it is possible to search for new molecular targets involved in diverse diseases.. Acknowledgments Cristian R. Munteanu acknowledges the funding support for a research position by the “Isidro Parga Pondal” Program from Xunta de Galicia, Spain (supported by the European Social Fund). This work is supported by the General Directorate of Culture, Education and University Management of Xunta de Galicia (Ref. 10SIN105004PR) and “Collaborative Project on Medical Informatics (CIMED)” PI13/00280 funded by the Carlos III Health Institute.. References Aguiar-Pulido et al., 2010. V. Aguiar-Pulido, J.A. Seoane, J.R. Rabunal, J. Dorado, A. Pazos, C.R. Munteanu. Machine learning techniques for single nucleotide polymorphism–disease classification models in schizophrenia. Molecules, 15 (2010), pp. 4875–4889. D.W. Aha. Tolerating noisy, irrelevant and novel attributes in instance-based learning algorithms. Int. J. Man–Mach. Stud., 36 (1992), pp. 267–287. Aha and Kibler, 1989. Aha, D.W., and Kibler, D., Noise-tolerant instance-based learning algorithms. In: Proceedings of the Eleventh International Joint Conference on Artificial Intelligence, vol. 1. Citeseer, 1989, pp. 794–799. Aha et al., 1991. D.W. Aha, D. Kibler, M.K. Albert. Instance-based learning algorithms. Mach. Learn., 6 (1991), pp. 37–66. Aparna et al., 2005. V. Aparna, J. Jeevan, M. Ravi, G.R. Desiraju, B. Gopalakrishnan. 3D-QSAR studies on antitubercular thymidine monophosphate kinase inhibitors based on different alignment methods. Bioorg. Med. Chem. Lett., 16 (2005), pp. 1014–1020. Archer, 1978. S. Archer. QSAR: a critical appraisal. NIDA Res. Monogr. (1978), pp. 86–102. Berman et al., 2000. H.M. Berman, J. Westbrook, Z. Feng, G. Gilliland, T.N. Bhat, H. Weissig, I.N. Shindyalov, P.E. Bourne. Protein Data Bank Nucl. Acids Res., 28 (2000), pp. 235–242. Berman et al., 2009. H.M. Berman, J.D. Westbrook, M.J. Gabanyi, W. Tao, R. Shah, A. Kouranov, T. Schwede, K. Arnold, F. Kiefer, L. Bordoli, J. Kopp, M. Podvinec, P.D. Adams, L.G. Carter, W. Minor, R. Nair, J. La Baer. The protein structure initiative structural genomics knowledge base. Nucl. Acids Res., 37 (2009), pp. D365– D368. Bhardwaj et al., 2005. N. Bhardwaj, R.E. Langlois, G. Zhao, H. Lu. Kernel-based machine learning protocol for predicting DNA-binding proteins. Nucl. Acids Res., 33 (2005), pp. 6486–6493. Bishop, 1995. C.M. Bishop. Neural Networks for Pattern Recognition. Oxford University Press, USA (1995). Bishop, 2006. C.M. Bishop. Pattern Recognition and Machine Learning. Springer, New York, USA. (2006). Breiman, 2001. L. Breiman. Random Forest. Mach. Learn., 45 (2001), pp. 5–32. Candi et al., 2005. E. Candi, R. Schmidt, G. Melino. The cornified envelope: a model of cell death in the skin. Nat. Rev. Mol. Cell Biol., 6 (2005), pp. 328–340. Carbon et al., 2009. S. Carbon, A. Ireland, C.J. Mungall, S. Shu, B. Marshall, S. Lewis. AmiGO: online access to ontology and annotation data. Bioinformatics, 25 (2009), pp. 288–289. Cleary, J.C., Trigg, L.E., 1995. K*: An Instance-based Learner Using an Entropic Distance Measure. Proceedings of the 12th International Conference on Machine Learning, 108-114. Concu et al., 2009. R. Concu, G. Podda, E. Uriarte, H. Gonzalez-Diaz. Computational chemistry study of 3Dstructure–function relationships for enzymes based on Markov models for protein electrostatic, HINT, and van der Waals potentials. J. Comput. Chem., 30 (2009), pp. 1510–1520. Cost and Salzberg, 1993. S. Cost, S. Salzberg. A weighted nearest neighbor algorithm for learning with symbolic features. Mach. Learn., 10 (1993), pp. 57–78. Cover and Hart, 1967. T. Cover, P. Hart. Nearest neighbor pattern classification. IEEE Trans. Inf. Theory, 13 (1967), pp. 21–27. Chawla et al., 2002. N.V. Chawla, K.W. Bowyer, L.O. Hall, W.P. Kegelmeyer. SMOTE: synthetic minority oversampling technique. J. Artif. Intell. Res., 16 (2002), pp. 321–357. da Silveira et al., 2009. C.H. da Silveira, D.E. Pires, R.C. Minardi, C. Ribeiro, C.J. Veloso, J.C. Lopes, W. Meira Jr., G. Neshich, C.H. Ramos, R. Habesch, M.M. Santoro. Protein cutoff scanning: a comparative analysis of cutoff dependent and cutoff free methods for prospecting contacts in proteins. Proteins, 74 (2009), pp. 727–743. Devillers and Balaban, 1999. J. Devillers, A.T. Balaban. Topological Indices and Related Descriptors in QSAR and QSPR. Gordon and Breach, The Netherlands (1999)..
(14) Fan et al., 2008. R.-E. Fan, K.-W. Chang, C.-J. Hsieh, X.-R. Wang, C.-J. Lin. LIBLINEAR: a library for large linear classification. J. Mach. Learn. Res., 9 (2008), pp. 1871–1874. Ferri et al., 2009. C. Ferri, J. Hernandez-Orallo, R. Modroiu. An experimental comparison of performance measures for classification. Pattern Recognit. Lett., 30 (2009), pp. 27–38. Frank, 2005. I.H.W.a.E. Frank. Data Mining: Practical Machine Learning Tools and Techniques. Kaufmann, San Francisco (2005). Gabanyi et al., 2011. M.J. Gabanyi, P.D. Adams, K. Arnold, L. Bordoli, L.G. Carter, J. Flippen-Andersen, L. Gifford, J. Haas, A. Kouranov, W.A. McLaughlin, D.I. Micallef, W. Minor, R. Shah, T. Schwede, Y.P. Tao, J.D. Westbrook, M. Zimmerman, H.M. Berman. The structural biology knowledgebase: a portal to protein structures, sequences, functions, and methods. J. Struct. Funct. Genomics, 12 (2011), pp. 45–54. Galluzzi et al., 2008. L. Galluzzi, J.M. Vicencio, O. Kepp, E. Tasdemir, M.C. Maiuri, G. Kroemer. To die or not to die: that is the autophagic question. Curr. Mol. Med., 8 (2008), pp. 78–91. Golstein and Kroemer, 2007. P. Golstein, G. Kroemer. Cell death by necrosis: towards a molecular definition. Trends Biochem. Sci., 32 (2007), pp. 37–43. Gonzalez-Diaz et al., 2005a. H. Gonzalez-Diaz, R. Molina, E. Uriarte. Recognition of stable protein mutants with 3D stochastic average electrostatic potentials. FEBS Lett., 579 (2005), pp. 4297–4301. Gonzalez-Diaz et al., 2008. H. Gonzalez-Diaz, F. Prado-Prado, F.M. Ubeira. Predicting antimicrobial drugs and targets with the MARCH-INSIDE approach. Curr. Top. Med. Chem., 8 (2008), pp. 1676–1690. Gonzalez-Diaz et al., 2005b. H. Gonzalez-Diaz, A. Perez-Bello, E. Uriarte, Y. Gonzalez-Diaz. QSAR study for mycobacterial promoters with low sequence homology. Bioorg. Med. Chem. Lett., 16 (2005), pp. 547–553. Gonzalez-Diaz et al., 2006. H. Gonzalez-Diaz, F.J. Prado-Prado, L. Santana, E. Uriarte. Unify QSAR approach to antimicrobials. Part I: Predicting antifungal activity against different species. Bioorg. Med. Chem., 14 (2006), pp. 5973–5980. Gonzalez-Diaz et al., 2007a. H. Gonzalez-Diaz, L. Saiz-Urra, R. Molina, Y. Gonzalez-Diaz, A. Sanchez-Gonzalez. Computational chemistry approach to protein kinase recognition using 3D stochastic van der Waals spectral moments. J. Comput. Chem., 28 (2007), pp. 1042–1048. Gonzalez-Diaz et al., 2012. H. Gonzalez-Diaz, C.R. Munteanu, L. Postelnicu, F. Prado-Prado, M. Gestal, A. Pazos. LIBP-Pred: web server for lipid binding proteins using structural network parameters; PDB mining of human cancer biomarkers and drug targets in parasites and bacteria. Mol. BioSyst., 8 (2012), pp. 851–862. Gonzalez-Diaz et al., 2010a. H. Gonzalez-Diaz, F. Romaris, A. Duardo-Sanchez, L.G. Perez-Montoto, F. PradoPrado, G. Patlewicz, F.M. Ubeira. Predicting drugs and proteins in parasite infections with topological indices of complex networks: theoretical backgrounds, applications, and legal issues. Curr. Pharm. Des., 16 (2010), pp. 2737–2764. Gonzalez-Diaz et al., 2010b. H. Gonzalez-Diaz, A. Duardo-Sanchez, F.M. Ubeira, F. Prado-Prado, L.G. PerezMontoto, R. Concu, G. Podda, B. Shen. Review of MARCH-INSIDE & complex networks prediction of drugs: ADMET, anti-parasite activity, metabolizing enzymes and cardiotoxicity proteome biomarkers. Curr. Drug Metab., 11 (2010), pp. 379–406. Gonzalez-Diaz et al., 2011. H. Gonzalez-Diaz, F. Prado-Prado, X. Garcia-Mera, N. Alonso, P. Abeijon, O. Caamano, M. Yanez, C.R. Munteanu, A. Pazos, M.A. Dea-Ayuela, M.T. Gomez-Munoz, M.M. Garijo, J. Sansano, F.M. Ubeira. MIND-BEST: web server for drugs and target discovery; design, synthesis, and assay of MAO-B inhibitors and theoretical–experimental study of G3PDH protein from Trichomonas gallinae. J. Proteome Res., 10 (2011), pp. 1698–1718. González-Díaz et al., 2007b. H. González-Díaz, Y. Pérez-Castillo, G. Podda, E. Uriarte. Computational chemistry comparison of stable/nonstable protein mutants classification models based on 3D and topological indices. J. Comput. Chem., 28 (2007), pp. 1990–1995. González-Díaz et al., 2007c. H. González-Díaz, L. Saiz-Urra, R. Molina, L. Santana, E. Uriarte. A model for the recognition of protein kinases based on the entropy of 3D van der Waals interactions. J. Proteome Res., 6 (2007), pp. 904–908. González-Díaz et al., 2009. H. González-Díaz, F. Prado-Prado, L.G. Pérez-Montoto, A. Duardo-Sánchez, A. LópezDíaz. QSAR models for proteins of parasitic organisms, plants and human guests: theory, applications, legal protection, taxes, and regulatory issues. Curr. Proteomics, 6 (2009), pp. 214–227. Hacker and Kaper, 2000. J. Hacker, J.B. Kaper. Pathogenicity islands and the evolution of microbes. Annu. Rev. Microbiol., 54 (2000), pp. 641–679. Hacker et al., 1990. J. Hacker, L. Bender, M. Ott, J. Wingender, B. Lund, R. Marre, W. Goebel. Deletions of chromosomal regions coding for fimbriae and hemolysins occur in vitro and in vivo in various extraintestinal Escherichia coli isolates. Microb. Pathog., 8 (1990), pp. 213–225. Hall, M., Frank, E., Holmes, G., Pfahringer, B., Reutemann, P., Witten, I.A., 2009. The WEKA data mining software: an update. SIGK DD Explor.11. Pages 10-18. Han et al., 2006. L. Han, J. Cui, H. Lin, Z. Ji, Z. Cao, Y. Li, Y. Chen. Recent progresses in the application of machine learning approach for predicting protein functional class independent of sequence similarity. Proteomics, 6 (2006), pp. 4023–4037. Hayes and Borodovsky, 1998. W.S. Hayes, M. Borodovsky. How to interpret an anonymous bacterial genome: machine learning approach to gene identification. Genome Res., 8 (1998), pp. 1154–1171.
(15) Hilario et al., 2003. M. Hilario, A. Kalousis, M. Muller, C. Pellegrini. Machine learning approaches to lung cancer prediction from mass spectra. Proteomics, 3 (2003), pp. 1716–1719. Hou and Xu, 2003. T.J. Hou, X.J. Xu. ADME evaluation in drug discovery. 2. Prediction of partition coefficient by atom-additive approach based on atom-weighted solvent accessible surface areas. J. Chem. Inf. Comput. Sci., 43 (2003), pp. 1058–1067. Ivanciuc, 2009. O. Ivanciuc. Machine learning Quantitative structure–activity relationships (QSAR) for peptides binding to human amphiphysin-1 SH3 domain. Curr. Proteomics, 6 (2009), pp. 289–302. Jin, 2005. H. Jin. Using AUC and accuracy in evaluating learning algorithms. IEEE Trans. Knowl. Data Eng., 17 (2005), pp. 299–310. John and Langley,. John, G.H. Langley, P., 1995, Estimating continuous distributions inBayesian classifiers. In: Proceedings of the 11th Conference on Uncertainty in Artificial Intelligence. Morgan Kaufman, Montreal, Quebec, pp. 338–345. Katritzky et al., 2006. A.R. Katritzky, O.V. Kulshyn, I. Stoyanova-Slavova, D.A. Dobchev, M. Kuanar, D.C. Fara, M. Karelson. Antimalarial activity: a QSAR modeling using CODESSA PRO software. Bioorg. Med. Chem., 14 (2006), pp. 2333–2357. Kerr et al., 1972. J.F. Kerr, A.H. Wyllie, A.R. Currie. Apoptosis: a basic biological phenomenon with wide-ranging implications in tissue kinetics. Br. J. Cancer, 26 (1972), pp. 239–257. Kohavi and John, 1997. R. Kohavi, G.H. John. Wrappers for feature subset selection. Artif. Intell., 97 (1997), pp. 273–324. Kroemer et al., 2005. G. Kroemer, W.S. El-Deiry, P. Golstein, M.E. Peter, D. Vaux, P. Vandenabeele, B. Zhivotovsky, M.V. Blagosklonny, W. Malorni, R.A. Knight, M. Piacentini, S. Nagata, G. Melino. Classification of cell death: recommendations of the nomenclature committee on cell death. Cell Death Differ., 12 (Suppl. 2) (2005), pp. S1463–S1467. Kroemer et al., 2009. G. Kroemer, L. Galluzzi, P. Vandenabeele, J. Abrams, E.S. Alnemri, E.H. Baehrecke, M.V. Blagosklonny, W.S. El-Deiry, P. Golstein, D.R. Green, M. Hengartner, R.A. Knight, S. Kumar, S.A. Lipton, W. Malorni, G. Nunez, M.E. Peter, J. Tschopp, J. Yuan, M. Piacentini, B. Zhivotovsky, G. Melino. Classification of cell death: recommendations of the nomenclature committee on cell death 2009. Cell Death Differ., 16 (2009), pp. 3–11. Lavine et al., 2004. B.K. Lavine, C.E. Davidson, W.S. Rayens. Machine learning based pattern recognition applied to microarray data. Comb. Chem. High Throughput Screen, 7 (2004), pp. 115–131. Levine and Yuan, 2005. B. Levine, J. Yuan. Autophagy in cell death: an innocent convict?. J. Clin. Investig., 115 (2005), pp. 2679–2688. Liu and Setiono,. Liu, H., and Setiono, R., 1996, A probabilistic approach to feature selection–A filter solution. In: Proceedings of the 13th International Conference on Machine Learning, Bari, Italy, pp. 319–327. MacKay, 2003. D.J. MacKay. Information Theory, Inference and Learning Algorithms. Cambridge University Press, Cambridge, UK. (2003). McLachlan et al., 2004. G.J. McLachlan, K.-A. Do, C. Ambroise. Analyzing Microarray Gene Expression Data. Wiley, Hoboken, New Jersey, USA. (2004). Melino, 2001. G. Melino. The sirens ׳song. Nature, 412 (2001), p. 23. Melino et al., 2000. G. Melino, E. Candi, P.M. Steinert. Assays for transglutaminases in cell death. Methods Enzymol., 322 (2000), pp. 433–472. Munteanu and González-Díaz,. Munteanu, C.R., González-Díaz, H., 2012, MInD-Prot–Markov Indices for Drugs and Proteins, Register No.: 03/2012/1051 (SC-228-12). Santiago de Compostela, Spain. Munteanu et al., 2008. C.R. Munteanu, H. Gonzalez-Diaz, A.L. Magalhaes. Enzymes/non-enzymes classification model complexity based on composition, sequence, 3D and topological indices. J. Theor. Biol., 254 (2008), pp. 476–482. Munteanu et al., 2009. C.R. Munteanu, J.M. Vazquez, J. Dorado, A.P. Sierra, A. Sanchez-Gonzalez, F.J. PradoPrado, H. Gonzalez-Diaz. Complex network spectral moments for ATCUN motif DNA cleavage: first predictive study on proteins of human pathogen parasites. J. Proteome Res., 8 (2009), pp. 5219–5228. Murakami and Sly, 1987. H. Murakami, W.S. Sly. Purification and characterization of human salivary carbonic anhydrase. J. Biol. Chem., 262 (1987), pp. 1382–1388. Murzin et al., 1995. A.G. Murzin, S.E. Brenner, T. Hubbard, C. Chothia. SCOP: a structural classification of proteins database for the investigation of sequences and structures. J. Mol. Biol., 247 (1995), pp. 536–540. Orengo et al., 1998. C.A. Orengo, A.M. Martin, G. Hutchinson, S. Jones, D.T. Jones, A.D. Michie, M.B. Swindells, J.M. Thornton. Classifying a protein in the CATH database of domain structures. Acta Crystallogr. D Biol. Crystallogr., 54 (1998), pp. 1155–1167. Perez-Bello et al., 2009. A. Perez-Bello, C.R. Munteanu, F.M. Ubeira, A.L. De Magalhaes, E. Uriarte, H. GonzalezDiaz. Alignment-free prediction of mycobacterial DNA promoters based on pseudo-folding lattice network or star-graph topological indices. J. Theor. Biol., 256 (2009), pp. 458–466. Prado-Prado et al., 2011. F.J. Prado-Prado, I. Garcia, X. Garcia-Mera, H. Gonzalez-Diaz. Entropy multi-target QSAR model for prediction of antiviral drug complex networks. Chemom. Intell. Lab. Syst., 107 (2011), pp. 227–233. Prank et al., 2005. K. Prank, E. Schulze, O. Eckert, T.W. Nattkemper, M. Bettendorf, C. Maser-Gluth, T.J. Sejnowski, A. Grote, E. Penner, A. von Zur Muhlen, G. Brabant. Machine learning approaches for phenotype–.
(16) genotype mapping: predicting heterozygous mutations in the CYP21B gene from steroid profiles. Eur. J. Endocrinol., 153 (2005), pp. 301–305. Puzyn et al., 2010. T. Puzyn, J. Leszczynski, M.T.D. Cronin (Eds.), Recent Advances in QSAR Studies: Methods and Applications, Springer, New York, USA. (2010). Rodriguez-Soca et al., 2010a. Y. Rodriguez-Soca, C.R. Munteanu, J. Dorado, J. Rabuñal, A. Pazos, H. GonzálezDíaz. Plasmod-PPI: a web-server predicting complex biopolymer targets in plasmodium with entropy measures of protein–protein interactions. Polymer, 51 (2010), pp. 264–273. Rodriguez-Soca et al., 2010b. Y. Rodriguez-Soca, C.R. Munteanu, J. Dorado, A. Pazos, F.J. Prado-Prado, H. Gonzalez-Diaz. Trypano-PPI: a web server for prediction of unique targets in trypanosome proteome by using electrostatic parameters of protein–protein interactions. J. Proteome Res., 9 (2010), pp. 1182–1190. Shannon et al., 1949. C.E. Shannon, W. Weaver, R.E. Blahut, B. Hajek. The mathematical theory of communication. University of Illinois Press, Urbana (1949). Speck-Planche and Kleandrova, 2012. A. Speck-Planche, V.V. Kleandrova. QSAR and molecular docking techniques for the discovery of potent monoamine oxidase B inhibitors: computer-aided generation of new rasagiline bioisosteres. Curr. Top. Med. Chem., 12 (2012), pp. 1734–1747. Speck-Planche et al., 2012. A. Speck-Planche, V.V. Kleandrova, F. Luan, M.N. Cordeiro. Rational drug design for anti-cancer chemotherapy: multi-target QSAR models for the in silico discovery of anti-colorectal cancer agents. Bioorg. Med. Chem., Vol. 20 (2012), pp. 4848–4855. Stein et al., 2001. Stein, M., Rappuoli, R., and Covacci, A., 2001. The cag Pathogenicity Island. Sternberg et al., 1994. M.J. Sternberg, R.D. King, R.A. Lewis, S. Muggleton. Application of machine learning to structural molecular biology. Philos. Trans. R. Soc. Lond. B Biol. Sci., 344 (1994), pp. 365–371. Swets, 1996. J.A. Swets. Signal Detection Theory and Roc Analysis in Psychology and Diagnostics: Collected Papers. Lawrence Erlbaum Associates, Mahwah, NJ (1996). Teetor, 2011. P. Teetor. R Cookbook. O’Reilly, California, USA. (2011). Todeschini and Consonni, 2002. R. Todeschini, V. Consonni. Handbook of Molecular Descriptors. Wiley-VCH, Weinheim, Germany. (2002). Wang and Dunbrack, 2003. G. Wang, R.L. Dunbrack Jr.. PISCES: a protein sequence culling server. Bioinformatics, 19 (2003), pp. 1589–1591. Wang et al., 2005. Y.H. Wang, Y. Li, S.L. Yang, L. Yang. Classification of substrates and inhibitors of Pglycoprotein using unsupervised machine learning approach. J. Chem. Inf. Model, 45 (2005), pp. 750–757. Witten and Frank, 2005. I. Witten, E. Frank. Data Mining: Practical Machine Learning Tools and Techniques. Morgan Kaufmann Series in Data Management Systems (second edition), Morgan Kaufmann, San Francisco, USA. (2005). Witten and Frank, 2000. Witten, I.H., and Frank, E., Data Mining: Practical Machine Learning Tools and Techniques with Java Implementations, in: Publishers, M. K., (Ed.), Vol. Chapter 8. 2000, pp. 265–320..
(17)
Figure
+3


Documento similar