4
Buenos Aires, 1996
Geofísica
Interpretación Geofísica
(Magnética) Sierras de Chepes y
de Las Minas
N. Hungerford, P.E. Pieters
AGSO
MAPEO GEOCIÉNTIFICO DE LAS SIERRAS PAMPEANAS
PROYECTO COOPERATIVO ARGENTINO-AUSTRALIANO
Versión en inglés
SERIE CONTRIBUCIONES TÉCNICAS
GEOFÍSICA 4
Interpretación Geofísica
(Magnética) Sierras de Chepes
y de las Minas
N. Hungerford, P. E. Pieters
AGSO
MAPEO GEOCIENTÍFICO DE LAS SIERRAS PAMPEANAS
PROYECTO COOPERATIVO ARGENTINO-AUSTRALIANO
Versión en inglés
SECRETARÍA DE MINERÍA DE LA NACIÓN SERVICIO GEOLÓGICO MINERO ARGENTINO
AUTORIDADES
Presidente de la Nación
Dra. CRISTINA FERNÁNDEZ DE KIRCHNER
Ministro de Planificación Federal, inversión pública y servicios
Arq. JULIO DE VIDO
Secretario de Minería – Presidente del SEGEMAR
Ing. JORGE MAYORAL
Secretario Ejecutivo
Lic. PEDRO ALCÁNTARA
Director del Instituto de Geología y Recursos Minerales
Lic. ROBERTO F. N. PAGE
Servicio Geológico Minero Argentino
Avenida Julio A. Roca 651
·
10º piso
1322
·
Buenos Aires
República Argentina
CONTENTS
ABSTRACT ... 1
1.0 INTRODUCTION... 2
1.1. LOCATION AND ACCESS...2
1.2. AIRBORNE GEOPHYSICAL SURVEY...3
2.0 METHODS ... 5
2.1. DATA PROCESSING...5
2.2. IMAGE PROCESSING...5
2.2.1. Magnetic field inclination...5
2.2.2. High frequency noise ...6
2.2.3. Geological strike ...6
2.3. INTERPRETATION PROCEDURES...6
2.4. MAGNETIC MODELING...7
2.5. MAGNETIC SUSCEPTIBILITIES...8
2.6. COMPARISON OF SURVEY AREAS...9
3.0 MAGNETIC DOMAINS ... 11
4.0 MAGNETIC PROFILE... 12
BIBLIOGRAPHY ... 16
TABLES Table 1 – Geophysical signatures of common rock-types...8
Table 2 – Summary of magnetic susceptibility (SI x 10-5) properties of rocks from Sierras de San Luis y Comechigones...9
Table 3 - Description of magnetic domains....13
FIGURES Figure 1 – Location of the project area...4
ABSTRACT
This report and accompanying 1:250.000 scale magnetic interpretation map covering the
Sierra de Chepes, Sierra de Las Minas and the southernmost part of the Sierra Los Llanos is a
product of the Geoscientific Mapping of the Sierras Pampeanas cooperative project between the
Australian Geological Survey Organisation (AGSO) and the Dirección Nacional del Servicio
Geológico (DNSG) of the Subsecretaría de Minería, República de Argentina. This report and map
provide details on one of the three separate high-resolution, airborne geophysical survey carried out
for the project, covering an area of about 9000 km2 in the southern part of La Rioja Province. The
other two surveys were carried out over the northern Sierras de Córdoba (Córdoba Province) and
Sierras de San Luis – Comechingones (San Luis and Córdoba Provinces), and the results are
reported elsewhere (Hungerford & others, 1996 a & b).
For the airborne geophysical survey, magnetic and radiometric (U, K, Th) data were
obtained by World Geoscience along flight lines spaced 500m apart, from a nominal height of
100m. To assist the aeromagnetic interpretation, magnetic susceptibilities were measured during
field work of exposed rock types. The magnetic data from the airborne survey were processed by
Hungerford Geophysical Consultants (HGC) and radiometric data were processed by AGSO. The
data were interpreted by HGC and geoscientists from AGSO at 1:1.000.000 scale and a number of
geophysical domains have been identified. In conjunction, some individual aeromagnetic anomalies
were modelled in order to obtain a dip and an estimation of the depth to source.
The interpretation of the aeromagnetic data indicates a regional geological discontinuity
between the granitoids and metasediments of Sierra de Chepes and Los Llanos in the north and the
granitoids of Sierra de Las Minas in the south. The rocks in the north are generally more magnetic,
and in the south there is evidence for a large domain associates with granitoids which either is
remanently magnetised or is underline by a very low magnetic granitoids or metasediments.
1.0
INTRODUCTION
Funded by Government of the Argentine Republic, the Geoscientific Mapping of the
Sierras Pampeanas is a cooperative project between the Australian Geological Survey Organisation
(AGSO) and the Dirección Nacional del Servicio Geológico (DNSG) of the Subsecretaría de
Minería. As a pilot second generation mapping program, the project aims to update the
geoscientific knowledge base, provide a modern framework for resource assessment; and, promote
exploration and development in the region.
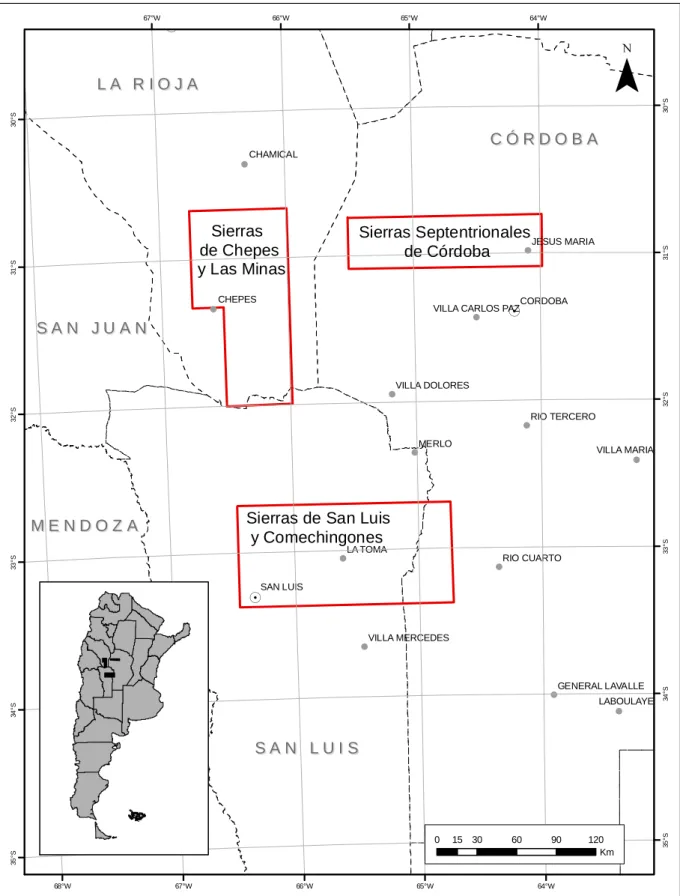
The project covers three separate areas totalling 27.000 km2 in the southern part of the
Sierras Pampeanas, Argentina (Figure 1), where basement Precambrian to Palaeozoic metamorphic
and granitoids crop out at the eastern margin of the Andean Mobile Belt. The area, best known for
its production of industrial and construction materials, also contains metallic deposits. Mineral
resources include gold and polymetallic (Au, Ag, Pb, Zn) vein deposits with past production of
tungsten, bismuth, tin, manganese, and chromium. The areas were selected to provide key
information on their geology and mineral potential through the application of integrated
geophysical and geological mapping, as well as metallogenic analysis, and to provide a continuous
section of the major tectonostratigraphic packages comprising the southern Sierras Pampeanas.
As a major part of the program, a high resolution airborne magnetic and radiometric
(gamma-ray spectrometrics) survey was carried out over three project areas in the Provinces of
Córdoba, La Rioja y San Luis.
This report details the interpretation of magnetic data from the Sierra de Chepes, Sierra de
Las Minas and the southernmost Sierra de Los Llanos (La Rioja Province), and accompanies the
1:250.000 scale magnetic interpretation map.
The principal objective in the section of this area was to carry out modern geological and
geophysical mapping in a key transect of the southwest Sierras Pampeanas in order to contribute to
a better understanding of the geological history in the framework of plate tectonic concepts. The
selection of this area aimed to provide a comparative evaluation of the mineral potential of the
Sierra de Chepes and the Sierra de Las Minas, and to develop a modern geological model for the
formation of the know gold and other mineral deposits.
1.1.
Location and access
The integrated geological and geophysical program covered some 9000 km2 in a 60 km by
150 km belt between 30º40’-32º00’S and 66º00’-66º45’W, and includes the Sierra de Chepes,
Sierra de Las Minas and the southernmost Sierra de Los Llanos and the adjacent alluvial plains.
The well known gold mining district of Las Callanas is located in the western central part of the
Sierra de Las Minas. The area cover parts of two 1:250.000 scale map sheets: 3166-I (Chamical)
and 3166-III (Chepes).
The main town, and administrative and business centre in the area is Chepes, located in the
plain separating the Sierra de Chepes and Sierra de Las Minas. The access to Chepes from La
Rioja, Córdoba, San Luis and Sa Juan is by national and provincial roads. The sierras are
surrounded by mostly unsealed roads, and in places vehicle tracks enter the hills and mountains
providing access to small villages and farms.
1.2.
Airborne geophysical survey
The airborne geophysical survey was flown by World Geoscience between January and
August 1995 under the supervision of the Australian Geological Survey Organisation (AGSO). The
aircraft flew east-west lines spaced 500 m apart and maintained a mean sensor high of 100 m for all
survey areas. Survey specifications are given by Hone (1994) and technical details and survey
logistics are documented by Chambers (1996) and World Geoscience (1996).
! ! . ! ! ! ! . ! ! ! ! ! ! ! ! . ! ! MERLO CHEPES CORDOBA LA TOMA CHAMICAL SAN LUIS LABOULAYE RIO CUARTO VILLA MARIA RIO TERCERO JESUS MARIA VILLA DOLORES VILLA MERCEDES GENERAL LAVALLE VILLA CARLOS PAZ
64°W 64°W 65°W 65°W 66°W 66°W 67°W 67°W 68°W 30 °S 30 °S 31 °S 31 °S 32 °S 32 °S 33 °S 33 °S 34 °S 34 °S 35 °S 35 °S
0 15 30 60 90 120 Km Sierras
de Chepes y Las Minas
Sierras Septentrionales de Córdoba
Sierras de San Luis y Comechingones
C Ó R D O B A
C Ó R D O B A
L A R I O J A
L A R I O J A
S A N L U I S
S A N L U I S
S A N J U A N
S A N J U A N
M E N D O Z A
M E N D O Z A
¯
Figure 1 – Location of the project area
2.0
METHODS
2.1.
Data processing
AGSO supplied all magnetic and gamma-ray spectrometric data to Hungerford
Geophysical Consultants (HGC) in the form of ER-Mapper grids of Total Magnetic Intensity.
These grids were produced by AGSO using a mesh size of 120 m.
HGC converted the ER-Mapper grids to Geosoft grids for subsecuent filtering, shadowing,
printing, and interpretation. Colour images at 1:100.000 were generated and printed at AGSO.
Images include:
a) Total Magnetic Field, Reduce to Pole,
b) First Vertical Derivative, Reduce to Pole,
c) And Analytic Signal (selected areas only).
In addition, HGC used images of the Total Field, and Reduce to the Pole Field at
1:250.000. Landsat images and Radiometric Ternary images of U, K and Th, produced by AGSO at
1:100.000 and 1:250.000 scales were used with magnetic images to assist interpretation,
particularly in indicating lithological contacts and areas covered by recent alluvials.
2.2.
Image processing
In processing images of the magnetic data for interpretation, due cognisance was made of
the local magnetic field inclination, the presence of high-frequency noise, and the local geological
strike.
2.2.1.
Magnetic field inclination
The regional magnetic field inclination in the Sierra de Chepes and de Las Minas is about
-30 degrees. As a consequence of such a shallow inclination, induced magnetic anomalies are
considerably offset from their magnetic sources thus creating a false impression of the true
geological structure. This problem was solved by calculating the magnetic field Reduced to the
Pole (RTP) (i.e., assuming a vertical magnetic field), which places a magnetic anomaly over its
source, allowing a accurate interpretation to be carried out. Therefore, only RTP images were used
in the interpretation
Reduction to the Pole can be misleading, however, when a strong degree of natural
remanence is present in a particular rock type. In which case an assumption of purely induced
magnetisation will lead to an incorrectly calculated source position. Calculation of the Analytic
Signal, which is a function of all three orthogonal derivatives of earth’s field, will place the
resultant anomaly correctly over the magnetic source whether that source is remanently magnetised
or not. Except for some Cainozoic volcanic rocks, remanently magnetised sources appear to be
unlikely in the metamorphic basement. The Analytic Signal results need to be treated with some
caution however, and should be used in conjunction with the RTP images.
2.2.2.
High frequency noise
The 1st Vertical Derivative images show that some of the survey area has an incoherent
low-amplitude, high-frequency noise superimposed on the magnetic back ground. Investigation of
some individual profiles, from the located labelled data, revealed that the noise has sub-nT
amplitudes and wavelengths of 10 m to 100 m (sample spacing is about 7 m). The noise is likely to
be a combination of instrumental a surficial geological noise, the latter due to iron-rich material
such as maghaemite or laterite on the ground. It’s unlike to contain any bedrock geological signal
since the wavelength should be at last 100 m for a sensor height of 100 m above the source.
Bedrock geology signals should be improved by applying a low pass filter prior gridding.
2.2.3.
Geological strike
In some parts of a survey area the local geological strike may be an acute angle to the flight
lines. This creates problems for the gridding process resulting in a lack of continuity along strike,
the “string of pearls” effect. This, in turn, can lead to a misinterpretation of magnetic trends as
north-south rather than, say, north west-south east. For such regions, consideration should be given
to gridding them separately, or using a different gridding algorithm that will allow discordant
geological trends to be incorporated into the overall grid.
2.3.
Interpretation procedures
The aeromagnetic interpretations for each survey area were done at 1:100.000 scale. The
boundaries of each magnetic domain were selected on the basis of magnetic character (e.g.,
anomaly wavelength, amplitude, strike dimension) and, to some extent, radiometric response in
areas of basement exposure.
Shear zones have been identified by their magnetic continuity and the occurrence of linear
low magnetic trends that could be the result of magnetite destruction.
Cross faults were selected from magnetic linears revealed by shadowing grey scale images
of the 1st Vertical Derivative and the Analytic Signal. They are often seen as the cause of
dislocations of magnetic units and may also indicate their sense of movement.
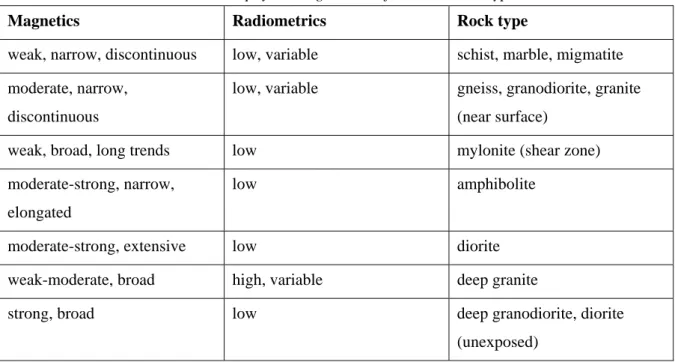
The geophysical signatures of the various rock types are classified in Table 1. These
characteristics were used to outline domain boundaries on the image maps. Low, weak, moderate,
etc. refer to relative anomaly amplitudes.
2.4.
Magnetic modeling
Estimates of source depth and dip for selected anomalies were made and plotted at
1:250.000 scale.
Most modelling was done across each anomaly via profiles extracted from the Total Field
grid. As the grid mesh is 120 m, the along-line reading interval is also 120 m. This limits the
accuracy of depth determination but is a simpler and quicker way of obtaining regional structural
information than windowing out individual profiles from the original line data.
The Geosoft modelling inversion program MAGMOD was employed in the modelling. This program allows for the input of simple tabular, ribbon (dike), or step (fault) bodies, and
although care is required when deciding on likely input parameters (particularly the background
base level and slope), the technique is very rapid. Experience shows that the output model is
generally realistic.
More complex multibody modelling could be carried out but, at present, this is probably
unnecessary unless sufficient geological constraints established by outcrop mapping are applied.
Under recent cover depth to bedrock can be difficult to estimate where no magnetic
anomalies from which to calculate depths exist. Where anomalies do exist they may be caused by
large deep batholiths and depth to source do not truly reflect the cover thickness.
Table 1 – Geophysical signatures of common rock-types
Magnetics Radiometrics Rock type
weak, narrow, discontinuous low, variable schist, marble, migmatite
moderate, narrow,
discontinuous
low, variable gneiss, granodiorite, granite
(near surface)
weak, broad, long trends low mylonite (shear zone)
moderate-strong, narrow,
elongated
low amphibolite
moderate-strong, extensive low diorite
weak-moderate, broad high, variable deep granite
strong, broad low deep granodiorite, diorite
(unexposed)
2.5.
Magnetic susceptibilities
Table 2 shows magnetic susceptibilities compiled from data during field mapping
(Stuart-Smith et al., 1996). To assist the geophysical interpretation, HGC plotted susceptibility and rock
type on overlays at 1:100.000 scale.
The magnetic susceptibilities were organised in a Excel database and histogram plots for each major rock type are given in the petrographical report where mean, median and number of
samples are also listed. It is evident from these statistics that, with the exception of the mafic rock
types such as amphibolites and intermediate volcanics, there is so much overlap across the
susceptibility spectra of most rock types that lithological identification on the basis of magnetics
alone is not possible.
Table 2 – Summary of magnetic susceptibility (SI x 10-5) properties of rocks from Sierras de San Luis y Comechingones
Rock Type Min. Max. Mean Median No. of Samples
Amphibolite 1245 3034 2167 2222 3
Breccia 19 2199 759 409 4
Granodiorite 6 51 23 20 5
Granite 1 1445 101 14 76
Gneiss 3 9905 255 20 105
Interm. Volcs 687 2710 1393 1224 6
Mylonite 7 6947 920 23 10
Pegmatite 0 19 7 6 16
Phyllite 8 591 100 22 7
Schist 1 1034 50 19 63
Tonalite 6 729 271 226 10
Ultra Mafic 2678 4343 3510 3510 2
2.6.
Comparison of survey areas
Figure 2 shows Total Magnetic Intensity (TMI) images for the three survey areas.
Comparison between the aeromagnetic responses of these areas shows there are major similarities
between the Sierras de San Luis y Comechingones (San Luis and Córdoba) and the Northern
Sierras de Córdoba (Córdoba) even though the former contains more outcropping magnetic
granites. This may imply a deeper erosional level in the San Luis area but, as the distance between
these two survey areas is about 150 km, it is not possible to draw many conclusions about their
structural relationships based on the geophysical data alone.
The La Rioja area has distinctly different aeromagnetic characteristics with generally more
intense responses, both negative and positive. The background magnetic field appears to be
substantially lower, by about 100 nT, than the San Luis and Córdoba survey areas. This may
indicate that the regional geological setting in the La Rioja area is significantly different or it could
be that the international geomagnetic reference field (IGRF) used by the contractor when
subtracting the regional magnetic field is incorrect. The La Rioja area contains more granite and
granodiorite and this is likely to be a contributing factor to the magnetic characteristics.
64°W 64°W 65°W 65°W 66°W 66°W 31 °S 31 °S 32 °S 32 °S 33 °S 33 °S
0 10 20 40 60 80 Km Sierras
de Chepes y Las Minas
Sierras Septentrionales de Córdoba
Sierras de San Luis y Comechingones
C Ó R D O B A
C Ó R D O B A
L A R I O J A
L A R I O J A
S A N L U I S
S A N L U I S
4798.0 4819.2 4833.7 4846.4 4855.1 4862.8 4869.7 4876.0 4881.9 4887.4 4892.6 4898.6 4903.4 4908.0 4912.7 4917.1 4921.5 4925.8 4930.2 4935.4 4939.7 4944.1 4948.5 4952.9 4957.5 4962.1 4967.0 4973.0 4978.2 4983.7 4989.6 4995.9 5002.7 5010.5 5019.1 5031.9 5046.4 5067.6 nT
¯
Figure 2– Total Magnetic Field (TMI) of survey areas
3.0
MAGNETIC DOMAINS
The Sierras Pampeanas are a distinct morphotectonic province comprised of
Neoproterozoic (?) to early Palaeozoic metamorphic rocks and Palaeozoic granitoids. They form a
series of block-tilted, north-south oriented ranges separated by intermontane basins which are
bounded by escarpments developed on moderate to steeply dipping reverse faults developed during
the Andean uplift (Jordan and Allmendinger, 1986).
The aeromagnetic data, reduced to pole, indicate a variety of north-south trending elongate
domains associated with granitoid bodies and outcrops of metasediments. The domains in the
Sierra de Chepes and southern Sierra de Los Llanos are much more magnetic than the domains in
the Sierra de Las Minas, and there is evidence that a large swath of the granitoids in the Sierra de
Las Minas is either remanently magnetised or is underlain by very low magnetic granitoids and/or
sediments. The northern granitoids and metasediments commonly have relatively high and variable
K and U radiometric responses whereas most of the southern granitoids have fairly low radiometric
responses (with the exception of leucocratic granites).
Northerly trending, curvilinear non-magnetic zones in both the northern and southern
sierras are interpreted to be major shear zones. Modeling suggests that these shear zones are related
to steep, east-dipping faults. In the east beneath the plains the presence of an east-dipping
half-graben is interpreted from a steep increase in depth to magnetic basement followed, in the extreme
east, by the reappearance of shallow magnetic units.
A prominent, broad low magnetic zones strikes roughly east-west and separates the Sierras
de Chepes from the Sierra de Las Minas. Similar magnetic features separate the Sierra de Chepes
from the Sierra de Los Llanos and cut across the Sierra de Las Minas in the extreme south. These
domains overlie topographic lows and are associated with graben structures in which low to
non-magnetic Carboniferous-Permian sediments are partly preserved.
In the Sierra de Las Minas northwest non-magnetic linears correspond with shear zones
which are clearly defined on Landsat images and airphotos. These shear zones form part of a
conjugate shear system of which the northeast-trending set is poorly developed, and they contain
locally gold bearing quartz veins.
In the extreme northeast, and west of the central part of the Sierra de Las Minas occur
circular magnetic trends and anomalies beneath sedimentary cover which are possibly associated
with relatively young (?Devonian) granitoid intrusions emplaced after the main phases of
deformation.
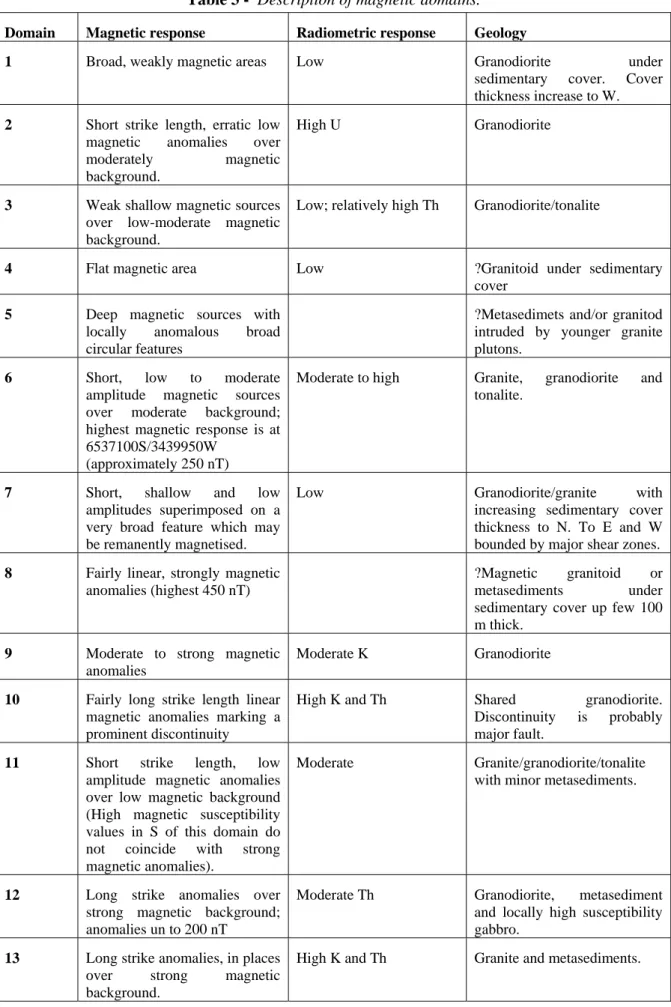
The geophysical character of the interpreted domains and the possible representative
lithologies are represented in Table 3.
4.0
MAGNETIC PROFILE
The magnetic profile on the accompanying 1:250.000 scale map across Sierra de Chepes
was extracted along line 6571663N (approximately 31ºS) and the one across the Sierra de Las
Minas along line 6494800N (approximately 31º41’S). The sections were derived from the Total
Field and individual magnetic anomalies were modelled using Geosoft MAGMOD inversion
program. As the profile was obtained from a grid where sample points along a line are 120 m
(equal to the grid mesh size), modelled depths are about ±200 m for shallow sources. Dips and
depths can only be obtained from magnetic units.
Table 3 - Description of magnetic domains.
Domain Magnetic response Radiometric response Geology
1 Broad, weakly magnetic areas Low Granodiorite under
sedimentary cover. Cover thickness increase to W.
2 Short strike length, erratic low
magnetic anomalies over moderately magnetic background.
High U Granodiorite
3 Weak shallow magnetic sources
over low-moderate magnetic background.
Low; relatively high Th Granodiorite/tonalite
4 Flat magnetic area Low ?Granitoid under sedimentary
cover
5 Deep magnetic sources with
locally anomalous broad circular features
?Metasedimets and/or granitod
intruded by younger granite plutons.
6 Short, low to moderate
amplitude magnetic sources over moderate background; highest magnetic response is at 6537100S/3439950W
(approximately 250 nT)
Moderate to high Granite, granodiorite and
tonalite.
7 Short, shallow and low
amplitudes superimposed on a very broad feature which may be remanently magnetised.
Low Granodiorite/granite with
increasing sedimentary cover thickness to N. To E and W bounded by major shear zones.
8 Fairly linear, strongly magnetic
anomalies (highest 450 nT)
?Magnetic granitoid or metasediments under sedimentary cover up few 100
m thick.
9 Moderate to strong magnetic
anomalies
Moderate K Granodiorite
10 Fairly long strike length linear
magnetic anomalies marking a prominent discontinuity
High K and Th Shared granodiorite.
Discontinuity is probably major fault.
11 Short strike length, low
amplitude magnetic anomalies over low magnetic background (High magnetic susceptibility values in S of this domain do not coincide with strong magnetic anomalies).
Moderate Granite/granodiorite/tonalite with minor metasediments.
12 Long strike anomalies over
strong magnetic background; anomalies un to 200 nT
Moderate Th Granodiorite, metasediment
and locally high susceptibility gabbro.
13 Long strike anomalies, in places
over strong magnetic background.
High K and Th Granite and metasediments.
14 Long, linear moderate to strong magnetic anomalies.
Moderate U Metasediments.
15 Short strike length anomalies
over moderate background.
High Th Granodiorite or
migmatite/metasediments
16 Short strike length anomalies
over moderate magnetic background. An isolated strong shallow magnetic source (approximately 280 nT) occurs at 6558650S/3462200W.
Low ?Granodiorite/Tonalite
17 Short strike length anomalies on
strong background. Magnetic source deepens to S.
Low; relatively high Th Probably granodiorite;
thickness of sedimentary cover increases to S.
18 Short strike length low
amplitude anomalies over variably magnetic much deeper sources.
Low Sedimentary cover over
metasediments.
19 Short to medium strike length
anomalies over moderate magnetic background
Moderate Th ?Granite.
20 Short, shallow, moderate
intensity sources superimposed on a broad (deep) feature with normal magnetisation.
Low Granite, granodiorite and
tonalite.
21 Long, linear to oval, shallow
(around domain 2) source with low magnetisation or possible reverse magnetisation.
Leucogranitic granite.
22 Shallow magnetic sources and
intensely normal magnetisation.
Low Diorite, tonalite, and minor
gabbro.
23 Long, linear magnetic trend
becoming deeper to N with normal magnetisation.
Low Mylonite within major shear
zone.
24 Long, coherent magnetic
sources with moderate amplitude and with normal magnetisation.
Low ?Migmatite and granite;
mostly under shallow sedimentary cover.
25 Confused shallow magnetic
pattern over low magnetic background.
Low Th over outcrop in N Possibly weakly magnetic thin
sheet of granite over deeper non-magnetic granite or metasediments.
26 Large magnetic flat areas,
frequently elongated, and weak linear magnetic anomalies; magnetic sources generally deep. The aeromagnetic profiles indicate short wavelength, short strike length anomalies with amplitudes of a few nT.
High over outcrop in N ?Granitoid/metasediments
dipping to E; under sedimentary cover. Short wavelength, short strike length anomalies possibly caused by magnetic sources within cover rocks derived from granitoids.
27 Low amplitude magnetic sources on low background separating domains 6 and 7.
Low magnetic granitoid and/or
metasediments under sedimentary cover.
28 Generally low amplitude,
shallow, variably trending magnetic anomalies; strike commonly discordant to regional strike. Some moderate strong, deep sources in central part of domain.
?Granitoid/metasediments dipping to NW. Covered by
sedimentary cover with maximum thickness of 50 m.
29 Broad magnetic sources at
depth under non-magnetic cover; circular trends and circular zone of ?demagnetisation.
Deep magnetic ?Devonian
granite bodies under cover which appears to thicken to E. W boundary of domain appears to be E dipping thrust.
30 Generally erratic weakly
magnetic, fairly shallow sources.
High in NE Granite mostly under
sedimentary cover.
31 Strongly magnetic linear
anomalies; fairly deep with E dip.
?Migmatite, granitoid under
sedimentary cover.
32 Strong, linear magnetic
anomalies.
?Migmatite and granite (as in domain 6) under fairly shallow sedimentary cover.
33 Broad linear, kinked non to
very weakly magnetic features.
Variable Cainozoic and
Carboniferous/Permian sediments in graben structure.
34 Northerly trending, curved to
sinuous, long linear non magnetic features.
Shear zones.
35 NW and minor NE trending,
narrow to moderately wide non magnetic features
Shear zones.
16
BIBLIOGRAPHY
CHAMBERS, P., 1996. Survey details, technical specifications and survey logistics report for
airborne geophysical survey Córdoba, La Rioja, and San Luis. Australian Geophysical
Survey Organisation, Geoscientific Mapping of the Sierras Pampeanas Argentine-Australia
Cooperative Project, Report 14 (Commercial-In-Confidence).
HONE, I. G., 1994. Specification for Airborne Geophysical Survey. Australian Geophysical Survey
Organisation, Geoscientific Mapping of the Sierras Pampeanas Argentine-Australia
Cooperative Project, Report 9 (Commercial-In-Confidence).
HUNGERFORD, N., LYONS, P and STUART-SMITH, P.G., 1996 Magnetic interpretation –
Sierras septentrionales de Córdoba. Australian Geophysical Survey Organisation,
Geoscientific Mapping of the Sierras Pampeanas Argentine-Australia Cooperative Project,
Report 28 (Commercial-In-Confidence).
HUNGERFORD, N., SIMS, J.P. and STUART-SMITH, P.G., 1996 Magnetic interpretation –
Sierras de San Luis y Comechingones. Australian Geophysical Survey Organisation,
Geoscientific Mapping of the Sierras Pampeanas Argentine-Australia Cooperative Project,
Report 30 (Commercial-In-Confidence).
JORDAN, T.E. and ALLMENDINGER, R.W., 1986. The Sierras Pampeanas of Argentina: A
modern analogue of Rocky Mountain foreland deformation. American Journal of Science,
286:737-764.
STUART-SMITH, P.G & LYONS, P., 1995. Reconnaissance field survey – Progress report.
Australian Geophysical Survey Organisation, Geoscientific Mapping of the Sierras
Pampeanas Argentine-Australia Cooperative Project, Report 11
(Commercial-In-Confidence).
STUART-SMITH, P.G., PIETERS, P.E., SKIRROW, R, SIMS, J.P. CAMACHO, A. and LYONS,
P., 1996. Field Program 2 – Progress report. Australian Geophysical Survey Organisation,
Geoscientific Mapping of the Sierras Pampeanas Argentine-Australia Cooperative Project,
Report 19 (Commercial-In-Confidence).
WORLD GEOSCIENCE CORPORATION LTD., 1996. Flight Logs for airborne geophysical
survey Córdoba, La Rioja, San Luis. Australian Geophysical Survey Organisation,
Geoscientific Mapping of the Sierras Pampeanas Argentine-Australia Cooperative Project,
Report 15 (Commercial-In-Confidence).