Estimating Moving Regions out of Point Data – from Excavation Sites in the Amazon region to Areas of Influence of Prehistoric Cultures
5
0
0
Texto completo
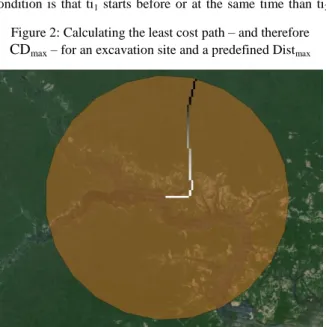
(2) AGILE 2014 – Castellón, June 3-6, 2014. “The ability to establish territorial extents of political, religious or economic zones in a quantitative, formally correct way allows us to transfer hypotheses and knowledge from observations made at single archaeological sites to the landscape surrounding them – effectively moving from point to area-based descriptions.” ([4] p. 245). A “territory” is supposed to be explored by inhabitants of the settlements and its boundaries are defined by “low-cost” factors and by the maximum circumference people are willing to walk in order to get food or other resources [18]. In order describe the political influence (I), [16] presented the so-called Xtent model. It factors in the settlement sizes and distances between them. Two coefficients determine the weight of the parameters and therefor the balance between size and distance. [4] presented an enhanced version of the Xtent model, which allows the integration of topographic features. Both versions are highly dependent on the used coefficients due to the underlying formula invented by [16]. Another approach to model areas of influence is the site catchment analysis. It is based on the supposition that every settlement is surrounded by a catchment area understood as a zone of resources, domestic or wild, inside an easy travelling distance from the settlement. The further the resources from the site the more difficult their exploitation. Therefore the analysis needs specific knowledge about the excavation site and draws conclusions based on the findings. The size of the areas is determined by the sources of the materials (e.g. stones which don’t exist close to the Amazon River) or the maximum traveling distances to procure resources [18].. 3. How to calculate an area of influence. In our approach, a combination of the territory and site catchment analysis is being used to calculate the area of influence. The maximum territory is estimated using a maximum distance a culture is willing to walk. On the basis of this, the site catchment is calculated which factors in the distances to resources needed by the culture (e.g. stones).. 3.1. Database. The core part (orange) holds the information about the excavation sites and their findings. Each excavation site is unique but it can contain several findings, which in turn can be assigned to different cultures and traditions. The thematic part on the lower right in figure 1 (red) stores the cultures and traditions and the relation between them. The part handling the information about the maximum spatial extent (and by that the importance of a certain excavation site for one tradition) and its spatial uncertainty is displayed on the upper right (green). Based on the fundamentals of fuzzy-logic a truth value alpha (α) is used to factor the spatial uncertainty. That means the higher the α-value, the more exact is the maximum distance for that specific excavation site and culture. The fourth part (brown) handles the temporal information and is basically one table which stores the radiocarbon data and its uncertainty interval (e.g. 450±45 BP). The last three tables (blue) are used to store metadata. Besides the already. mentioned data, some meta-information about the archaeologist, the source of the data and the institute, which performed the radiocarbon dating, is being collected (see figure 1 for complete database schema).. 3.2. Creation of Crast. The point data from the excavation sites form the basis for the analysis. Additionally, environmental data about rivers and the location of waterfalls is integrated. The needs and capabilities for each culture depend on environmental, social and economic circumstances. The soil quality or trading relations are only two variables, which may have an influence on the shape of the area. The carrying capacity of an area is understood as the number and density of people that any region can support [5]. The carrying capacity of an area can be altered by people manipulating their land by burning wood or producing fertile soil, planting trees and crops [2]. Therefore, a cost raster (Crast) is calculated, which provides the basis for the site catchment creation. The natural resources in the Amazon (besides water and its related occurrence of food) are quite similar, thus they are considered to be ubiquitous. As input for Crast several information sources may serve, which are relevant for settlement in the Amazon Region. Based on [3] settlements are usually close to rivers due to the need of water. Therefore, an inverse cost distance raster is calculated for the rivers. The blackwater rivers (less nutrients, fish, etc.) gradient increases faster than the nutritious whitewater rivers’s gradient. The flow direction of the Amazon River (not its tributaries) is included. In addition, the distance to the waterfalls is factored in, because this is the nearest location to get stones from.. 3.3. Deriving the area(s) of influence. Crast serves as input for the calculation, which returns the cumulative costs between the input locations (the excavation sites) and every other cell. In the literature the maximum distance a culture can walk to procure resources varies a lot. In the Amazon Region some required goods (e.g. stones) are not available close to the Amazon but at the waterfalls in the inland. This extends the area of influence and it has been hypothesized that up to 25 kilometers are realistic for cultures in the Amazon Region [6, 10]. A maximum distance value (Distmax) – which is provided by the database, and can be extended using a smaller α-value – is used to calculate the maximum cost distance value (CDmax) for each excavation site. That is done by: 1. buffering each excavation site with its maximum distance value Distmax. 2. calculating the least cost path between the excavation site and the outline of the buffer (see figure 2). The resulting accumulated least cost path value equals the value CDmax.
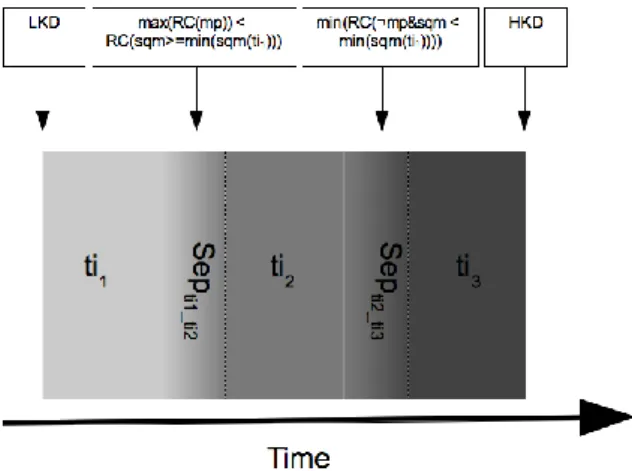
(3) AGILE 2014 – Castellón, June 3-6, 2014. Figure 1: Developed database schema for excavation site handling.. 3.. creating the area(s) of influence on the basis of Crast. Therefore the cumulative cost value CDmax is used as maximum cost value. 4. merging the resulting rasters to represent the connected area(s) of influence for one culture during one time interval (see figure 4). Based on the given data, a separation in three time intervals for each culture is being made (see above) which are defined as follows: • ti1: mp (multiphased) • ti2: sqm>=min(sqm(ti1)) • ti3: ¬mp&sqm<min(sqm(ti1)) with ti1 indicating the beginning of the settlement, ti2 representing the interval with the widest spread (which also means a spatial overlap between ti1 and ti2) and ti3 showing the time of shrinking. With regard to Allen’s temporal relations [1], the time intervals defined above are not necessarily in a ti-1 “meets” ti+2 relation. The only mandatory condition is that ti1 starts before or at the same time than ti2. and that it ends before or at the same time than ti 2 (the same conditions are valid for the relation between ti2 and ti3). Besides “meets” also “equals”, “starts”, “finished-by” and “overlap” are possible relations. The chronological order of the time intervals is known, whereas the point of transition between the different time intervals is not known. The transition period (Septix_tix+1) between the time intervals can formally be described using radiocarbon data (see figure 3 with RC = radiocarbon, mp = multi phased, sp = single phased, LKD and HKD = least/highest known date, and sqm = squaremeter). To factor spatial uncertainty a range of Distmax values is defined. This is handled by the database in which predefined α-values and associated extended Distmax values are stored. The extended Distmax values can be set independently for each finding, which allows individual treatment of each finding and therefore a higher accuracy for the findings which are well known. This is similar to the fuzzy spatiotemporal information system for handling excavation data introduced by [19].. Figure 2: Calculating the least cost path – and therefore. CDmax – for an excavation site and a predefined Distmax. 4. Case Study. The case study focuses on a culture named Guarita which is classified as “Polychrome Painting” tradition and is known to have settled in the Amazon Region approximately between 600 AD and 1300 AD [8]. The necessary data (excavation site size, coordinates, and number of traditions) are available for almost all excavation sites in our database, which makes them most suitable. Unfortunately, only very little radiocarbon data exists, therefore no temporal progress can be calculated. The area(s) of influence were calculated using three different α-values – 1, 0.8 and 0.5 – for each excavation site. The results can be seen in figure 4..
(4) AGILE 2014 – Castellón, June 3-6, 2014. Figure 3: Time line which shows the chronological order and formal description of the settlements.. The culture is located in the confluence area between the Rio Negro, Rio Solimões, the Rio Madeira and the Amazon River, the distribution pattern of the pioneer settlements of the Guarita Culture show four separated clusters. The main habitation sites are located on top of the bluff zones of the “terra firme”, close to the fertile alluvial plains (várzea) and in contact with both river types. The second stage shows an almost explosive increase of new habitation sites, away from the primary areas and following up the Rio Negro (north west), as well as the Madeira River (south east). Although the first is a blackwater river and the second a whitewater river, there is apparently no variation in the strategy of occupation of these ecologically different regions. The third time interval is characterized by abandonment and retreat. All archaeological sites along the Madeira River were uninhabited, just like those located on the Lago Silves. Many sites at the mouth of the Rio Negro were abandoned as well.. 5. Conclusion. The goal of this research is to determine the changes or movement of influence areas of precolonial cultures in the Amazon region using archaeological excavation data and assumption on the environmental conditions. One big problem. to cope with when estimating an area of influence for precolonial cultures is the lack of data. There are only very few (excavation) points and it can be assumed that the used set of points is incomplete. The shown approach creates estimated area(s) of influence derived from point data. Due to the inherently vague spatial and temporal data, the areas are derived on a basis of maximum costs a culture is willing to overcome for procuring resources. The results seem to confirm the assumptions that after a period of expansion there is a shrinking process and a retreat to the backlands. The database schema as well as the area of influence calculation is not necessarily connected to the data of the Amazon Region but can also be applied to other archaeological datasets. Spatial vagueness is factored in using different α-values, which have an influence on the selected buffer sizes for each excavation site. The temporal information is derived using specific properties of the sites. The results vary due to the chosen α-values: the higher the value, the more unsteady (but wider) are the calculated areas. By assigning the values for each excavation site the uncertainty can be reduced, because only the areas of the less known places extend. In the current stage of research, radiocarbon data is included for defining the separation interval between two time intervals. This is based on the problem that very few radiocarbon data is available for the examined cultures. Even though radiocarbon data is not exact (e.g. bias due to volcanic activity) it helps to specify the time and duration of the settlements. The database is in the process of being completed with (analog) data published in archaeological and ethnological research papers. This collection process will also increase the amount of available radiocarbon data, allowing for an analysis of temporal occurrences. Fuzzy zones of change can be derived, where the phase changes between two time intervals. Thus, a better knowledge about the chronological sequence and settlement behavior can be achieved. It must be assumed that the results will be distorted due to missing excavation sites. Some excavation sites with Konduri findings are not yet in the database due to missing additional information. They are located downstream of the Amazon River and were documented by Nimuendajú in 1937 [14]. The quality of the resulting areas is highly dependent on the used cost surface. As [9] claimed, the data must be collected carefully to assure a more realistic model of the factors, which determine the area. That means, the final output is only as. Figure 4: Results for the Guarita culture. Time intervals 1, 2 and 3 (from left to right). The red and blue colors are indicating the extended areas of influence due to different Distmax values..
(5) AGILE 2014 – Castellón, June 3-6, 2014. good as the cost raster, which is also a matter of resolution. In addition, if some important resource or other input factor is unconsidered, the calculated area might not be convincing. The migration behavior of pre-colonial cultures in the Amazon Region is widely debated. The main question is if the Amazon Region is an environment of abundance and therefore appropriate for permanent settlement (model of abundance [7, 12, 17] or an environment of limited resources [13] Our current approach is based on the ‘model of abundance’ theory, while being aware of the fact that other movement behaviors might have been predominant. In the future, the method will be refined to cope with missing values and to derive more information about the connectivity between the settlements of one culture. One step leads to hypothesizing further (as yet unexcavated) sites by determining their suitability and assuming a settlement at the most suitable places. Another step is to use the calculated area of influence itself as a cost raster to calculate the least cost paths between the settlements to derive at a settlement network. This in turn could lead to a better estimation of costs because a directed graph can be used (faster movement on rivers but dependent on the flow direction etc.). Such a model can be extended to include other cultures, which existed at the same time interval, in order to analyze trading relations.. References [1] J. F. Allen. (1983) Maintaining Knowledge About Temporal Intervals. Communications of the ACM 26(11): 832-843, 1983. [2] W. Balée. Cultural Forests of the Amazon. A Historical Ecology of People and their Landscapes. University of Alabama Press, 2013. [3] W. M. Denevan A Bluff Model of Riverine Settlement in Prehistoric Amazonia. Annals of the Association of American Geographers 86:654-681, 1996. [4] B. Ducke B and P. C. Kroefges. From Points to Areas: Constructing Territories from Archaeological Site Patterns Using an Enhancend Xtent Model. In: Layers of Perception. Proceedings of the 35th International Conference on Computer Applications and Quantitative Methods in Archaeology (CAA). Berlin, Germany, April 2–6, Berlin, 2007. [5] B. Fagan. In the Beginning. An Introduction to archaeology. Scott, Foresman and Company, Glenview, 1988. [6] M. Heckenberger. The Ecology of Power. Culture, Place, and Personhood in the Southern Amazon, A.D. 10002000. Routledge, London, 2005.. [7] M. Heckenberger and G. E. Neves. Amazonian Archaeology. Annual Review of Anthropology 38:251266, 2009. [8] P. P. Hilbert. Archäologische Untersuchungen am mittleren Amazonas: Beiträge zur Vorgeschichte des südamerikanischen Tieflandes. (Marburger Studien zur Völkerkunde). Reimer Verlag, Berlin, 1968. [9] I. Hodder I and C. Orton. Spatial Analysis in Archaeology. Cambridge: Cambridge University Press, Cambridge, 1976. [10] T. Koch-Grünberg. Zwei Jahre bei den Indianern Nordwest-Brasiliens. Strecker und Schröder, Stuttgart, 1921. [11] P. Laube. Progress in Movement Pattern Analysis. In: Behaviour Monitoring and Interpretation – BMI – Smart Environments. CRC Press, London, p 368, 2009. [12] D. Lathrap The Upper Amazon. Ancient peoples and places. Thames & Hudson Ltd, London, p 256, 1970. [13] B. J. Meggers. Amazonia. Man and Culture in a Counterfeit Paradise. Smithsonian Institution Press, Washington, 1996. [14] H. C. Palmatary. The archaeology of the lower Tapajós Valley, Brazil. American Philosophical Society, Philadelphia, 1960. [15] Programa Nacional De Presquisas Arqueológicas (PRONAPA). Terminologia arqueológica brasileira para a cerâmica. Manual de Arqueologia No. 1. Curitiba, 1966. [16] C. Renfrew and E. Level. Exploring Dominance: Predicting Polities from Centers. In: Transformations: Mathematical Approaches to Culture Change, Academic Press, New York, p 515, 1979. [17] A. C. Roosevelt. Moundbuilders of the Amazon. Geophysical Archaeology on Marajo Island, Brazil. Academic Press, New York, p 480, 1991 [18] D. Roper. The Method and Theory of Site Catchment Analysis: A Review. In: Advances in Archaeological Method and Theory, Vol. 2 (1979), p 119-140, 1979 [19] A. Zoghlami. Through a Fuzzy Spatiotemporal Information System for Handling Excavation Data. In: Bridging the Geographic Information Sciences. International AGILE'2012 Conference, Avignon (France), April, 24-27, 2012. Lecture Notes in Geoinformation and Cartography, Springer, Heidelberg, p 450, 2012.
(6)
Figure
Documento similar