Digital agenda and cohesion policy Volume I: research for REGI Committee
141
0
0
Texto completo
(2)
(3) Research for REGI Committee - Digital Agenda and Cohesion Policy Volume I. Abstract. This study provides a critical analysis of the contribution of Cohesion Policy and the European Structural Investment Funds to the Digital Agenda for Europe and the Digital Single Market. Based on the analysis of past and current patterns of ESIF digital investments and selected case studies, this study shows that Cohesion Policy should concentrate where its added value is highest, i.e., on support to the formulation of effective regional digital strategies and on the promotion of partnerships between relevant stakeholders, at regional level and beyond.. `.
(4) This document was requested by the European Parliament's Committee on REGI. AUTHORS CSIL Centre for Industrial Studies (Italy): Julie PELLEGRIN, Louis COLNOT supported by (case studies): Łukasz ARENDT (IPISS), Luca BISASCHI and Gelsomina CATALANO (CSIL), Žilvinas MARTINAITIS (Visionary), and Giorgio MICHELETTI (IDC) for additional input on digitalisation trends. Research manager: Diána HAASE Project and publication assistance: Jeanette BELL Policy Department for Structural and Cohesion Policies, European Parliament. LINGUISTIC VERSIONS Original: EN ABOUT THE PUBLISHER To contact the Policy Department or to subscribe to updates on our work for the REGI Committee please write to: [email protected] Manuscript completed in June 2018 © European Union, 2018 This document is available on the internet in summary with option to download the full text at: http://bit.ly/2MMfPHf This document is available on the internet at: http://www.europarl.europa.eu/thinktank/en/document.html?reference=IPOL_STU(2018)617485 Further information on research for REGI by the Policy Department is available at: https://research4committees.blog/REGI/ Follow us on Twitter: @PolicyREGI Please use the following reference to cite this study: Pellegrin, J, and Colnot, L (CSIL), supported by (case studies) Arendt, Ł (IPISS) Bisaschi, L and Catalano, G (CSIL), Martinaitis, Z (Visionary), Micheletti G (IDC) 2018, Research for REGI Committee – Digital Agenda and Cohesion Policy, European Parliament, Policy Department for Structural and Cohesion Policies, Brussels Please use the following reference for in-text citations: Pellegrin, Colnot, Arendt, Bisaschi, Catalano, Martinaitis & Micheletti (2018) DISCLAIMER The opinions expressed in this document are the sole responsibility of the author and do not necessarily represent the official position of the European Parliament. Reproduction and translation for non-commercial purposes are authorized, provided the source is acknowledged and the publisher is given prior notice and sent a copy. This document was requested by the European Parliament's Committee on Regional Development (REGI).
(5) Digital Agenda and Cohesion Policy _____________________________________________________________________. CONTENT LIST OF ABBREVIATIONS. 5. LIST OF BOXES. 8. LIST OF FIGURES. 9. LIST OF MAPS. 11. LIST OF TABLES. 12. EXECUTIVE SUMMARY. 13. 1. Introduction. 17. 1.1. Study background. 17. 1.2. Objectives and research questions. 17. 1.3. Research design and methodology. 18. 2. The Digital Agenda for Europe and the EU economy – issues at stake. 19. 2.1. The pervasive role of digital technologies and the ‘digital transformation’: expectations and conditions. 19. 2.2. Digital performance in Europe: state of play. 23. 2.3. EU Policy response: conceptual framework and underlying logics of intervention. 35. 3. Early ESIF support for ICT and the Information Society: first developments and achievements. 45. 3.1. First Cohesion Policy support for ICT (1980s – early 1990s). 46. 3.2. Emergence and consolidation of ICT and the Information Society as a priority of Cohesion Policy (1990s). 47. 3.3. Cohesion Policy’s first substantial efforts in favour of the Information Society (2000-2006). 49. 3.4. Cohesion Policy as a main instrument to achieve the Digital Agenda (2007 - 2013). 54. 3.5. Evidence of achievements and lessons learnt up to 2014. 60. 4. ESIF support to the Digital Agenda in 2014-2020: patterns of expenditure and trends. 69. 4.1. Evolution of the prioritisation of Cohesion Policy in the area of digital investments: a snapshot. 69. 4.2. Sectoral patterns. 72. 4.3. Geographical patterns. 79. 4.4. Additional sources of EU funding for ICT and the digital economy. 84. 5. ESIF support to the Digital Agenda in 2014-2020: territorial needs and policy responses. 87. 3.
(6) IPOL | Policy Department for Structural and Cohesion Policies _____________________________________________________________________ 5.1. ESIF funding in the digital economy during the 2014-2020 programming period: a new policy framework. 87. 5.2. Evidence from case studies. 89. 5.3. Issues at stake. 96. 6. Conclusions and prospects. 104. 6.1. Main findings and conclusions. 104. 6.2. Prospects and recommendations. 106. ANNEX I.. Three emerging technologies in a nutshell. 111. A I.1. Artificial Intelligence/ Cognitive Computing. 111. A I.2. Cloud Computing. 112. A I.3. Big Data and Analytics. 112. ANNEX II. Methodological Annex. 115. A II.1. Overview of the methodology. 115. A II.2. Specific issues related to statistical data. 115. A II.3. Approach to data analysis. 124. ANNEX III. List of interviews. 129. REFERENCES. 130. 4.
(7) Digital Agenda and Cohesion Policy _____________________________________________________________________. LIST OF ABBREVIATIONS CEF Connecting Europe Facility CF Cohesion Fund CIP Competitiveness and Innovation Framework Programme CP Cohesion Policy COSME EU programme for the Competitiveness of Enterprises and Small and Medium-sized Enterprises ICT Information and communication technology DAE Digital Agenda for Europe DEI Digitising European Industry DESI Digital Economy and Society Index DG Directorate-General of the European Commission DG CLIMA Directorate-General for Climate Action DG CNECT / Directorate-General for DG CONNECT Content and Technology. Communications. Networks,. DG DEVCO Directorate-General for International Cooperation and Development DG EMPL Directorate-General for Employment, Social Affairs and Inclusion DG ENER Directorate-General for Energy DG MARE Directorate-General for Maritime Affairs and Fisheries DG MOVE Directorate-General for Mobility and Transport DG REGIO European Commission’s Directorate-General for Regional and Urban Policy DG RTD Directorate-General for (European Commission). Research. and. Innovation. DIH Digital Innovation Hubs DSM Digital Single Market EAFRD European Agricultural Fund for Rural Development EASME Executive Agency Enterprises. for. Small. and. EC European Commission ECA European Court of Auditors EMFF European Maritime and Fisheries Fund 5. Medium-sized.
(8) IPOL | Policy Department for Structural and Cohesion Policies _____________________________________________________________________. ERDF European Regional Development Fund EFSI European Fund for Strategic Investments EIB European Investment Bank EIF European Investment Fund ESIF European Structural and Investment Funds ESF European Social Fund eTEN Programme that supported the deployment of transEuropean e-services in the public interest. EU European Union EUR Euro EXAC Ex Ante Conditionality FP(X) Xth Framework Program for Research GPT General Purpose Technology H2020 Horizon 2020 IRISI Inter Regional Information Society Initiative IS Information Society ISPA Instrument for Structural Policies for Pre-Accession JRC Joint Research Centre KBE Knowledge-Based Economy LSE London School of Economics Mbps Mega Bytes per second MGI McKinsey Global Institute MS Member State NACE Nomenclature Statistique des Activités dans la Communauté Européenne. Economiques. NGA Next Generation Access NGO Non-Governmental Organisation NUTS (1-2-3) Nomenclature of Territorial Units for Statistics (level 1-23) OECD Organisation Development. for. Economic. PPP Purchasing Power Parity R&D Research and Development. 6. Co-operation. and.
(9) Digital Agenda and Cohesion Policy _____________________________________________________________________. RISI Regional Information Society Initiative S3 Smart Specialisation Strategy SESAR Single Eu²ropean Sky ATM Research SME Small and Medium-sized Enterprise SPD Single Programme Document SSL Solid State Lighting STAR Special Telecommunicaion Development. Action. for. Regional. TELEMATIQUE Community initiative for regional development concerning services and networks related to data communication, 1991-1993 TEN-ICT Trans-European Network – ICT TO Thematic Objective US United States USD US Dollar YEI Youth Employment Initiative. 7.
(10) IPOL | Policy Department for Structural and Cohesion Policies _____________________________________________________________________. LIST OF BOXES BOX 1: STAR and TELEMATIQUE. 46. BOX 2: IRISI and RISI. 48. BOX 3: The contribution of the ESF to the Information Society (2000-2006).. 51. BOX 4: E-commerce and Cohesion Policy 2007-2013. 64. BOX 5: Smart specialisation strategy of Slovenia. 97. BOX 6: Coordination between ERDF and ESF at project level: an example. 98. BOX 7: Broadband Competence Offices. 98. BOX 8: Digitising European Industry Initiative. 99. BOX 9: Digital Innovation Hubs. 100. BOX 10: Smart cities and smart villages. 101. BOX 11: The Smart Specialisation Platform. 103. BOX 12: Other examples of EU-level platforms of exchange dealing with digitalisation. 8. 103.
(11) Digital Agenda and Cohesion Policy _____________________________________________________________________. LIST OF FIGURES FIGURE 1. Evolution of notions pertaining to digital technologies and their focus. 22. FIGURE 2. Digital Economy and Society Index in 2017 by Member State.. 25. FIGURE 3. Total DESI score in 2014 and improvement between 2014 and 2017.. 26. FIGURE 4. Fast broadband (at least 30 Mbps) household penetration rate in 2016.. 27. FIGURE 5. Ultrafast broadband (at least 1000Mbps) household penetration rate in 2016.. 27. FIGURE 6. Share of households actually accessing the internet in 2017.. 28. FIGURE 7. Distribution of digital skills among individuals in Member States in 2017.. 29. FIGURE 8. Digital Intensity Index (share of enterprises by level) in 2016.. 30. FIGURE 9. Intervention logic of the Digital Agenda for Europe.. 38. FIGURE 10. Seven pillars, main areas of intervention and measurable targets of the EU Digital Agenda.. 39. FIGURE 11. Three pillars of the Digital Single Market, with core topics and related policy initiatives.. 41. FIGURE 12. Share of Structural Funds dedicated to the Information Society in Objective 1 and 2 regions by e-Europe priority for the 2000-2006 period. 50. FIGURE 13. Consolidated areas of intervention related to the Information Society/Digital Agenda funded by Cohesion Policy in 2007-2013.. 55. FIGURE 14. Correlation between Cohesion Policy funding per capita for ICT infrastructures (2007-2013) and average yearly growth in household broadband access (2008-2014).. 9. 62.
(12) IPOL | Policy Department for Structural and Cohesion Policies _____________________________________________________________________. FIGURE 15. Evolution of the contribution of Cohesion Policy to EU digital objectives by programming period.. 71. FIGURE 16. Breakdown of planned ESIF expenditure for digital investments during the 2014-2020 programming period, by fund.. 72. FIGURE 17. Areas of intervention related to the Digital Agenda/the Digital Single Market funded by Cohesion Policy in 2014-2020 (ERDF, CF, ESF, EAFRD and YEI).. 73. FIGURE 18. Evolution of Cohesion Policy funding dedicated to ICT infrastructures, by programming period.. 75. FIGURE 19. Evolution of Cohesion Policy funding dedicated to ICT – other forms of support, by programming period.. 76. FIGURE 20. Evolution of Cohesion Policy funding dedicated to e-services and applications for citizens, by programming period.. 77. FIGURE 21. Evolution of Cohesion Policy funding dedicated to ICT support for SMEs, by programming period.. 78. 10.
(13) Digital Agenda and Cohesion Policy _____________________________________________________________________. LIST OF MAPS MAP 1: Overall e-government performance in 2016.. 300. MAP 2: Overview of regional digital performance indicators.. 32. MAP 3: Regional clusters of digital performance in 2017.. 33. MAP 4: Allocated amounts of ERDF/CF dedicated to ICT/the Information Society during the 2000-2006 programming period. MAP 5: Allocated amounts of the ERDF and CF dedicated to the Information Society in consolidated areas of intervention during the 2007-2013 period.. 520. 58. MAP 6: Concentration of ERDF and CF dedicated to the Information Society in consolidated areas of intervention during the 2007-2013 period.. 588. MAP 7: Allocated amounts of ERDF and CF dedicated to the different consolidated areas of intervention during the 2007-2013 period.. 589. MAP 8: Correlation between Cohesion Policy funding per capita for ICT infrastructures during the 2007-2013 period and improvement in household broadband access between 2008 and 2014.. 61. MAP 9: Planned allocated amounts of ESIF dedicated to digital investments during the 2014-2020 programming period.. 77. MAP 10: Concentration of ESIF dedicated to digital investments by consolidated areas of intervention during the 2014-2020 period.. 79. MAP 11: Planned amounts of ESIF dedicated to consolidated areas of intervention during the 2014-2020 period.. 831. MAP 12: Regional evolution of planned amounts of ESIF dedicated to ICT/the digital economy between 2007-2013 and 2014-2020.. 842. MAP 13: Overview of the selected case studies.. 11. 91.
(14) IPOL | Policy Department for Structural and Cohesion Policies _____________________________________________________________________. LIST OF TABLES TABLE 1. Characteristics of regional digital performance clusters.. 34. TABLE 2. Absorption rates of ICT-related consolidated areas of intervention for the 2007-2013 programming period.. 61. TABLE 3. Consolidated areas of intervention. 74. TABLE 4. Evolution of the priorities in terms of consolidated areas of intervention for digital investments under Cohesion Policy.. 78. TABLE 5. Allocations of planned ESIF at regional level during the 2014-2020 period.. 80. TABLE 6. Regional patterns of allocations of planned ESIF by consolidated areas of intervention during the 2014-2020 period.. 82. TABLE 7. Summary of available data sources for Cohesion Policy’s support to digital investments, by programming period and by fund.. 117. TABLE 8. Summary of the available data related to digital investments for the ERDF/CF by programming period.. 119. TABLE 9. Summary of the available data related to digital investments for the ESF/YEI by programming period. 119. TABLE 10. Summary of the available data related to digital investments for the EAFRD by programming period. 119. TABLE 11. Summary of the available data related to digital investments for the EMFF by programming period. 119. TABLE 12. Summary of data sources for digital performance. 120. TABLE 13. Cohesion Policy nomenclatures and links with digital investments. 122. TABLE 14. Sources and computation methods for the different estimates of Cohesion Policy amounts planned for digital investments (1980s2010s).. 125. TABLE 15. Consolidated areas of intervention and correspondence with existing Cohesion Policy nomenclatures. 126. 12.
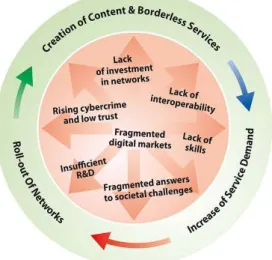
(15) Digital Agenda and Cohesion Policy ___________________________________________________________________________. EXECUTIVE SUMMARY Objectives and background The objective of this study is to provide the European Parliament with a critical analysis of the contribution of the European Structural and Investment Funds (ESIF) to the Digital Agenda for Europe and the Digital Single Market (DAE/DSM). This study identifies and assesses specific challenges encountered/lessons learned during policy implementation, and addresses potential policy evolution post 2020. It is based on an analysis of past and current patterns of ESIF digital investments, complemented by six case studies of digital projects funded by ESIF in 2014-2020.. Main findings This study shows that, at the root of the EU ICT policy, are weaknesses in EU digital performance despite some assets. While it boasts a strong research basis and a rather dynamic start-up ecosystem, the continent as a whole tends to underperform, compared to competitors such as the USA, Japan and South Korea, in terms of advanced ICT infrastructures and uptake of ICT products and services by citizens and enterprises (in particular SMEs). Moreover, there are different ‘digital divides’ at play between and within Member States that yield a fragmented European digital market. The EC adopted early measures to deal with this situation and developed a conceptual framework that remained stable across programming periods despite the fast pace of technological advance. It culminated in the adoption of the DAE and the DSM in 2010 and 2015, respectively. This policy paradigm relies on a virtuous circle of investments in and usage of digital technologies, involving stakeholders on both the supply (e.g. ICT infrastructure) and demand sides (e.g. ICT uptake and digital skills), and combining concerns for efficiency and inclusion. Since the very beginning, Cohesion Policy has been expected to make a substantial contribution to EU digital policy, because of both its important budgetary envelope and adequate territorial approach to address issues such as the digital divide(s). In aggregate terms, patterns of ESIF digital investments reflect the holistic approach adopted by the European Commission (EC), i.e. they are diversified across a large range of areas. Overall, ESIF digital investments in 2014-2020 represent around EUR 21.4 billion. ESIF investments in ICT infrastructures are one of the leading areas of intervention with EUR 6 billion, followed by digital investments in a number of areas targeting people, such as egovernment, digital skills or e-inclusion (around 40% of ESIF investments in the digital economy). Other forms of ICT support such as Smart Cities and Smart Grids have acquired greater importance since the 2007-2013 programming period and represent around 20% of total planned ESIF digital investments in 2014-2020. The share of ESIF addressed to SMEs is relatively low (EUR 2 billion, less than 10%), a feature that may be explained by the existence of alternative sources of funding. In geographical terms, regions in Southern and Eastern Europe allocated the most to digital investments, in line with the overall ESIF distribution. A complex governance arrangement underlies the contribution of ESIF to the DAE/DSM’s objectives. Issues in the governance and delivery system account for possible missed opportunities hindering ESIF support for the diffusion of digital technologies in some sectors. For example, the level of priority for ICT infrastructures raises some controversy and the demarcation between ERDF and EAFRD is unclear in this area. There is some uncertainty about who has responsibility for digital skills, and insufficient coordination regarding the use of 13.
(16) IPOL | Policy Department for Structural and Cohesion Policies _______________________________________________________________________________ ICT to address climate change. Reaping the benefits of synergies with other EU funding instruments, in particular H2020, also remains a challenge. At local levels, regional authorities often prefer to concentrate ESIF resources for digital investments on a few priorities rather than spreading interventions thin. Field research shows that the quality of strategic planning is a decisive success factor for regional digital strategies. The existence and quality of regional and local partnerships is another critical factor, which can help deal with the possible shortage of administrative capacity at regional level, among other things. For these reasons, Smart Specialisation Strategies appear to be a privileged locus where successful digital strategies can be implemented as they extend the regional and local partnerships and allow for a better alignment of digital priorities with overall regional ones. They are also a way of promoting synergies with H2020 and of engaging SMEs. Overall, ESIF have specific value added in stimulating partnerships and helping regions to devise good quality strategies. The role of the EC is central in this respect. In particular, the strength of the contribution of the EC resides in its interactions with regional authorities. The EC also acts as a ‘knowledge broker’, establishing exchange platforms with possible partners in other Member States and diffusing information on good practices. The establishment of Digital Innovation Hubs is a promising development in this respect, but some other comparable initiatives sometimes lack visibility and critical mass. As a final remark, it should be noted that the above findings are based on a specific combination of desk and field research, but that there is no comprehensive evaluation of the contribution of ESIF digital investments to the DAE/DSM’s objectives. There are a few sectoral analyses highlighting mixed performances of ICT infrastructures, for example, or the difficulty in reaching SMEs. In general, this study shows how difficult it is to gather comprehensive updated and reliable evidence on EU interventions in the digital economy and ICT.. Recommendations The findings of the study offer a clear endorsement of the system of shared management and of the territorial approach it enables. In the context of the high priority placed on digitalisation planned in the next Multi Annual Financial Framework, and considering the probable decrease in ESIF budget following Brexit, it is crucial that Cohesion Policy concentrates its support where it is most effective i.e. in encouraging the adoption of regional digital strategies and steering effective partnerships at regional level – and beyond. In this respect, relevant regulations should ensure that a large proportion of funding be allocated to digital projects while funding supporting administrative capacity or exchange platforms remains complementary. The European Parliament should ensure this principle is applied. Smart Specialisation Strategies should become the main reference for regional authorities willing to engage in sound digital strategies. For this, the system of Ex Ante Conditionalities connected to digital investments could be streamlined. The current EXAC dealing specifically with digital growth strategies could be replaced by the existing EXAC dealing with the adoption of Smart Specialisation Strategies, on condition that the latter integrate digital priorities. The EXAC dealing with the deployment of broadband would be maintained but it should refer and be strongly linked to the EXAC dealing with Smart Specialisation Strategies. Smart Specialisation Strategies are also potentially effective in fostering synergies with other EU funding instruments and H2020 in particular. Digital Innovation Hubs are useful instruments in this respect and they could be consolidated or extended, following their assessment.. 14.
(17) Digital Agenda and Cohesion Policy ___________________________________________________________________________ ESIF should be mobilised to promote digital strategies in areas where the full potential of ESIF contribution has yet to be tapped, e.g., in the area of climate change, rural economy and in sectors covered by the EMFF. For this reason, the structure of Thematic Objectives could be reviewed to account for the horizontal specificity of digital investments. TO2 could cover only broadband investments, while ‘digitalisation’ could become a horizontal priority valid across Thematic Objectives. A system of earmarking could ensure that a minimum proportion of each ESIF takes digitisation objectives into account. A sound knowledge basis should underlie policy development in support of digital investments. Monitoring systems could be improved by including more (specific and core) indicators dedicated to digital performance (e.g. digital skills). Also, expenditures that fall under other categories of expenditure, but which have a digital component, should be ‘tagged’ correspondingly (on the model of the ‘secondary theme’ currently used by the ESF). Finally, there is room to improve the governance and delivery of ESIF dedicated to the DAE/DSM. The division of responsibility between DGs and the overall coordination under the supervision of the Vice President in charge of the DSM in the European Commission should be made clearer. A specific demarcation of the competences of ERDF and EAFRD is also necessary with regard to digital infrastructures.. 15.
(18) IPOL | Policy Department for Structural and Cohesion Policies _______________________________________________________________________________. 16.
(19) Digital Agenda and Cohesion Policy ___________________________________________________________________________. 1. INTRODUCTION 1.1. Study background. The development of digital technologies and of the data economy is seen as a major driver of innovation and growth, capable of triggering radical and deep transformations in both business models and people’s lives. It is increasingly considered that such developments have the potential to disrupt current growth trajectories and welfare patterns. There is wide consensus to underline the fact that despite undeniable strengths in terms of research and manufacturing bases, as well as a skilled workforce, the levels of digitalisation in Europe are well below their potential. What is more, ICT-related growth and its potential seem to be unequally distributed throughout the EU, with some countries and regions being particularly efficient at collecting the economic benefits of the digital transformation, while others are having more difficulties. In other words, the EU is characterized by different digital divides within and between Member States yielding a fragmented digital market. This, together with other inherent structural factors, prevents EU Member States from reaping the full potential of the ongoing digital developments. The EU is a precursor in fostering a fully-fledged digital strategy aimed at helping European countries and regions to catch up with trends in digital technologies. Indeed, the first initiatives in this direction date back to the 1980s and were progressively scaled up to culminate with the adoption of the Digital Agenda for Europe (DEA) in 2010 and the Digital Single Market (DSM) as of May 2015. Their aim was to deliver sustainable economic and social benefits stemming from the digital economy. Since the beginning of the development of an EU digital policy, the expectations placed on the contribution of Cohesion Policy are high. Of course, this is because European Structural and Investment Funds (ESIF) that co-finance Cohesion Policy are a primary funding mechanism in many regions and can reach remote regions or regions particularly at risk of digital exclusion. Also of fundamental importance is the territorial approach underlying ESIF developments, which appears to be specifically pertinent in tackling digital evolution. As a matter of fact, the EU approach to digital policy has always emphasised the holistic dimension of digital development. This is encapsulated in the expressions ‘Information Society’ and the more recent ‘digital transformation’: they testify to the intention to go beyond a mere techno-centred approach and address all the different aspects of the ‘digitalisation’ of the economy and of society. This requires treating the supply and the demand sides (e.g. digital skills) on a par, without neglecting social, cultural and other effects – and overall to foster a virtuous circle in which social demand for new technologies stimulates supply and vice versa, in a dynamic of growth. In this context, Cohesion Policy – and ESIF more generally - are natural candidates to push forward the Digital Agenda, and its corollary the Digital Single Market. Their place-based approach makes it possible to tailor strategies to territorial specificities and needs, which represents a clear added value capable of tackling the different dimensions of the digital transformation while fostering commitment to digital development. At the same time, there are specific challenges in terms of local administrative capacity, coordination of regional strategies and knowledge base – and specific issues, such as the question as to whether some investment areas should be prioritised and if yes, on what grounds, where and under what conditions.. 1.2. Objectives and research questions. In this context, the objective of the present study is to provide the European Parliament with a study offering a critical analysis of the contribution of the ESIF to the DAE/DSM during the 17.
(20) IPOL | Policy Department for Structural and Cohesion Policies _______________________________________________________________________________ current programming period. This is to follow from a synthetic overview of past interventions of Cohesion Policy in favour of innovation and the Information Society and to pave the way for a critical assessment of the prospects and options for the next programming period post-2020. To achieve this triple objective, the study addresses a number of research questions, as follows. • Overview of Cohesion Policy’s past role and achievements What contribution have the early schemes in support of the Information Society/ICT made? What were the patterns and the evolution of ESIF investments in the Information Society/ICT? What regions and types of investment were involved? What are the main achievements and lessons learnt from past programming periods? • Critical analysis of state of play 2014-2020 What are the patterns of ESIF investments – how have they evolved and how do they relate to levels and disparity in digital performances across regions and countries? What are the implications and impact of the new regulatory arrangements adopted in the current strategic framework (i.e., thematic concentration, ex ante conditionalities, communityled local development, integrated territorial initiatives, sustainable urban development and coordination between ESIF and synergies with other EU instruments)? Can different types of digitalisation strategies be detected? Are there mechanisms or factors that account for the success or failure of specific types of intervention? Is there synergy between ESIF and other policies/funding? • Critical assessment of possible prospects What are the prospects related to challenges inherent to the past and current programming periods? And related to contextual opportunities/challenges (e.g. new technological developments, Brexit, new environmental constraints and opportunities related to climate change)? Finally, specific horizontal issues are addressed such as territorial needs, the role of local and regional authorities, an urban-rural linkages.. 1.3. Research design and methodology. The topic under investigation poses a number of specific methodological challenges. In particular, the pervasive nature and ubiquity of digital technologies makes it difficult to comprehensively track the many different areas potentially affected by the DAE/DSM and to provide an overall unified (although not uniform) assessment of the specific contribution of ESIF. Other methodological challenges – more traditional in the context of the analysis of Cohesion Policy – stem from the variety of socio-economic and policy contexts throughout Member States and regions making it difficult to generalise the findings, and the imperfect availability of data at regional level. A mix of methodological approaches and tools were combined to deal with these methodological challenges: mobilising documentary review, interviews with selected stakeholders, data analysis and case studies (see methodological Annex for more details). The report is structured as follows. In this Volume (Volume 1), Chapter 2 lays out the conceptual and strategic framework of the study: it clarifies notions, analyses gaps in ICT performance in the EU, and the intended policy response. Chapter 3 describes first measures and the contribution of ESIF to the DEA / DSM in the past programming periods; it identifies the policy lessons that were inferred from this experience. Chapter 4 accounts for current patterns of ESIF digital investments, while Chapter 5 provides a more qualitative assessment based on case studies and interviews with stakeholders. Chapter 6 concludes and explore prospects in the post-2020 era. Volume 2 presents the six case studies reports.. 18.
(21) Digital Agenda and Cohesion Policy ___________________________________________________________________________. 2. THE DIGITAL AGENDA FOR EUROPE AND THE EU ECONOMY – ISSUES AT STAKE KEY FINDINGS •. There are considerable expectations placed on digital technologies, but also considerable risks. Their rapid development makes it difficult to refer to a clear analytical framework identifying their net effects on employment, and beyond, or their wider impact on the economy and society. This is reflected in a series of terms that tend to be used interchangeably (e.g. ICT, digitalisation/digitisation, data economy, etc.).. •. The EU has many assets in order to harness the potential of digital technologies in terms of research basis, but also to identify weaknesses generally related to the uptake of digital technologies. Overall, there is a persistent gap with the USA, and the EU economy as a whole is characterised by irregular digital performances – or digital divides – between and within Member States.. •. The EU started to tackle the issues posed by the development of digital technologies in the 1990s, i.e., relatively early. On this basis it has developed an articulated policy framework, culminating with the Digital Agenda for Europe (DAE) and the Digital Single Market (DSM), in which Cohesion Policy figures prominently.. •. The advantage of the contribution of Cohesion Policy (and more generally of ESIF) to DAE/DSM is its territorial dimension. The regional level is considered to be pertinent to address local specificities, establish a link between top-down and bottom-up initiatives in the field, and stimulate a local dynamic of commitment favouring the adoption of digital technologies.. This chapter lays out the conceptual and strategic framework of the study. It clarifies the notions and expectations placed on ICT and their economic implications. It shows levels and disparities in digital performances at national and regional levels across the EU, and it explains how EU policies (ESIF and DAE/DSM) intend to respond to the identified challenges.. 2.1. The pervasive role of digital technologies and the ‘digital transformation’: expectations and conditions. The contribution of technological developments – and of digital technologies in particular – to economic growth is a traditionally debated issue. 1 Benefits are expected to be grasped at different levels: • Macroeconomic (growth, productivity, employment); • Industry-level (local and regional growth and employment); • Firm-level (productivity, industrial organisation, process and product innovation); • Social changes (working, learning, participation in public life, etc.). These potential benefits come with associated risks and require policy-makers to be cautious about the conditions for minimising them while harnessing their potential. Deep effects are expected in terms of reshaping of business models, the impact on the labour force and the future of work (e.g. net effect on employment, social security and pension schemes etc.). 2 1. 2. Following the contributions of economists such as Romer, Lucas, Grossman and Helpman and Aghion and Howitt in the 1990s, numerous studies of economic growth place technological change at the heart of the growth process. For a review, see European Parliament, CSIL, and PPMI (2013), Internet, Digital Agenda and economic development of European regions. Loebbecke and Picot (2015), Reflections on societal and business model transformation arising from digitization and big data analytics: A research agenda.. 19.
(22) IPOL | Policy Department for Structural and Cohesion Policies _______________________________________________________________________________ While technologies such as robotics and machine learning may pose a threat to the current levels of employment, other digital technologies may help to create new opportunities and more flexible jobs allowing displaced workers to recoup income as independent workers. This, in turn, raises questions such as dissatisfaction with income variability, lack of benefits associated with traditional work, etc. A fundamental feature of digital technologies is that their rate of development is extremely fast, both quantitatively and qualitatively. Indeed, the evolution of the costperformance of the three ‘core digital technology building blocks’ (computing power, storage and bandwidth) follows exponential laws 3 and show no sign of slowing down unlike some past technological breakthrough (e.g. the introduction of electricity). This pace of change has been accompanied by the sequential emergence of several terms and notions that reflect both technological development and the perception of their impacts on the economy and society as a whole. Even though these terms are often used interchangeably in practice (e.g. in business or policy-making), the perspectives they convey provide insights into the evolution of policies. A clear understanding of these terms and notions is, therefore, a requisite for analysing the issues they pose and envisaging the possible policy responses. It is worth taking a chronological perspective and tracing their emergence 4 in order to infer a sense of the importance and the nature of the mutations at work. Information and Communication Technologies Information and Communication Technologies (ICT) are a set of technologies and applications enabling the electronic storage, retrieval, processing and transfer of data to a wide variety of users. 5 Existing definitions of ICT vary; however, they all imply information generation, transmission and the use of an electronic format. The concept of ICT emerged under its modern meaning in academic literature in the 1980s. 6 This concept is thus strongly linked to a technological approach that can be translated into diverse policy interventions, such as infrastructure development or the use of these technologies in a particular area (e.g. health, e-skills etc.). This perspective can be explained by the fact that ICT are considered as General Purpose Technologies (GPT), i.e. technologies that can potentially be used and adapted to all phases of the production process in several sectors, while yielding important changes in operations, products and relationships between stakeholders and sectors. 7 ICT also refers to a specific sector, regrouping a wide range of different economic activities such as ICT manufacturing, provision of ICT network services, wholesale or retail of ICT, and other ICT services. The debate on the statistical definition of the ICT sector has been wide, resulting in a list of NACE codes proposed by the OECD in 2007. 8 This work allows us to measure the ICT sector’s core indicators. However, in face of new technological developments,. 3. 4. 5. 6. 7. 8. John Hagel, John Seely Brown, Tamara Samoylova, and Michael Lui (2013), From exponential technologies to exponential innovation. Google Ngram can be used to track the emergence of these terms and notions over time. This tool compiles several books and documents up to 2008. In spite of its limits (lack of distinction between types of document and countries, no data after 2008), it clearly shows the sequential rise of the use of different terms and notions. For instance, the number of occurrences of ‘Information Society’ increased nine fold between 1980 and 2008. An overview can be accessed through these links: http://bit.ly/2DPfSgU, http://bit.ly/2ufwDlO European Parliament, CSIL, and PPMI (2013), Internet, Digital Agenda and economic development of European regions. Melody, Mansell, and Richards (1986), Information and communication technologies: social science research and training. Turlea, Nepelski, Prato, and Institute for Prospective Technological Studies (2010), The 2010 report on R & D in ICT in the European Union. OECD (2011), OECD guide to measuring the information society 2011.. 20.
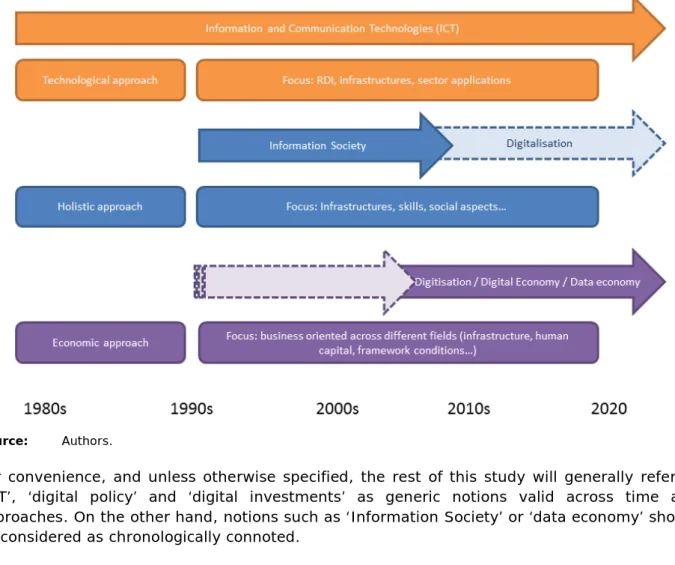
(23) Digital Agenda and Cohesion Policy ___________________________________________________________________________ measuring ICT approaches. 9. remains. a. major. issue. requiring. new. methodological. and. statistical. In policy terms, the concept of ICT (or notions closely related, such as telecommunication technologies) is mostly related to research and development, infrastructures and sectoral applications of technologies. Information Society Since the beginning of the 1990s the concept of Information and Communication Technologies has been studied and debated in relation to the impact that ICT can exert on the economy and on society as a whole, rather than by looking merely at the technical and technological aspects of ICT. This shift in focus has given rise to the idea of the Information Society - a society where all social and economic aspects of ICT are embedded and analysed. This expanded approach opened up new perspectives in policy terms as it broadened the scope of policy intervention beyond the traditional fields of technological support and business and operational support to encompass areas such as investments in ICT-related skills, attention to universal access to ICT, access to knowledge and new learning methods through the use of ICT, etc. The Information Society was a widely used concept in EU policy from the 1990s to the 2000s. The concept was adopted and adapted through the actions of the European Commission in the early 1990s, mainly with the 1994 Bangemann Report and a related Action Plan ‘Europe’s way to Information Society’ (see below). 10 Between the late 2000s and the early 2010s, the term was less frequent (but still present) in EU policy documents. Digitisation, Digitalisation, Digital Economy and Digital Transformation As ICT moved from the technical/technological realm to include the economy and society as a whole, so did the concept of digitisation. Initially conceived as a technical process converting analogical information into digital (based on sequences of 0s and 1s) information, the meaning of digitisation has shifted to encompass a wider domain of social life through the use of digital communication and media infrastructures. In this respect, the process has lost its specific core of converting analogue data streams into digital bits to extend its influence to digital media and acquire a new, societal role. This transformation is often referred to as ‘digitalisation’. In this sense, digitalisation has come to refer to the structuring of many and diverse domains of social life around digital communication and media infrastructures. 11 Today the term ‘digital transformation’ is used extensively in the public sector, in business and in the media. It generally has a business-oriented connotation, 12 but it also refers to the wider societal effects of digitalisation. Interestingly, the Digital Transformation Scoreboard published by the European Commission does not propose any definition, but tends to adopt a business approach with the aim of deriving useful evidence from a policy perspective. 13 Whether it is defined at business or societal levels, what is specific about this notion is that it is not 9. 10. 11 12. 13. Colecchia, Panizza, Köksal-Oudot, Spiezia, Montagnier, Herrera-Gimenez, Serra-Vallejo, and Bourassa (2014), Measuring the digital economy: a new perspective. See Ducatel, Webster, and Herrmann (2000), The Information Society in Europe: Work and Life in an Age of Globalization They argue that the European vision broadly takes on the US approach, but with more emphasis on social/cohesion aspects even if adjustments are minimal. Scott Brennen and Daniel Kreiss (2014), Digitalization and Digitization. For example: ‘Digital transformation is the continuous process by which enterprises adapt to or drive disruptive changes in their customers and markets (internal and external ecosystems) by leveraging digital competencies to innovate new business models, products and services that seamlessly blend digital and physical business and customer experiences while improving operational efficiency and organizational performance’. See IDC (2018), Digital Transformation. European Commission (2017), Digital Transformation Scoreboard.. 21.
(24) IPOL | Policy Department for Structural and Cohesion Policies _______________________________________________________________________________ restricted to technological change, but encompasses all other types of change (organisational, cultural etc.) that are necessary to take advantage of technological advances. Data economy The data economy refers to the overall impact of the data market on the economy as a whole. It involves the generation, collection, storage, processing, distribution, analysis, elaboration, delivery and exploitation of data enabled by digital technologies. The data market is the marketplace where digital data or data-enabled services are exchanged as ‘products’ or ‘services’ as a result of the elaboration of raw data; the data market is, therefore, a businessoriented concept. 14 The data economy represents a wider concept than the data market, as it apprehends the value and wealth generated by data in the economy as a whole (not just across businesses) by the exploitation of data. This reflects a new qualitative and quantitative feature characterising the evolution of digital technologies, i.e. the emergence of large amounts of data as a new economic resource. It is accompanied by the emergence of a new generation of technologies designed to extract economic value from very large volumes of data by enabling their capture and/or analysis at very high speed: big data analytics, but also cloud computing, artificial intelligence, blockchain, etc. (see Annex I for a highlight on three such technologies: artificial intelligence, cloud computing and big data analytics). Figure 1.. Source:. Evolution of notions pertaining to digital technologies and their focus. Authors.. For convenience, and unless otherwise specified, the rest of this study will generally refer to ‘ICT’, ‘digital policy’ and ‘digital investments’ as generic notions valid across time and approaches. On the other hand, notions such as ‘Information Society’ or ‘data economy’ should be considered as chronologically connoted.. 14. IDC and Open evidence (2017), European Data Market Study (SMART 2013/0063).. 22.
(25) Digital Agenda and Cohesion Policy ___________________________________________________________________________. 2.2. Digital performance in Europe: state of play. Digital performance can be defined as the ability of a country, region, economic sector, individual firm or citizen, to exploit the benefits linked to Information and Communication Technologies. Therefore, it encapsulates: 15 • The level of development of the ICT infrastructure/equipment available; • The knowledge, digital literacy and digital skills present; • The usage and uptake of digital products, services and technologies by citizens, firms and the public sector; • Others. Digital performance conditions several social and economic dynamics and their translation into potential economic and social benefits. 2.2.1. The perceived EU-US digital gap. Since the 1990s it has commonly been considered that the EU is lagging-behind the United States in collecting digital benefits (e.g. contribution of ICT to total output growth). 16 For instance, a recent McKinsey study estimated that Europe was operating at only 12% of its digital potential 17 in 2016. Accordingly, additional digitisation efforts could significantly boost European growth, for instance if laggard sectors were to double their digital intensity, it would add EUR 2.5 trillion to Europe’s GDP in 2025. 18 This situation does not prevent Europe from representing a growing and dynamic ICT market. According to IDC, the total value of ICT spending 19 in the EU28 amounted to more than EUR 624 billion in 2017 and was projected to reach EUR 636.3 billion in 2020. By comparison, the US would generate more than EUR 990 billion in 2017 and comfortably exceed the threshold of EUR 1 000 billion in 2020. 20 More interestingly, the value of Europe’s Data Market 21 is second only to the USA. The impact that this market generates on the economy as a whole (the ‘Data Economy’) has become more and more visible over the past few years (from 2014 to 2017), thus rapidly closing the gap with the American economy. However, compared to the USA, the EU continues to suffer from higher levels of fragmentation. Europe is more divergent than the US when it comes to the usage of digital technologies across companies, including those in the same sector. This is partly due to structural factors (such as the greater presence of SMEs in Europe than in the USA), to cultural and educational factors (such as Europe’s relatively weaker position in creating and keeping the necessary digital skills to support the digital transformation process). Indeed, Europe lacks large-scale digital champions such as Amazon, Apple, Facebook and Google-Alphabet. EU companies appear to be less capable than their American counterparts of capitalising on and exploiting the increasing amount of data at their disposal. Nevertheless, the EU remains a protagonist in many areas of the data economy. It is commonly held that it has a lively digital start-up scene and considerable innovation capacity, but it is still unable to translate this 15. 16 17. 18 19. 20. 21. European Parliament, CSIL, and PPMI (2013), Internet, Digital Agenda and economic development of European regions. McKinsey Global Institute (2016), Digital Europe: Pushing the Frontier, Capturing the Benefits. Digital potential is the difference between the maximum and actual value of the McKinsey Global Institute’s Industry Digitization Index. This index ‘uses dozens of indicators to provide a snapshot of digital assets, usages, and workers’. McKinsey Global Institute (2016), Digital Europe: Pushing the frontier, capturing the benefits. ICT spending is defined as the total expenditure in ICT technologies in a given market (country, or vertical industry: Manufacturing, Retail, Finance, etc.). ICT spending includes expenditure for: Hardware, Software, IT services, and telecom. IDC (2017), Worldwide Black Book Standard Edition.; IDC and Open evidence, European Data Market Study (SMART 2013/0063). The Data Market is defined as the total value of data-based products and services produced and exchanged, see IDC and Open evidence (2017), European Data Market Study (SMART 2013/0063).. 23.
(26) IPOL | Policy Department for Structural and Cohesion Policies _______________________________________________________________________________ potential into global digital platforms as happens in the USA. 22 It seems that in terms of Research and Innovation, and of the subsequent innovative technologies, Europe is slower than the US in building an effective ecosystem to turn these technologies in commercially exploitable applications. In areas such as robotics, augmented reality/virtual reality and machine learning, for instance, – all future engines of the digital transformation large European companies are investing significantly, 23 but this may not provide sufficient critical mass to compete with American manufacturers. Europe’s relative delay in keeping up with the US in these strategic areas may have undesired consequences on employment and the future of work in the EU. These problems are aggravated by further internal disparities within the EU itself. 2.2.2. Disparities in digital performance within Europe. Several disparities in terms of digital performance can be observed across the European Union, both in static (2017) and dynamic terms. These disparities are of different types: sectoral, social and geographical. They lead to an uneven distribution of digital-related benefits and can also threaten the cohesion objective of the EU. Even if there are several issues regarding data availability (especially at the regional level and for SMEs), 24 an analysis of the current and past digital disparities in Europe is essential, as it has been a major rationale for policy intervention since the 1990s. 25 Firstly, across economic sectors, the levels of uptake and usage of digital technologies differed considerably as of 2016. According to the MGI Industry Digitisation Index for Europe, while sectors such as ICT, Media, Finance and Insurance were already very highly digitised, Entertainment, Hospitality, Agriculture and Construction were lagging behind. 26 Additionally, there were major differences in digitisation across individual firms, with the leading ones taking the opportunity to transform their processes thanks to new technologies (e.g. additive manufacturing, Internet of Things). Then, the concept of digital divide is central in order to grasp the existing disparities in digital performances across Europe. It is defined by the OECD as ‘the gap between individuals, households, businesses and geographic areas at different socio-economic levels with regard both to their opportunities to access information and communication technologies (ICT) and to their use of the Internet for a wide variety of activities’. 27 Concretely, it is linked to two major (interconnected) aspects: 28 • Social divide, depending on economic situation, levels of skills and education, age; • Geographical divide, especially following an urban-rural dichotomy; with rural areas often experiencing slower internet speeds, fewer technological choices and higher prices. At the national level, disparities can be observed in terms of overall digital performance as well as for several distinct areas. The Digital Economy and Society Index (DESI) provides a comprehensive overview based on: 29. 22. 23 24. 25 26 27 28 29. There are a few notable exceptions, e.g. Spotify in Sweden, Deezer in France, Shazam in the UK, Gemalto in the Netherlands, etc. European Commission (2018), Digital Transformation Scoreboard. Datasets on digital performance that are comparable across the EU Member States are available on Eurostat. However, they mostly focus on households and individuals, especially at the regional level. European Commission (1997), Cohesion and the Information Society. McKinsey Global Institute (2016), Digital Europe: Pushing the Frontier, Capturing the Benefits. OECD (2001), Understanding the Digital Divide. Negreiro (2015), Briefing Bridging the Digital Divide in the EU. European Commission (2018), DESI — Digital Scoreboard - Data & Indicators.. 24.
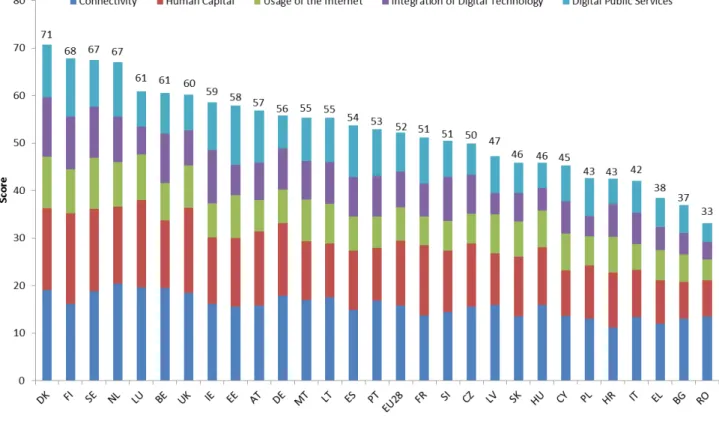
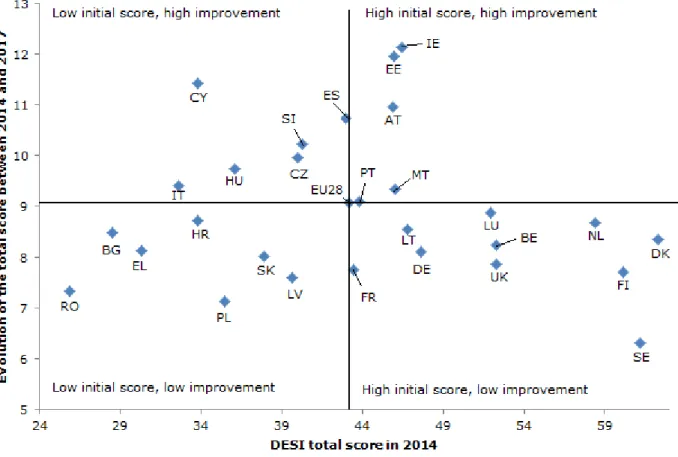
(27) Digital Agenda and Cohesion Policy ___________________________________________________________________________ • • • • •. Connectivity (infrastructure, broadband and internet access); Human Capital (digital skills and inclusion); Use of Internet; Integration of Digital Technology (business digitisation, use of e-commerce); Digital Public Services (e-government services).. The scores of the DESI range from 0 to 100. In 2017 the EU average score was about 52, with important discrepancies among the Member States. Demark topped this ranking with a score of 70, closely followed by Finland and Sweden. In contrast, Romania achieved a score of 33, close to Bulgaria and Greece. The different scores were highly correlated with each other, suggesting that high performance in one specific area is usually linked to high performance in others.. Figure 2.. Source:. Digital Economy and Society Index in 2017 by Member State. Authors based on European Commission (2018), DESI — Digital Scoreboard - Data & Indicators.. Moreover, the improvement in the total DESI score between 2014 and 2017 does not seem to be linked to the initial total score in 2014. It suggests that there is no unconditional catchingup in terms of digital performance, and that the differences in improvement could stem from several factors (such as demographic evolution, technologies deployed, quality of government).. 25.
(28) IPOL | Policy Department for Structural and Cohesion Policies _______________________________________________________________________________ Figure 3.. Source:. Total DESI score in 2014 and improvement between 2014 and 2017. Authors based on European Commission (2018), DESI — Digital Scoreboard - Data & Indicators.. The overall patterns of national disparities are largely confirmed by focusing on specific indicators (that are often included in the computation of the DESI itself), such as broadband coverage, prices and actual access, digital skills, usage of the internet, digitisation of enterprises and government services. Broadband can be defined as ‘a data transmission capacity associated with a particular speed of transmission and the provision of high-speed internet access’. 30 The European Union has defined different categories of broadband, depending on the data transmission rates. Basic broadband (256 Kbps) coverage is almost universal in the EU, with fixed technologies covering 98% of homes in 2017. 31 However, some Member States (Poland, Slovakia and Romania) are lagging behind with fewer than 90% of homes covered. In terms of fast and ultrafast broadband access, a different picture is observable:. 30 31. Garcia Calvo (2012), Universal Service Policies in the Context of National Broadband Plans European Commission (2017), Europe’s Digital Progress Report 2017. 26.
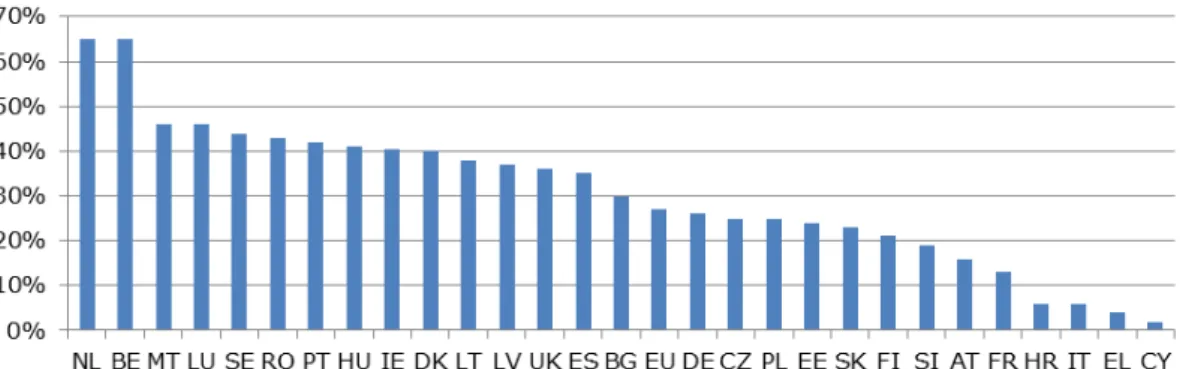
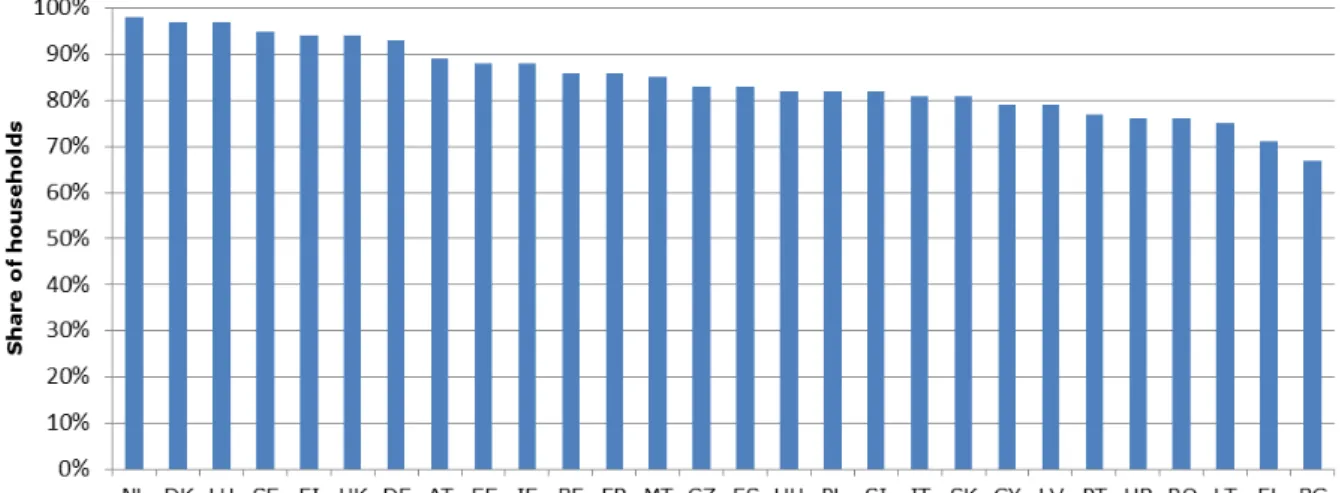
(29) Digital Agenda and Cohesion Policy ___________________________________________________________________________ Figure 4.. Source:. Figure 5. 2016.. Source:. Fast broadband (at least 30 Mbps) household penetration rate in 2016. European Commission (2017), Europe’s Digital Progress Report 2017.. Ultrafast broadband (at least 1000Mbps) household penetration rate in. European Commission (2017), Europe’s Digital Progress Report 2017. The household penetration rate for these high-speed broadband networks (at least 1,000 Mbps) is high in the usual top performing Member States (e.g. the Netherlands and Belgium), but also in some that are lagging behind by most metrics (e.g. Romania, topping the ranking in terms of ultrafast broadband household penetration). It should be noted that there is an important urban-rural gap for high-speed broadband coverage. 32 According to the 2016 report on EU broadband coverage, only 39.2% of households in EU rural areas are covered by Next Generation Access networks, compared to 75.9% of all EU households 33. This situation puts rural areas at risk of digital exclusion. Retail prices also vary substantially across the EU Member States, by a factor of about three between the Member States with the most affordable prices and those with the most expensive ones. Differences in geography (population density, areas covered) and market structure (competition among operators, demand) could explain part of these differences. Coverage, technologies and retail prices are key determinants of the uptake and usage of the internet by both households and companies. However, other factors 34 (such as perceived utility of the internet, skills, demographics or openness to innovation) affect the actual access and usage. Indeed, in spite of quasi-universal basic broadband coverage in the EU, in 2017 the percentage of households actually accessing the internet at home was the following:. 32 33. 34. Negreiro (2015), Briefing Bridging the digital divide in the EU. European Commission, IHS Markit, and Point topic (2017), Broadband Coverage in Europe 2016: Mapping progress towards the coverage objectives of the Digital Agenda. Negreiro (2016), Briefing Bridging the Digital Divide in the EU.. 27.
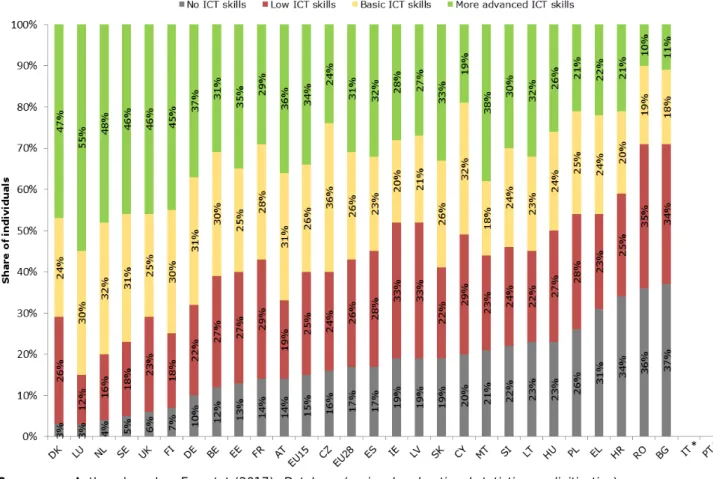
(30) IPOL | Policy Department for Structural and Cohesion Policies _______________________________________________________________________________ Figure 6.. Source:. Share of households actually accessing the internet in 2017. Authors based on Eurostat (2017), Database (regional and national statistics on digitisation).. In turn, actual internet access in households is strongly linked to individual digital skills and usage behaviour. ICT skills are assessed every year by Eurostat in its Community Survey on ICT usage. Based on this data, in 2017 83% of Europeans had some digital skills (low, basic or more advanced), compared to 75% in 2011. 35 In particular, no country had a majority of people without any digital skills in 2017. However, severe national disparities were still observed in terms of ICT skills. For instance, in Luxembourg 55% of people had more advanced digital skills, compared to only 10% in Romania.. 35. European Parliament, CSIL, and PPMI (2013), Internet, Digital Agenda and economic development of European regions.. 28.
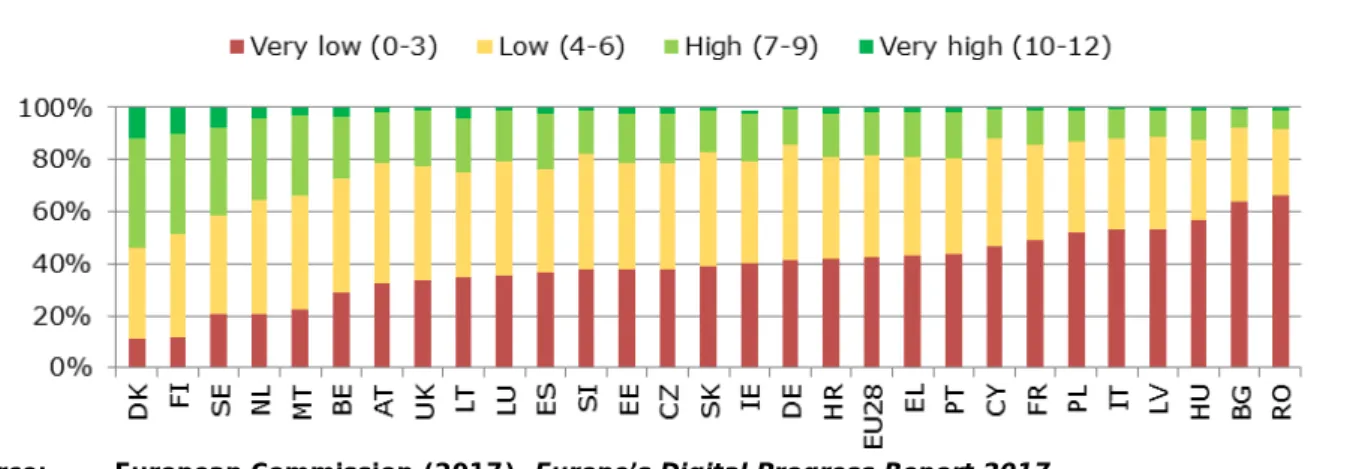
(31) Digital Agenda and Cohesion Policy ___________________________________________________________________________ Figure 7.. Distribution of digital skills among individuals in Member States in 2017. Source: Authors based on Eurostat (2017), Database (regional and national statistics on digitisation). Note: *no data for IT and PT. This distribution of skills strongly mirrors the regular use of the internet by individuals. National disparities are also encountered in the area of enterprises’ digitisation. The Digital Intensity Index measures the availability of 12 different digital technologies at the firm level 36 (e.g. internet for at least 50% of employees, recourse to ICT specialists, fast broadband, website with advanced functions, eCommerce turnover etc). According to this index, only 20% of EU28 companies could be considered as ‘highly digitised’ (7-9 technologies) in 2016. In some countries such as Poland, Italy, Latvia, Hungary, Bulgaria and Romania, more than 50% of companies had very low levels of digitisation. By contrast, more than 50% of companies were highly or very highly digitised in Denmark. The size of companies seems to be a major determinant of the digitisation level, with SMEs lagging behind large companies, generating a gap in the opportunities to be exploited. 37. 36 37. European Commission (2017), Europe’s Digital Progress Report 2017. European Commission (2017), Europe’s Digital Progress Report 2017.. 29.
(32) IPOL | Policy Department for Structural and Cohesion Policies _______________________________________________________________________________ Figure 8.. Source:. Digital Intensity Index (share of enterprises by level) in 2016. European Commission (2017), Europe’s Digital Progress Report 2017.. Finally, e-government performance is also experiencing important variations across Member States, though the patterns are slightly different from most other indicators. Using data from the e-government benchmark of 2017, 38 it is possible to assess the overall performance based on user-centricity (availability and usability of public e-services), transparency (government transparency on the process of service delivery, own responsibilities and performance and personal data involved), mobility (cross-border availability and usability of a service for foreign citizens and businesses) and key enablers (availability of five functionalities, such as electronic ID):. Map 1:. Source: 38. Overall e-government performance in 2016. Authors based on European Commission (2017), eGovernment Benchmark 2017.. European Commission, Capgemini, Sogeti, IDC, and Politecnico di Milano (2017), eGovernment Benchmark 2017.. 30.
(33) Digital Agenda and Cohesion Policy ___________________________________________________________________________ In particular, the Baltic States, Portugal and Spain score high for eGovernment, alongside the usual forerunners in digital performance (Scandinavia, the Netherlands). In contrast, some countries seem to underperform for these aspects, e.g. the United Kingdom. Thanks to these datasets and the existing literature, it is, therefore, possible to distinguish clusters of countries that differ in terms of digital performance. For instance, using data on the different dimensions of the digital divide, researchers were able to identify patterns of performance among Member States, based on the use of e-business, internet access costs, ICT infrastructures and ICT adoption by the population. 39 However, these approaches at the national level fail to account for important within-country disparities and can lead to inconsistent results. Digital performance at regional level At the regional level, previous research showed the existence of wide gaps within and between Member States. 40 The most recent data reveal the persistence of such disparities in digital performance as of 2017. Unfortunately, refined data is often unavailable at the NUTS 2 level, resulting in an analysis of a few core indicators developed by Eurostat: • Internet access (share of households); • Broadband access (share of households); • Regular use of the internet (share of individuals); • E-commerce use during the last year (share of individuals). Even though the lack of more precise data leaves gaps in the analysis, especially for the regional patterns for enterprises, these indicators provide a snapshot of several key dimensions of digital performance (infrastructure, skills, usage and uptake, business). In general, important regional differences can be observed for all the selected indicators in 2017. Northern and Western regions of Europe tend to perform better than Southern and Eastern ones for all the studied metrics. In particular, regions in Scandinavia, the United Kingdom, the Netherlands and Western Germany rank the highest. Conversely, most regions in Bulgaria and Romania tend to lag behind. Finally, all the tested indicators are highly intercorrelated. 41 However, in some cases, performance gaps occur between the different indicators in a single region. For instance, in some Romanian regions, broadband access is relatively high, while the use of e-commerce is low. However, there are some key nuances of this general picture. Regardless of the country, capital regions tend to achieve higher performances. This is especially true in the New Member States, where the performance of the capital region often matches the level of regions in the more digitally advanced Member States. In some countries, important regional divides are at play, notably in Italy or Spain, where gaps in digital performance closely follow disparities in regional economic development.. 39 40 41. Cruz-Jesus, Oliveira, and Bacao (2012), Digital divide across the European Union. Vicente and López (2011), Assessing the regional digital divide across the European Union-27. With all the coefficients of correlation above 0.8 (absolute value).. 31.
(34) IPOL | Policy Department for Structural and Cohesion Policies _______________________________________________________________________________ Map 2:. Overview of regional digital performance indicators.. 32.
(35) Digital Agenda and Cohesion Policy ___________________________________________________________________________. Source:. Authors based on Eurostat (2017), Database (regional and national statistics on digitisation).. 33.
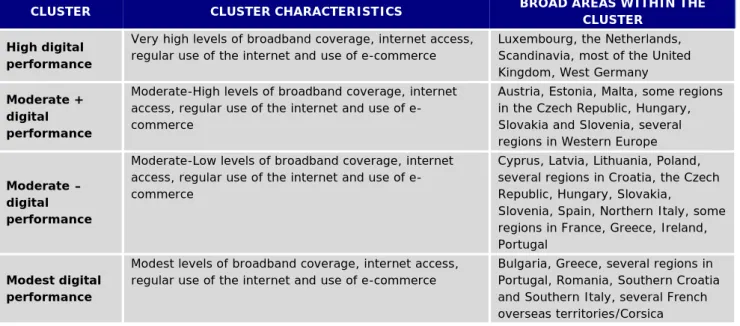
(36) IPOL | Policy Department for Structural and Cohesion Policies _____________________________________________________________________________ It is possible to identify clusters of countries and regions sharing similar digital performance, by using some indicators available at the regional level: 42 Table 1.. Clusters of countries and regions sharing similar digital performance. CLUSTER. CLUSTER CHARACTERISTICS. High digital performance Moderate + digital performance. Moderate – digital performance. Modest digital performance Source:. BROAD AREAS WITHIN THE CLUSTER. Very high levels of broadband coverage, internet access, regular use of the internet and use of e-commerce. Luxembourg, the Netherlands, Scandinavia, most of the United Kingdom, West Germany. Moderate-High levels of broadband coverage, internet access, regular use of the internet and use of ecommerce. Austria, Estonia, Malta, some regions in the Czech Republic, Hungary, Slovakia and Slovenia, several regions in Western Europe. Moderate-Low levels of broadband coverage, internet access, regular use of the internet and use of ecommerce. Cyprus, Latvia, Lithuania, Poland, several regions in Croatia, the Czech Republic, Hungary, Slovakia, Slovenia, Spain, Northern Italy, some regions in France, Greece, Ireland, Portugal. Modest levels of broadband coverage, internet access, regular use of the internet and use of e-commerce. Bulgaria, Greece, several regions in Portugal, Romania, Southern Croatia and Southern Italy, several French overseas territories/Corsica. Authors based on Eurostat (2017), Database (regional and national statistics on digitisation).. These clusters tend to confirm the general findings of individual indicators and allow a refined identification of regional divides within countries (e.g. Spain, Italy, France, Czech Republic). Map 3:. Regional clusters of digital performance in 2017. Source: Authors based on Eurostat (2017), Database (regional and national statistics on digitisation). 42. Namely: household broadband coverage, internet access by households, frequent use of the internet by individuals, use of e-commerce by individuals; in order to cover the different dimensions with data available at the regional level without redundancy. Datasets on firms are not available at the regional level.. 34.
(37) Digital Agenda and Cohesion Policy ___________________________________________________________________________ Available theoretical and empirical evidence thus suggests that the digital performance of Europe should be improved in order to fully reap the benefits related to Information and Communication Technologies. Moreover, the question of disparities (especially regional ones) ought to be addressed should this goal be attained. These strong rationales for policy led to several initiatives, culminating in the Digital Agenda for Europe and Digital Single Market. As a consequence, an in-depth analysis of the evolution of such policies will be presented, with an emphasis on elements that are relevant for the current period and beyond.. 2.3. EU Policy response: conceptual framework and underlying logics of intervention. Against this background, the EU has gradually deployed a policy framework to ensure that the benefits related to ICT are fully exploited and to catch-up with international competitors in areas where delays are perceived to be acute. EU policies related to digital aspects have been designed and implemented since the early 1990s, with forerunners going back as early as the late 1980s. These policies were strongly consolidated in 2010 and in 2015, culminating in the Digital Agenda for Europe and the Digital Single Market. Cohesion Policy figures prominently in this framework. Taking a historical perspective, this section describes the rationale underlying the establishment of this policy framework and the expected contribution of Cohesion Policy. 2.3.1. From individual concepts to frameworks: the emergence of the EU digital policy. The 1990s and the conceptualisation of an EU Information Society As explained above, a major concern backed by evidence in the early 1990s was that the EU was lagging behind the USA (and other developed economies such as Japan) when it came to ICT development, diffusion and uptake. That situation was perceived as a threat; in the 1993 Delors Report on the challenges of the 21st century, ICT was identified as a lever to ensure both competitiveness and the transition towards an ‘Information Society’, where ‘services provided by information and communication technologies underpin human activities’. 43 Although this report already contained several features of the emerging EU digital policy, the 1994 Bangemman Report is widely considered as its true beginning. 44 It developed the idea of an ‘Information Society’ in the European context, sharing many elements of the US approach, 45 in particular the preference for and confidence in market mechanisms to finance the supply-side dimension of ICT (network infrastructures), while ensuring universal access. It also emphasised the importance of demand-side support, with a strong role for the EU and its Member States in that sphere. 46 The report, therefore, induced a first (limited) shift away from a solely technological and infrastructural approach (contrary to the USA, where infrastructures were highlighted with the Information Superhighway). 47 This led to an action plan called ‘Europe’s way to the Information Society’ in 1994, with four major fields of intervention: 48 • Regulatory and legal framework (emphasis on liberalisation and privacy); 43. 44. 45. 46 47. 48. European Commission (1993), Growth, competitiveness, employment: the challenges and ways forward into the 21st century: white paper. Because it led to specific policy action plans, see Taylor and Downes (2001), The Structural Funds Facilitating the Information Society. European Commission (1994), Report on Europe and the global information society; Ducatel, Webster, and Herrmann (2000), The Information Society in Europe: Work and Life in an Age of Globalization; Taylor and Downes (2001), The Structural Funds Facilitating the Information Society. Taylor and Downes (2001), The Structural Funds Facilitating the Information Society. Ducatel, Webster, and Herrmann (2000), The Information Society in Europe: Work and Life in an Age of Globalization. uropean Commission (1994), EUROPE’ S WAY TO THE INFORMATION SOCIETY. AN ACTION PLAN.. 35.
Figure
+7
Documento similar
265 Council of the European Union, Trade Policy Committee, Intra-EU investment treaties, Non-paper from Austria, Finland, France, Germany, and the Netherlands, 7 Abril
† Joint position statement of the European Academy of Paediatric (EAP), the European Society for Paediatric Gastroenterology, Hepatology and Nutrition (ESPGHAN), the European
Enlightening ICT skills for youth employability in the European Union”, “Smart Cities for wellbeing: Youth employment and their skills on computers”, “Sustainable
The use and abuse of personal data for electoral purposes, cloaked as freedom of commerce, might pose a serious threat to free elections and electoral equity at
Characteristics for Smart Urban Governance Dg.O 2017: the Proceedings of the 18th Annual International Conference on Digital Government Research: Innovations AndTransformations
The European network for Argumentation and Public PoLicY analysis (APPLY) improves the way European citizens understand, evaluate and contribute to public decision-making on
The first goal is to examine the presence of the terms Communication / Social communication / Information (scientific field) and Audiovisual communication
Once we achieve an instrument to analyse the socio-economic vulnerability of EU regions in terms of the 2021–2027 Cohesion Policy goals, the next step is to study how a situation
