Cost–Utility Analysis of Magnetic Resonance Imaging Management of Patients with Acute Ischemic Stroke in a Spanish Hospital
13
0
0
Texto completo
(2) Neurol Ther (2015) 4:25–37. 26. The results were sensitive when the indirect. and. costs were included in the analysis. Conclusion: Total direct costs and QALYs were. information. lower in the MRI group; however, this difference was not statistically significant. MRI was shown to be a cost-effective strategy for the. provides. necessary [19].. and. Furthermore,. relevant MRI. techniques are as effective as CT for ruling out or defining the magnitude of hemorrhage [20– 22]. Thrombolysis based on MRI C3 h after stroke onset is safer and potentially more. first imaging test in AIS in 22% of the iterations according to the efficiency threshold in Spain.. effective than thrombolysis based on CT. Keywords: Acute ischemic stroke; Computed tomography; Cost–utility analysis; Magnetic. widely available than CT. The current study aimed to determine, from. resonance; Spain; Stroke. a societal perspective, the cost–utility of MRI compared with CT as the first imaging test in patients with AIS.. INTRODUCTION According with Global Burden of Diseases, Injuries, and Risk Factors Study [1], stroke was the second most common cause of death and the third most common cause of disability-adjusted life-years worldwide in 2010 [2]. Patients who survive a stroke have a higher risk of another stroke, ischemic heart disease, or dementia [3]. Stroke has a considerable economic impact during hospitalization and following discharge [4–11]. Major advances in acute stroke care include the creation of dedicated stroke units [12], thrombolytic therapy [13, 14], and new diagnostic techniques, especially imaging techniques. Recent research into drugs for treating stroke is based on the identification of the diffusion–perfusion mismatch in magnetic resonance imaging (MRI). Despite technological. within 3 h in patients with acute stroke [23, 24]. However, MRI is more expensive and less. advances. in. neuroimaging, computed tomography (CT) remains the examination of choice in patients with acute stroke [15]. MRI is more sensitive and more specific than CT in early detection of acute ischemic stroke (AIS) [16–18]; moreover, the variability in the interpretation of results is lower in MRI [16]. MRI in patients with acute stroke allows for a rapid diagnostic evaluation. METHODS A cost–utility analysis from societal perspective was developed. The study was conducted in patients with AIS at a referral hospital for stroke in Girona, Spain. The Hospital Doctor Josep Trueta’s (Girona, Spain) ethics committee approved the study. All procedures followed were in accordance with the ethical standards of the. responsible. committee. on. human. experimentation (institutional and national) and with the Helsinki Declaration of 1964, as revised in 2013. Informed consent was obtained from all patients for being included in the study. Data for the economic evaluation were obtained from an ad hoc prospective observational study that included patients with AIS who presented or were referred to the hospital between December 1, 2003 and March 9, 2005. The inclusion criteria were: age C18 years, stroke less than 12 h from onset, admission to the hospital’s stroke unit, and informed consent of the patient or relative. A 90-day time horizon was considered for outcomes according to the hospital’s stroke.
(3) Neurol Ther (2015) 4:25–37. management horizon. was. 27. protocol. less. Because. than. a. the. year,. time. Effectiveness. future. discounting was not required.. The measure of effectiveness was quality-. Alternatives Evaluated. adjusted life-years (QALYs). QALYs were estimated from utility values obtained from. The alternatives evaluated were cranial CT and cranial MRI (diffusion, perfusion MRI, and angiography). These alternatives were selected because CT was the most used in the study period and MRI was the technology that was to be evaluated, for the advantages in sensitivity, specificity [16], vascular occlusion, and mismatch area. Patients were assigned to undergo CT or MRI as the initial imaging technique in function of the availability of scanners at the time of emergency room admittance: patients admitted between 8 a.m. and 8 p.m. on weekdays (except holidays) underwent MRI as the initial imaging test, whereas patients admitted between 8 p.m. and 8 a.m. on weekdays or at any time on weekends and holidays underwent CT.. the modified Rankin Scale (mRS) and the time (in years) that the patient remained in that health state (mRS). The mRS is a tool widely used to assess primary or secondary outcomes in multicenter studies of stroke. The scale is validated in several languages, including Spanish [25]. This scale has been used in other studies,. including. a. clinical. trial. for. a. neuroprotective stroke agent, and reflects changes in the health status of patients [26]. The mRS was determined by a structured interview [27] before stroke, at hospital discharge,. and. 90 days. after. stroke.. The. investigator who assessed the mRS was trained and certified in the use of the mRS and was blinded to the diagnostic imaging test performed. A favorable clinical outcome was defined as an mRS score C2.. Hospital and Post-Discharge Costs. For each value of the mRS, a utility value obtained from previous studies [28, 29] was. According to the perspective of the study, both. assigned. These utilities were used because they were obtained from the Spanish general. direct health costs and other patient’s costs. population. were included. The expenditure for the following resources used in the hospital was. measurement preferences. Each health state (mRS) was associated with a utility value [28].. quantified for each patient: Cranial CT, cranial MRI, others diagnostic tests, physiotherapy,. As in that study [28], no utility value was assigned to patients with an mRS score of zero,. pharmacological treatment, and hospital stay.. it was decided to give a utility value of 0.90 that. In addition, a questionnaire was used to obtain information from patients about the post-. was obtained from a cost–utility analysis of recombinant tissue plasminogen activator (rt-. discharge resources used in the first 90 days after onset, for example, institutionalization,. PA) in patients with stroke [29]. Table 1 shows the utility value used in the current study for. rehabilitation, home adaptations, caregivers,. each mRS value.. and pharmacological treatment. All expenditures were expressed in Euros (2004).. The times considered for the calculation of QALYs were: Time 1 (in years) = length of. The information source for the costs is shown in the results.. hospital stay (LOS)/365 stay (from the stroke to discharge); and time 2 (in years) = (90 days-. through. different. methods. of.
(4) Neurol Ther (2015) 4:25–37. 28. Table 1 Modified Rankin Scale and utilities Health status (mRS)/measurement method. non-parametric Mann–Whitney U test. The. DG. VAS. comparison of means was done with Student’s t test. Statistical significance was set at 0.05. One-way and multi-way sensitivity analyses. 1. 0.78. 0.68. 2. 0.48. 0.47. were performed. In the one-way analysis, utility parameters (obtained by visual analog scale. 3. 0.26. 0.20. [VAS]),. 4. -0.04. 0.07. 5. -0.72 -0.02. productivity from days off work (obtained in the interview with the patient or caregiver), and. 6. 0.00. 0.00. The DG and VAS are methods of estimating utilities. Source: Pinto-Prades and Abellán-Perpiñán [28] DG double gamble, mRS modified Rankin Scale, VAS visual analog scale. indirect. costs,. including. lost. adjusted QALY (assuming the patient’s initial mRS remained unchanged) were considered. The. multi-way. sensitivity. analysis. was. performed using non-parametric bootstrapping [30]; a total of 1000 bootstrap samples were. LOS)/365 (from discharge until 90 days after. obtained. Data were analyzed with SPSSÒ (version. stroke).. 15.0., SPSS Inc., Chicago, IL, USA).. Incremental Cost-Effectiveness Ratio The total costs (hospital and post-discharge costs) for each study group were calculated. The incremental cost-effectiveness ratio (ICER) was calculated as follows: (Cost MRI-Cost CT)/ (QALY MRI-QALY CT). Clinical Data Collection In addition to the data for economic evaluation, the following variables were recorded: Sex, age, cardiovascular risk factors, prior treatment, date and hour of symptoms onset, and prior functional dependence. Stroke severity was determined daily by the National Institutes of Health Stroke Scale (NIHSS).. RESULTS Of 472 consecutive patients with stroke, 130 fulfilled the inclusion criteria. Of these, 87 patients underwent CT as the first imaging test and 43 patients underwent MRI. A total of 117 patients were alive 90 days after stroke and 3 patients were lost to follow-up. Baseline values did not differ between the two groups: 60% were male, most were retired, and 85% had an mRS score of 0 before stroke (Table 2). In both groups, hospital stay accounted for approximately 80% of hospital costs, and institutionalization accounted for nearly 45% of the post-discharge costs until 90 days after stroke (Table 3). On the other hand, no significant differences between the two groups. Analysis. were found in mRS (Table 4). Table 5 shows the results of the ICER analysis.. Data were analyzed for associations between. The use of MRI was observed to be a less expensive alternative, but resulted in less QALY. categorical variables with the Chi-square test. The comparison of medians was done with the. than CT for the diagnosis of AIS. In the one-way sensitivity analyses, the ICER increased with all.
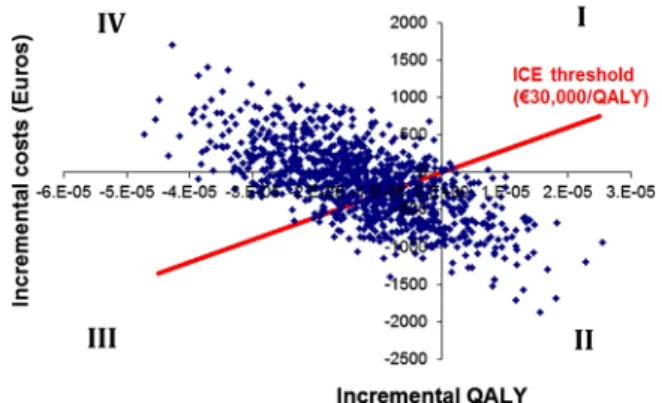
(5) Neurol Ther (2015) 4:25–37. 29. Table 2 Characteristics of included patients Variable. CT (n 5 87). MRI (n 5 43). P value. Mean (SD). 69 (11). 68 (13). 0.685. 30–45 years. 3.4%. 7.0%. 46–60 years. 19.5%. 16.3%. 61–75 years. 43.7%. 51.2%. 76–90 years. 33.3%. 25.6%. 55.2%. 69.8%. Age, years. Sex, male Employment prior to stroke. a. 0.110 0.951. Employed. 24.4%. 25.0%. Retired. 48.7%. 52.8%. Housewife. 23.1%. 19.4%. Unemployed. 1.3%. 0.0%. Receiving compensation. 2.6%. 2.8%. Hypertension. 67.8%. 60.5%. 0.407. Atrial fibrillation. 20.7%. 18.6%. 0.780. AMI. 8.0%. 11.6%. 0.507. Diabetes mellitus. 23.0%. 16.3%. 0.375. Smoking. 14.9%. 18.6%. 0.593. Prior stroke. 17.2%. 14.0%. 0.632. 0. 90.8%. 88.4%. 0.906. 1. 5.7%. 7.0%. 2. 3.5%. 4.6%. NIHSS at admission, median (IQR). 8 (4–16). 7 (3–18). 0.825. Time from stroke onset to imaging, minutes, mean (SD). 262.15 (173.56). 256.36 (175.45). 0.860. Risk factors. mRS score prior to stoke. AMI acute myocardial infarction, CT computed tomography, MRI magnetic resonance imaging, mRS modified Rankin Scale, NIHSS National Institutes of Health Stroke Scale, SD standard deviation a Information available only for patients, whose discharge destination was home, 72.4% and 74.4% for CT and MRI, respectively variables included, except with the adjusted. fall in quadrants III and IV (Fig. 1). This result is. QALY (Table 6). In the ICER analysis performed with the bootstrap, the simulated cases mainly. confirmed in the acceptability curve of costeffectiveness, where it can be appreciated that.
(6) 26.95 (22.78) 33.47 (33.97). 1 (1–1). 1 (1–1). 1 (0–1). 2 (0–5). 6 (4–9). Transcranial Doppler/Duplex. Carotid Duplex. Continuous carotid 1 (0–1) Doppler. 1 (0–1). Chest X-ray. Echocardiogram. Physiotherapy. Pharmacological treatmenta. 6 (4–11). Total stay (mean). –. 0 (0–4). Conventional bed. Total hospital costs. 5 (3–6). Stroke unit. Hospital stay (days). 29.07 (22.30). 0 (0–1). Cranial MRI. 3536.85 (2196.29). 2864.50 (1938.44). 771.93 (1286.58). 2092.57 (1298.19). 304.71 (427.44). 9.79 (11.96). 35.41 (19.46). 5.92 (1.97). 115.42 (134.64). 2 (1–2). 111.61 (39.60). –. 6 (4–7). 0 (0–2). 4 (4–6). 5 (3–6). 2 (0–4). 1 (0–1). 1 (0–1). 1 (0–1). 1 (1–1). 1 (1–1). 1 (1–1). 1 (0–1). Resource use, median (IQR). Resource use, median (IQR). Costs (Euros), mean (SD). MRI. CT. Cranial CT. Diagnostic tests. Hospital resources. Resource. 3165.25 (1446.63). 2448.70 (1289.84). 503.44(973.63). 1945.26 (830.21). 241.11 (387.59). 7.26 (9.15). 33.86 (34.18). 34.21 (20.30). 27.80 (22.75). 39.56 (16.12). 5.85 (1.31). 281.42 (75.67). 45.48 (43.45). Costs (Euros), mean (SD). Table 3 CT, MRI and P value (each one of them has two columns: resource use and costs). –. 0.619. 0.372. 0.821. 0.025. 0.361. 0.949. 0.079. 0.761. 0.227. 0.316. 0.205. 0.230. 0.499. 0.412. 0.223. 0.951. 0.079. 0.763. 0.229. 0.825. Hospital Josep Trueta. DOGC. DOGC. DOGC. DOGC. DOGC. DOGC. \0.001 ICS. \0.001 0.841. \0.001 ICS. Costs. Information source. \0.001. Resource use. P value. 30 Neurol Ther (2015) 4:25–37.
(7) 89.30 (253.90) 130.65 (724.69). 41.2%. Additional resourcesc 38.2%. 14.7%. 56.4%. 35.3%. 2 (0–3). 0. –. –. Rehabilitation sessionsc. Home adaptationsc. Caregiverd. Ambulance usec. Pharmacological treatment. Carotid endarterectomy. Total costs postdischarge. Total direct costs (mean). 2.8%. 1 (0–3). 41.4%. 54.0%. 31.0%. 40.0%. 60.0%. 5692.95 (4268.11). 3019.20 (3379.26). 878.56. 129.17 (127.33). 171.52 (371.64). 894.22 (1986.77). 202.57 (660.61). 148.06 (335.18). 54.77 (78.85). 79.0 (42.25–89.0) 1386.12 (2564.83). Costs (Euros), mean (SD). –. –. 0.139. 0.696. 0.570. 0.064. 0.869. 0.085. 0.471. Resource use. P value. Catalog of the Official College of Pharmacists 2004. DOGC. Home care services. Patients or relatives. Catalog orthotic and prosthetic devices covered by the ICS. DOGC. DOGC. 0.863. 0.455. \0.001 Hospital Josep Trueta. 0.146. 0.374. 0.855. 0.617. 0.299. 0.627. 0.571. Costs. Information source. CT computed tomography, DOCG Official Gazette of the Government of Catalonia 2004, ICS Catalan Institute of Health, IQR interquartile range, MRI magnetic resonance imaging, SD standard deviation a Included treatment with recombinant tissue plasminogen activator(CT: 28.7%, MRI: 23.3%) b Patients whose discharge destination was a nursing home, rehabilitation center, or another hospital c Percentage of patients who needed to use the resource d Percentage of patients who needed to pay a caregiver or whose relatives left their jobs to care for them. 5830.63 (4255.54). 2558.44 (2891.03). 0. 92.82 (123.15). 111.06 (322.93). 966.77 (1965.73). 46.82 (82.95). 76.0 (67–95). 1106.83 (2385.44). Resource use, median (IQR). Resource use, median (IQR). Costs (Euros), mean (SD). MRI. CT. Institutionalization (median, days)b. Post-discharge resources. Resource. Table 3 continued. Neurol Ther (2015) 4:25–37 31.
(8) Neurol Ther (2015) 4:25–37. 32. Table 4 Modified Ranking Scale at discharge and 90 days after stroke. was nearly four times more expensive than. Variable. CT. MRI. mRS at discharge. n = 87. n = 43. direct hospital costs were not higher in the group examined with MRI. These results are. Mean (SD). P value. 3.4 (1.5) 3.4 (1.6) 0.980. Categorized mRS score 26.4%. 34.9%. 0.891. 3–5. 71.3%. 60.5%. 0.424. Death. 2.3%. 4.7%. n = 85. n = 42. Mean (SD). in line with those reported by Beinfeld and Gazelle [31], who found no increase in hospital. B2. mRS at 90 days after stroke. CT examination to assess AIS, the overall. 0.276. costs. between. 1996. and. 2002. despite a substantial increase in the use of CT and MRI. The median LOS in the stroke unit was lower in the MRI group which may be due to earlier diagnosis and initiation of treatment, and possibly attributable to greater confidence in the information provided by MRI. In both. 2.6 (1.8) 3.0 (2.0). Categorized mRS score 0.503. groups, the mean LOS was lower than previously reported values (9.2–26 days) [6, 32,. B2. 50.6%. 42.9%. 3–5. 41.2%. 42.9%. 33]; however, these studies included patients. Death. 8.2%. 14.2%. with cerebral hemorrhage. Total direct hospital costs did not differ. CT computed tomography, MRI magnetic resonance imaging, mRS modified Rankin Scale, SD standard deviation. between groups, although the mean cost in the MRI group was slightly lower due to the. 22% of the iterations of the MRI result in a cost. shorter hospital stay in that group. As reported in other studies [6, 7, 11, 34–36], hospital stay. per QALY of €30,000, regarded as the limit of efficiency in Spain (Fig. 2).. was the largest single expenditure in the acute. DISCUSSION. In line with another study in stroke patients [10], only 24% of patients in the current study. The findings of the current study show that. were employed when the stroke occurred. Most. clinical outcomes at discharge and 90 days after stroke, as well as the total direct costs,. patients returned home after hospital discharge, also in agreement with the results of other. were similar for patients in the two groups. Interestingly, although MRI examination. studies [9, 10]. This data was reflected in sensitivity analysis where when costs due to. phase, particularly when the patient was in the stroke unit.. Table 5 Cost-effectiveness of MRI versus CT in patients with acute ischemic stroke Alternative. Cost (Euros). CT. 5830.63. MRI. 5692.95. Incremental cost. Effectiveness (QALY). Incremental effectiveness. ICER (cost/QALY). -0.1160. 11,868.97. 0.05230 -137.68. 0.04070. CT computed tomography, ICER incremental cost-effectiveness ratio, MRI magnetic resonance imaging, QALY qualityadjusted life-year.
(9) Neurol Ther (2015) 4:25–37. 33. Table 6 One-way sensitivity analysis Parameter. Variation in costs (Euros). Variation in QALY. ICER. Utility:VASa –. -0.00758. 18,163.59. Adjusted QALY. –. 0.01479. -9308.99. Indirect costs. -235.07. –. 19,870.67. ICER incremental cost-effectiveness ratio, QALY qualityadjusted life-year, VAS visual analog scale a VAS was used as utility to calculate QALY lost productivity were included (days off work) the ICER was higher. More than half of the patients in the current study needed a caregiver; 71% of the caregivers were not paid, a proportion in line with the results of a previous study [9], in which 74% of the patients who required assistance were attended by family members or friends. Thus, informal care plays an important role in stroke. Approximately, 26% of the caregivers in the current study were family members who had to leave their jobs to care for the patient. In this study, the use of MRI rather than CT as the initial diagnostic tool for assessing stroke patients did not result in better outcome at discharge or 90 days after stroke. However, no changes were made in the treatment protocol for patients undergoing MRI for the initial assessment. Because rt-PA treatment in the first. 3h. is. based. on. the. absence. of. hemorrhage or extensive infarct, this information can be reliably obtained with a simple CT study. There were no significant differences between the two groups in the distribution of patients treated with rt-PA. However, a recent study [37] found that using MRI-based penumbra to select patients for intravenous rt-PA after routine CT in patients with AIS increased costs, but was more costeffective.. Fig. 1 Incremental cost-effectiveness (ICE) plane of MRI versus CT in patients with acute ischemic stroke. Results of probabilistic sensitivity analysis. Simulation cases of patients in the CT and MRI group. CT computed tomography, MRI magnetic resonance imaging, QALY quality-adjusted life-year No. significant. differences. between. the. groups in mRS was found. Likewise, no significant differences in the parameters that were calculated from mRS, such as utilities and QALYs, were found. ICER in the simulations varied widely due to the lack of significant differences in the effectiveness of the two techniques. When a sensitivity analysis using utility values obtained with the VAS was performed, the variation in effectiveness between the two groups remained minimal (it was even lower than in the analyses of the baseline data), so the ICER was higher. As is shown in the graph of the cost-effectiveness plane (Fig. 1), a considerable proportion of the results of this study were located in the third quadrant, indicating that MRI is less expensive, but also less effective in terms of QALYs. Thus, MRI is not considered a dominant alternative or a dominated alternative. However, in a proportion of the bootstrap results MRI would be located in quadrant IV, meaning that it was less effective and more costly than CT. Thus, MRI would be a dominated alternative. Discussing two systematic reviews of costeffectiveness of CT and MRI for some clinical.
(10) Neurol Ther (2015) 4:25–37. 34. 30 years) thrombolytic therapy based on MRI was the dominant alternative compared to conventional treatment. Another important limitation is the cost. In the current study, costs are presented in Euros at the 2004 exchange rate. It was not considered appropriate to update the costs to 2014 because there were different aspects to consider other than the consumer price index, such as the structure of the market (supply, demand, innovation, and economic crisis among Fig. 2 Acceptability curve of magnetic resonance imaging versus computed tomography in patients with acute ischemic stroke. QALY quality-adjusted life-year. others). Nonetheless, the decision making of those technologies sensitivity analysis.. is. supported. by. the. The current results indicate that it is economically and clinically feasible to perform disorders (including stroke), Murtagh et al. [38]. emergency MRI to diagnose AIS. These results. highlight that diagnostic imaging technologies can improve or expedite diagnosis of disease,. could be extrapolated to other settings where diffusion-weighted imaging, perfusion MRI,. but do not necessarily change outcomes.. and/or MRI angiography are available, because if those conditions are not fulfilled the. Indeed, many factors can affect a patient’s outcome after imaging. The current study has some limitations. The small sample size may have made it difficult to detect some significant differences; however, a bootstrap analysis was performed to increase the power of the study. The method for assigning patients to the study groups depended on the time of onset of stroke, and it cannot be ruled out that this did not introduce a selection bias. Nonetheless, at admission, the groups were similar in neurological deficit, cardiovascular risk factors, and prior disability. The time horizon is important in economic. investment needed to purchase this technology would have to be included in the analysis. In addition to a suitable infrastructure, coordinated teamwork among the neurology, emergency, and radiology departments is extremely important. Without interdisciplinary teamwork in. the stroke. management at the authors’ hospital, it would have been impossible to carry out this study. These results may help guide hospital financial managers and clinicians. However, it is important to emphasize that the decision of which neuroimaging technique to apply must. evaluations. Here 90 days was used; this followup period is similar to other studies of the costs. always be made on an individual basis in function of the patient’s age, symptoms, time. and of managing stroke [8, 39, 40]. In this sense,. since onset of the event, and availability of the imaging techniques, among other factors. More. one study of the thrombolytic therapy. cost-effectiveness of with alteplase [41]. studies on the cost-effectiveness of new imaging. concluded that thrombolytic therapy based on MRI is not cost-effective in the short term;. studies will be needed when radiological findings, such as brain hemodynamics, volume. however, in the long term (at 3 years and. of the penumbra, size of the infarction, and.
(11) Neurol Ther (2015) 4:25–37. presence of vascular occlusion, are included in the treatment protocols of AIS.. CONCLUSION The three main findings obtained from this study that can be considered when deciding which imaging technique to use for the initial assessment in AIS are: (1) Health outcomes are. 35. Editors (ICMJE) criteria for authorship for this manuscript, take responsibility for the integrity of the work as a whole, and have given final approval for the version to be published. Conflict. to the use of CT or MRI are equivalent because the higher post-discharge costs in the MRI group is compensated by the lower direct cost of hospitalization and the need for MRI in some patients initially examined with CT; and (3) the cost-effectiveness analysis performed with the bootstrap method indicates that MRI was costeffective in a proportion of cases. Caution is warranted in interpreting these results. Although the cost information used was from 2004, and considering the modifications over time that this implies, it is important to bear in mind that the conclusions described will stay the same. Additionally, this study will allow the authors to verify their conclusions with a new prospective multicenter study on the management of MRI on patients with AIS in the future.. Compliance with ethics statement. The Hospital Doctor Josep Trueta’s (Girona, Spain) ethics committee approved the study. All procedures followed were in accordance with the ethical standards of committee on human. 2013. Informed consent was obtained from all patients for being included in the study. Open Access. This article is distributed under the terms of the Creative Commons Attribution Noncommercial License which permits any noncommercial use, distribution, and reproduction in any medium, provided the original author(s) and the source are credited.. REFERENCES 1.. Lozano R, Naghavi M, Foreman K, et al. Global and regional mortality from 235 causes of death for 20 age groups in 1990 and 2010: a systematic analysis for the Global Burden of Disease Study 2010. Lancet. 2012;380:2095–128.. 2.. Murray CJL, Vos T, Lozano R, et al. Disabilityadjusted life-years (DALYs) for 291 diseases and injuries in 21 regions, 1990–2010: a systematic analysis for the Global Burden of Disease Study 2010. Lancet. 2012;380:2197–223.. 3.. Pérez-Sempere A, Dı́az-Guzman J. Epidemiologı́a de las enfermedades vasculares cerebrales. In: Martı́Vilalta JL, editor. Enfermedades vasculares cerebrales. Barcelona: Prous Science, S.A.;2004. p. 599.. Scale. Also, Josefina Caminal for her given contributions and recommendations. This. the International Committee of Medical Journal. the responsible experimentation. (institutional and national) and with the Helsinki Declaration of 1964, as revised in. with patients to assess the modified Rankin. work was supported by Spanish Society of Medical Radiology. All named authors meet. Parody,. declare no conflict of interest.. ACKNOWLEDGMENTS We thank Jordi Pujiula and Montserrat Puigdemont for conducting the interviews. interest. Elizabeth. Salvador Pedraza, Marı́a del Mar Garcı́a, Carlos Crespo, Joaquı́n Serena, and Antoni Dávalos. equivalent whether CT or MRI is used, since therapeutic decision making is not based on neuroimaging results; (2) the direct costs related. of.
(12) Neurol Ther (2015) 4:25–37. 36. 4.. Taylor TN, Davis PH, Torner JC, Holmes J, Meyer JW, Jacobonson MF. Lifetime cost of stroke in the United States. Stroke. 1996;27:1459–66.. 5.. Jorgensen HS, Nakayama H, Raaschou HO, Olsen TO. Acute stroke care and rehabilitation: an analysis of the direct cost and its clinical and social determinants. The Copenhagen Stroke Study. Stroke. 1997;28:1138–41.. 6.. Carod-Artal FJ, Egido-Navarro JA, GonzálezGutiérrez JL, Varela E. Coste directo de la enfermedad cerebrovascular en el primer año de seguimiento. Rev Neurol. 1999;28:1123–30.. 7.. Marı́nez-Vila E, Irimia P, Urrestarazu E, Gallego J. EL coste del ictus. ANALES Sis San Navarra. 2000; 23(Supl 3):33–38.. 8.. Caro JJ, Huybrechts KF, Duchesne I, For the Stroke Economic Analysis Group. Management patterns and costs of acute ischemic stroke. An international study. Stroke. 2000;31:582–90.. 9.. Dewey HM, Thrift A, Mihalopoulos C, Carter R, Macdonell R, McNeil J. Cost of stroke in Australia from a societal perspective. Results from the North East Melbourne Stroke Incidence Study (NEMESIS). Stroke. 2001;32:2409–16.. 10. Spieler JF, Lanoe JL, Amarenco P. Socioeconomic aspects of postacute care for patients with brain infarction in France. Cerebrovasc Dis. 2002;13:132–41. 11. Beguirstain J, Mar J, Arrazola J. Coste de la enfermedad cerebrovascular aguda. Rev Neurol. 2005;40:406–11. 12. Álvarez-Sabı́n J, Molina C, Montaner J, et al. Beneficios clı́nicos de la implantación de un sistema de atención especializada y urgente del ictus. Med Clin (Barc). 2004;122:528–31. 13. Dávalos A, Álvarez Sabı́n J, Martı́-Vilalta JL, Castillo J. Tratamiento intravenoso con activador del plasminógeno tisular en la isquemia cerebral aguda. Med Clin (Barc). 2003;120:1–5. 14. Martinez-Vila E, Irimia P. The cost of stroke. Cerebrovasc Dis. 2004;17(Supl 1):124–9. 15. Wintermark M, Sanelli PC, Albers GW, et al. Imaging recommendations for acute stroke and transient ischemic attack patients: a joint statement by the American Society of Neuroradiology, the American College of Radiology and the Society of NeuroInterventional Surgery. J Am Coll Radiol. 2013;10:828–32. 16. Fiebach JB, Schellinger PD, Jansen O, et al. CT and diffusion-weighted MR imaging in randomized. order. Diffusion-weighted imaging results in higher accuracy and lower interrater variability in the diagnosis of hyperacute ischemic stroke. Stroke. 2002;33:2206–10. 17. Karonen JO, Vanninen RL, Liu Y, et al. Combined diffusion and perfusion MRI with correlation to single-photon emission CT in acute ischemic stroke, ischemic penumbra predicts infarct growth. Stroke. 1999;30:1583–90. 18. Rovira-Cañellas A. TC y RM en la fase aguda del ictus. In: Radiologı́a en patologı́a cardiovascular. Madrid: Marbón Libros SL; 2002. 19. Schellinger PD, Jansen O, Fiebach J, et al. Feasibility and practicality of MR imaging of stroke in the management of hyperacute cerebral ischemia. AJNR Am J Neuroradiol. 2000;21:1184–9. 20. Schellinger PD, Jansen O, Fiebach JB, Hacke W, Sartor K. Standarized MRI stroke protocol, comparison with CT in hyperacute intracerebral hemorrhage. Stroke. 1999;30:765–8. 21. Kidwell CS, Saver JL, Matiello J, et al. Diffusionperfusion MR evaluation of perihematomal injury in hyperacute intracerebral hemorrhage. Neurology. 2001;57:1611–7. 22. Kidwell CS, Chalela JA, Saver JL, Starkman S, Hill MD, Demchuk AM. Comparison of MRI and CT for detection of acute intracerebral hemorrhage. JAMA. 2004;292:1823–30. 23. Schellinger PD, Thomolla G, Fiehler J, et al. MRIbased and CT-based thrombolytic therapy in acute stroke within and beyond established time windows. An analysis of 1210 patients. Stroke. 2007;38:2640–5. 24. Köhrmann M, Schellinger PD. Acute stroke triage to intravenous thrombolysis and other therapies with advanced CT or MR imaging: pro MR imaging. Radiology. 2009;251:627–33. 25. Quinn TJ, Lees KR, Hardermark HG, Dawson J, Walters MR. Experience of a digital training resource for Modified Rankin Scale assessment in clinical trials. Stroke. 2007;38:2257–61. 26. Lees KR, Zivin JA, Ashwood T, Stroke-Acute Ischemic NXY Treatment (SAINT I) Trial Investigators, et al. NXY-059 for acute ischemic stroke. N Engl J Med. 2006;354:588–600. 27. Wilson JTL, Hareendran A, Grant M, et al. Improving the assesment of outcome in stroke. Use of a structured interview to assign grades on the modified Rankin scale. Stroke. 2002;33:2243–51..
(13) Neurol Ther (2015) 4:25–37. 28. Pinto-Prades J, Abellán-Perpiñán J. Measuring the health of populations: the veil of ignorance approach. Health Econ. 2005;14:69–82. 29. Fagan SC, Morgenstern LB, Petita A, et al. Costeffectiveness of tissue plasminogen activator for acute ischemic stroke. Neurology. 1998;50:883–90. 30. Drummond M, ÓBrien B, Stoddart G, Torrance G. Métodos para la evaluación económica de los programas de asistencia sanitaria. 2nd ed. Ediciones Dı́az de Santos S.A.; 2001. 31. Beinfeld MT, Gazelle GS. Diagnostic imaging costs: are they driving up the costs of hospital care? Radiology. 2005;235:934–9. 32. Jiménez M, Pedro-Cuesta J, Almazán J, Widén L. Stroke patients in South Madrid. Function and motor recovery, resource utilization, and family support. Stroke. 2000;31(1352):1359. 33. Arrazola A, Beguirstain JM, Garitano B, Mar J, Elizalde B. Atención hospitalaria a la enfermedad cerebrovascular aguda y situación de los pacientes a los 12 meses. Rev Neurol. 2005;40:326–30. 34. Diringer MN, Edwards DF, Mattson DT, et al. Predictors of acute hospital costs for treatment of ischemic stroke in an academic center. Stroke. 1999;30:724–8. 35. Yoneda Y, Uehara T, Yamasaki H, Kita Y, Tabuchi M, Mori E. Hospital-based study of the care and cost. 37. of acute ischemic 2003;34:718–24.. stroke. in. Japan.. Stroke.. 36. Chang KC, Tseng MC. Costs of acute stroke care of first-ever ischemic stroke in Taiwan. Stroke. 2003;34:219–21. 37. Earnshaw SR, Jackson D, Farkouh R, Schwamm L. Cost-effectiveness of patient selection using penumbral-based MRI for intravenous thrombolysis. Stroke. 2009;40:1710–20. 38. Murtagh J, Foerster V, Warburton RN, Lentle BC, Wood RJ, Mensinkai S, Husereau D. Clinical and cost effectiveness of CT and MRI for selected clinical disorders: results of two systematic reviews [Technology overview no 22]. Ottawa: Canadian Agency for Drugs and Technologies in Health; 2006. 39. Teng J, Mayo NE, Latimer E, et al. Costs and caregiver consequences of early supported discharge for stroke patients. Stroke. 2003;34:528–36. 40. Duncan PW, Jorgensen HS, Wade DT. Outcome measures in acute stroke trials. A systematic review and some recommendations to improve practice. Stroke. 2000;31:1429–45. 41. Ehlers L, Andersen G, Belfot Clausen L, Bech M, Kjølby M. Cost-effectiveness of intravenous thrombolysis with alteplase within a 3-hour window after acute ischemic stroke. Stroke. 2007;38:85–9..
(14)
Figure


Documento similar
Other pieces of anatomy research recently done 4 de- scribe this ligament as present in 100% of the subjects, with a coracoid process origin by two fascicles, a body,
Spectrum of lesions observed by computed tomography and magnetic resonance imaging scans in young athletes that participated in the 2018 Youth Olympic Games in Buenos
2D and 3D biometric parameters were mea- sured from slice-to-volume reconstructed images, including 3D measurements of supratentorial brain tissue, lateral ventricles,
The Dwellers in the Garden of Allah 109... The Dwellers in the Garden of Allah
The intra-reader reliability of bone related and soft-tissue results, the patterns of BML associated with tendon enthesopathy (ICC total = 0.79, range across the locations 0.44 to 1)
We used structural magnetic resonance imaging (MRI) to esti- mate global brain volumes and performed a voxel-based morphometry and lesion symptom mapping analysis in order to
Moreover, a recent magnetic resonance imaging study (Cover- dale et al. 2014) demonstrates a significant increase in middle cerebral artery diameter following acute
Analysis of Left Ventricular Volumes and Function: A Multicenter Comparison of Cardiac Magnetic Resonance Imaging, Cine Ventriculography, and Unenhanced and Contrast-Enhanced
