Advance Access publication 2018 March 7
Early-type galaxies in the Antlia cluster: catalogue and isophotal analysis
Juan P. Calder´on,
1,2,3‹Lilia P. Bassino,
1,2,3Sergio A. Cellone
1,3,4and Mat´ıas G´omez
5 1Consejo Nacional de Investigaciones Cient´ıficas y T´ecnicas, Rivadavia 1917, Buenos Aires, Argentina2Instituto de Astrof´ısica de La Plata (CCT La Plata - CONICET - UNLP), La Plata, Argentina
3Facultad de Ciencias Astron´omicas y Geof´ısicas, Universidad Nacional de La Plata, Paseo del Bosque, B1900FWA La Plata, Argentina 4Complejo Astron´omico El Leoncito (CONICET - UNLP - UNC - UNSJ), San Juan, Argentina
5Departamento de Ciencias F´ısicas, Facultad de Ciencias Exactas, Universidad Andres Bello, Santiago, Chile
Accepted 2018 February 26. Received 2018 February 26; in original form 2017 December 14
A B S T R A C T
We present a statistical isophotal analysis of 138 early-type galaxies in the Antlia cluster, located at a distance of∼35 Mpc. The observational material consists of CCD images of four 36×36 arcmin2fields obtained with the MOSAIC II camera at the Blanco 4-m telescope at Cerro Tololo Interamerican Observatory. Our present work supersedes previous Antlia studies in the sense that the covered area is four times larger, the limiting magnitude is
MB ∼ −9.6 mag, and the surface photometry parameters of each galaxy are derived from
S´ersic model fits extrapolated to infinity. In a companion previous study we focused on the scaling relations obtained by means of surface photometry, and now we present the data, on which the previous paper is based, the parameters of the isophotal fits as well as an isophotal analysis. For each galaxy, we derive isophotal shape parameters along the semimajor axis and search for correlations within different radial bins. Through extensive statistical tests, we also analyse the behaviour of these values against photometric and global parameters of the galaxies themselves. While some galaxies do display radial gradients in their ellipticity () and/or their Fourier coefficients, differences in mean values between adjacent regions are not statistically significant. Regarding Fourier coefficients, dwarf galaxies usually display gradients between all adjacent regions, while non-dwarfs tend to show this behaviour just between the two outermost regions. Globally, there is no obvious correlation between Fourier coefficients and luminosity for the whole magnitude range (−12MV −22); however,
dwarfs display much higher dispersions at all radii.
Key words: galaxies: clusters: general – galaxies: clusters: individual: Antlia – galaxies: dwarf – galaxies: elliptical and lenticular, cD – galaxies: fundamental parameters.
1 I N T R O D U C T I O N
Since the early work of S´ersic (1968), the study of the surface brightness profiles of elliptical galaxies (E) has reached a state in which peculiarities are more the rule than the exception. Even long-considered ‘canonical’ examples of purely elliptical shape like NGC 3379 (see e.g. Statler1994) are nowadays understood as prime focus for isophote twisting, large shells and arcs and complex struc-ture extending many effective radii; these evidence cast serious doubts on the existence of alleged pure E as a class.
Even for E galaxies with symmetrical isophotes, there is usu-ally extra light that distorts the profile (e.g. Malin & Carter1983; Schweizer & Seitzer1988; Seitzer & Schweizer1990; Barnes & Hernquist1992). Thus, in many cases, the isophotes of these
E-mail:[email protected]
ies deviate systematically from pure ellipses. Depending on the shape of those deviations, they are referred to as ‘discy’ or ‘boxy’ isophotes. Discy isophotes are the consequence of light excesses along the main axes (major and minor) with respect to a perfectly elliptical, while boxy isophotes are the consequence of deformations along directions at 45◦from the main axes. In fact, galaxies within these two types of isophote classifications present quite different characteristics, defining two ‘families’. Boxy early-type galaxies (ETGs) are usually luminous and massive, have significant radio and X-ray emission, have ‘core’ nuclear profiles and slow rotation; discy ETGs, in turn, tend to be fainter, have significant rotation, and no (or faint) X-ray or radio activity (Ferrarese et al.1994; van den Bosch et al.1994; Rest et al.2001; Lauer et al.2005).
The analysis of possible correlations between isophotal shapes and other parameters that characterize the isophotes, or the proper-ties of the galaxies themselves, has been the subject of many studies. Bender et al. (1989) and Nieto & Bender (1989), two seminal papers
on the subject, performed detailed studies of the shapes of isophotes of massive E galaxies, and concluded that there is no strong cor-relation with any photometric parameter like effective radius or surface brightness. More recently, Krajnovi´c et al. (2013) analysed the nuclear slope of 135 ETGs and found no evidence of bimodality regarding boxy or discy isophotes. Using the integral-field spec-troscopy obtained by the ATLAS3Dsurvey, Emsellem et al. (2011) also pointed out that thea4/aparameter, i.e. the Fourier coefficient that defines ‘disciness/boxiness’, is not directly related with any kinematic properties in their sample of 260 ETGs. However, galax-ies surrounded by X-ray haloes have generally irregular or boxy-type isophotes. Bender et al. (1989) found that boxy galaxies have higher mass–luminosity ratios (M/L∼11.5±0.9 M/L) than discy-type galaxies (M/L∼6.4±0.6 M/L). Regarding galaxy luminosity, the fainter galaxies tend to be discy, while those with higher luminosities tend to be boxy. These observed correlations mark the cause of the dichotomy between the isophote shapes and its relation with galaxy formation history (Bekki & Shioya1997). Also, there is growing evidence of a correlation between the age and the shape of galaxies, in the sense that core Es have older stellar pop-ulations than power-law ones (Ryden, Forbes & Terlevich2001). In addition, He, Hao & Xia (2014) investigated the relationships among isophotal shapes, galaxy brightness profile, and kinematic properties of a sample of ETGs from DSS Data Release 8 with kine-matic properties available from the ATLAS3Dsurvey. They found no clear relation between the S´ersic index and isophotal shape. In-stead, they found correlations between the Fourier coefficienta4/a, ellipticity, and specific angular momentumλre/2 for power-law galaxies, while no relation was found for core ETGs.
From the theoretical side, there have been many attempts to un-derstand the origin of discy and boxy Es. Naab, Khochfar & Burkert (2006, and references therein) used semi-analytical simulations to conclude that discy Es are mainly produced by non-equal mergers of two disc galaxies, while equal-mass mergers tend to produce boxy Es. In addition, Khochfar & Burkert (2005) concluded that the isophotal shapes of merger remnants also depend on the mor-phology of their progenitors and the subsequent gas infall.
Our present study focuses on the Antlia cluster, which is rec-ognized as the third nearest rich galaxy cluster, after Fornax and Virgo. Its galaxy population ranges in luminosity between−12 and −22 mag in theT1band, while no study of the relationship between their isophotes and global parameters has still been done. The first study of its galaxy content was performed by Ferguson & Sandage (1990), who constructed the photographic catalogue FS90. On the basis of CCD images, a deeper analysis of the ETGs located at the central zone of Antlia was performed (Smith Castelli et al.2008a,b,
2012). In the present work, we extend the studied region approxi-mately four times, determining total (not isophotal) magnitudes and colours. Structural parameters have also been obtained by means of S´ersic model fits. Half of the studied galaxies are included in the FS90 catalogue and the rest, mostly in the fainter regime, are new ones. The total sample amounts to 138 ETGs, 59 of them be-ing spectroscopically confirmed Antlia members. These data have already been used in a previous companion paper (Calder´on et al.
2015) to study the Antlia galaxies scaling relations.
This paper presents the catalogue of structural parameters of ETGs in the Antlia cluster and, on the basis of these data, an isopho-tal analysis of the galaxy sample is made. The paper is organized in the following way: in Section 2 we describe the imaging data reduction, while the galaxy sample selection is briefly presented in Section 3. Section 4 presents the computation of the geometrical parameters, while in Section 5 we describe the surface photometry
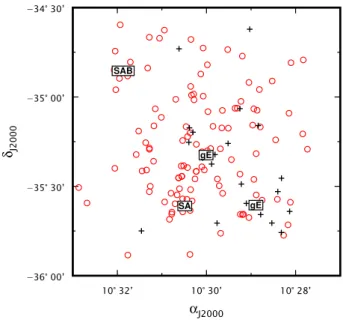
Figure 1. Projected distribution of all galaxies in the sample. The faintest galaxies in the sample (dE and dSph) are indicated with red circles, and the brightest ones with black crosses. Four of the most luminous galaxies in the cluster are labelled with their morphologies: NGC 3268 (‘gE’, at the centre of the figure), NGC 3258 (‘gE’, at south-west), NGC 3281 (‘SAB’), and NGC 3273 (‘SA’). North is up and east to the left.
method used to obtain each galaxy profile. Our results are presented in Section 6, and we discuss them in Section 7. The main conclu-sions are contained in Section 8. The full catalogue is available in electronic format.
2 DATA
The photometric data used in this paper are CCD images obtained with the MOSAIC II camera, mounted on the Victor Blanco 4-m telescope at the Cerro Tololo Interamerican Observatory (CTIO, Chile). We used the Kron–Cousins R and Washington C filters (Canterna1976). TheRfilter was chosen instead of the original WashingtonT1because of its better efficiency (Geisler1996), while just a small change of zero-point (R − T1 = 0.02) is needed to transform between them (Dirsch, Richtler & Bassino 2003). Each image covers 36 ×36 arcmin2, which corresponds to about 370×370 kpc2according to the adopted Antlia distance (Dirsch et al.2003,d=35 Mpc;m−M=32.73). The MOSAIC II camera had a resolution of 0.27 arcsec pixel−1and was constituted by eight CCDs. In order to erase the gaps between the CCDs, it is neces-sary to take a series of slightly shifted exposures (dithering) and then combine them. Fig.1 shows the projected spatial distribution of the four MOSAIC fields used in this work, in theRband. Red circles represent the faintest galaxies in the sample (dE and dSph), while black crosses indicate the brightest ones. We also added the location of the more luminous galaxies in the sample: NGC 3258, NGC 3268, NGC 3281, and NGC 3273. We have already described the images in Calder´on et al. (2015), as well as the calibration to the standard system and the resulting signal-to-noise ratio (S/N; see Section 5.3) of the brightness profiles, which is extremely relevant to low surface-brightness galaxies. As a consequence, we briefly highlight here the most important steps of images’ reduction, as they may be of interest.
The MOSAIC II images reduction was made using theMSCRED package withinIRAF, which has been written specially for data of
similar characteristics (Valdes1997). The first step consisted in run-ning the taskCCDPROCon all the images, in order to perform the basic calibration (overscan subtraction, trimming, bad pixel replacement, zero level subtraction, and flat-fielding). As we are using images with a large field of view (FOV), it is necessary to have an accu-rate celestial coordinate system. Then, to correct the astrometric solution we ran theMSCCMATCHtask, which uses a list of reference celestial coordinates of stars located in the field, to match against the same objects on the MOSAIC images. A polynomial relation between the observed positions and the reference coordinates is ob-tained. This relation may include a zero-point shift, a scale change, and axis rotation for both coordinate axes. Next, the fit was applied to the multi-extension images and, usingMSCIMAGE, it was possi-ble to get an output image in the correct WCS (World Coordinate System). If any residual large-scale gradients were present in the sky background of individual exposures, they were removed us-ingMSCSKYSUB. In the following step, we usedMSCIMATCHto match the intensity scales on the different images to be finally combined into the stacked image. Finally, for each filter and each field, the individual exposures were combined into a single deep one using MSCSTACK.
3 T H E G A L A X Y S A M P L E
Our galaxy sample comes from the four MOSAIC-II fields de-scribed in the previous section and is composed of 107 Antlia galaxies considered as ‘members’ and 77 new galaxies not cata-logued before (Calder´on et al.2015). The ‘member’ galaxies were those selected from the FS90 catalogue with membership status 1 (‘definite members’) plus those which have measured radial veloci-ties in the range of 1200–4200 km s−1(Smith Castelli et al.2008a). We can select galaxies with membership status 1 from FS90 as ‘members’ due to the reliability of FS90 morphological member-ship classification, already quantified in previous works (e.g. Smith Castelli et al.2012, and references therein). Out of the 77 new galax-ies, only 31 can be considered as ‘candidates’ because they satisfy the following criteria that ensure a reliable early-type morpholog-ical classification: they have smooth and continuous profiles with reasonable S/N out to the∼27.5 mag arcsec−2inRband, no obvious spiral structure present in the residuals of the fits, etc. These criteria are fully explained in Calder´on et al. (2015). In addition, a pho-tometric criterion was also considered, from the colour–magnitude relation (CMR) for the extended objects in the field: only new galax-ies located within±3σ of the CMR of the cluster members were selected. The CMR of ETGs in galaxy clusters is a well-defined, universal relation with very small scatter (e.g. Lisker, Grebel & Binggeli2008; Penny & Conselice2008; Jaff´e et al.2011; Mei et al.
2012).
Our sample is∼5 mag deeper than FS90, as the FS90 catalogue is complete toBT=18 mag, which corresponds toMB= −14.7 mag at our adopted Antlia distance, while here we reachMT1∼ −12 mag,
which corresponds to MB∼ −9.6 mag (Fukugita, Shimasaku & Ichikawa1995).
4 I S O P H OTA L A N A LY S I S A N D C O M P U TAT I O N O F G E O M E T R I C A L PA R A M E T E R S
We used theELLIPSE(Jedrzejewski1987) task within theISOPHOTE IRAF’s package to obtain the observed surface brightness profiles (surface brightness versus semimajor axisa). The semimajor axis was transformed into equivalent radius (r=√ab=a√1−, a
being the isophote semimajor axis andthe ellipticity) for all ETGs in the sample.
The initial values needed for the Fourier fitting, like the geometric centre, initial ellipticity, and position angle of the first trial ellipse, were estimated by visual inspection, for each galaxy in the sample. The intensityI(θ) along the trial ellipse is described by a Fourier series,
whereI0, is the mean isophotal intensity along the ellipse,Nis the highest harmonic fitted,θis the azimuthal angle measured from the major axis, andAnandBnwithn=1, 2, ... are the harmonic am-plitudes of the Fourier series. If the isophotes were perfect ellipses (which is not the case for real galaxies), the coefficients withn≤2 would be the only not null ones. The fit begins with the assumption that the first two orders (A1,A2,B1,B2) are non-zero. TheAnand
Bncoefficients provided byELLIPSEare normalized to the semima-jor axisaand corrected by the local intensity gradient. The output ellipse coefficientsBnare converted toan/ausing
an a =Bn
√
1−=Bnb/a. (2)
Once the parameters are obtained, the procedure continues with the calculation of the third and fourth harmonic coefficients through a least-squares fit. These coefficients (A3,A4,B3, andB4) determine the deviation of the isophote from a perfect ellipse. This procedure is repeated for the next semimajor axis, defined by the variableSTEP
inELLIPSE, until it reaches a pre-defined value of the semimajor axis. We used a linear step for each profile. The ellipticity and position angle are not well determined close to the centre due to seeing; this effect will be analysed in Section 5.2.
The geometrical parameters, such as ellipticity and Fourier coeffi-cients, vary along the galactocentric radius of the surface-brightness profile and, as a consequence, we cannot consider a single character-istic value as representative of the entire galaxy. In order to compare these parameters to other global galaxy properties, we choose to es-timate a weighted average value for each parameter along different ranges of effective radius (re). We divide each galaxy into four regions: region 1, between the seeing radius (1 arcsec) and 1.5re; region 2, from 1.5 to 3.0re; region 3, from 3.0 to 4.5re; and region 4, further than 4.5re. Following Chaware et al. (2014), we estimate each parameter within each region by means of expressions like the following:
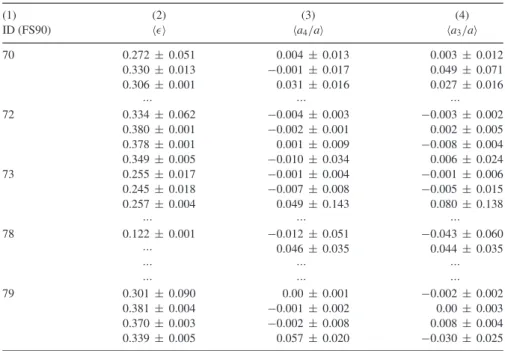
which represents the mean weighted value ofa4/ain region 1. That is, all the calculated average parameters are weighted by intensity (in counts) and inversely weighted by the corresponding variance. Note that there will be fewer parameters assigned to region 4 because the fitting of the model to the profile is not always reliable in the outer regions. Table1shows an example of the geometrical parameters computed for the galaxies in the sample.
5 S U R FAC E B R I G H T N E S S P R O F I L E S
Given the large number of galaxies in the sample, and the fact that the reduction procedure applied to obtain the surface-brightness profiles consists of several steps that can be automatized (i.e. trim the original image, estimate sky level around the galaxy, etc.), we
Table 1. Geometric parameters obtained for the galaxies in the sample. Columns: (1) ID from FS90, (2)–(4) mean values calculated by equation (3) for,a4/a , anda3/a on each radial range 1 to 4 (first to fourth line, when available). The full table is electronically available.
(1) (2) (3) (4)
developed anIRAFpipeline in order to obtain results in a homoge-neous way. In this section, we describe such procedure adopted to obtain the surface-brightness profiles.
The MOSAIC II images have 8800 pixel×8000 pixel. Although automatic detection software (e.g. SEXTRACTOR; Bertin & Arnouts
1996) can be carefully configured for faint sources identification, as we deal with early-type galaxies in a nearby cluster, we decided to carry on the galaxy detection just by visual inspection, which has been shown to be a very efficient method in such a case. We started by re-identifying the FS90 galaxies and then looked for new galaxies. After each galaxy detection, a subimage of about 500 pixels×500 pixels (135×135 arcsec2), centred on each object, was cut. Due to the large MOSAIC II field, we preferred to estimate the background (sky level) for each galaxy independently, instead of setting the same background level for the whole image. The adopted size of these subimages was large enough to make a good sky estimation. We first calculated an initial value of the sky level taking the ‘mode’ from several positions around the galaxy, free from other sources, using theIMEXAMINEtask. Then, we subtracted that constant intensity from the subimage and, due to the large-scale residual removal applied on the previous reduction process, we found that our method to estimate the sky was appropriate for the brightness level of the sample. Once the calibrated galaxy profile was obtained, we applied an iterative process to perform a second-order correction of the sky level, until the outer part of the integrated flux profile became as flat as possible for large galactocentric distances. Such corrections remained between± 10 ADU (i.e. less than 5 per cent of the mean sky level).
The last step before performing the fit of the model profile was to build a mask for each subimage to remove any objects that might have affected the brightness profile, like foreground stars and cos-metics. In this way, we obtained one mask for each subimage and each filter, using theBADPIXIMAGEtask. We also took into account objects hidden in the galaxy brightness, using different display lev-els. As a consequence, the final masks resulted more accurate than those generated directly by theELLIPSEtask.
Afterwards, we performed a first run of theELLIPSEtask, leaving all the geometric parameters ‘free’, just to obtain approximate values for the following initial geometric parameters:
(i)X0,Y0: coordinates of the initial isophote centre. (ii)PA0: initial position angle.
(iii)ELLIP0: initial ellipticity.
(iv)SMA0: initial semimajor axis length. (v)MAXSMA: maximum semimajor axis length.
For each galaxy, we defined a set of initial parameters in such a way to improve the stability of the isophotal fit. The minimum semimajor axis (MINSMA) was taken as small as possible to be able to fit the very central region of the galaxy. As the images were sky-subtracted, we defined the value ofMAXSMAas that for which the galaxy brightness approaches zero level. This procedure was applied on theRimages as they are deeper than theCones (Calder´on et al.
2015). TheR-band output table was later used as input toELLIPSEon theC-band images to perform the photometry.
If the image had defects that could complicate the fit, and/or the galaxy was so faint that the brightness profile was strongly dependent on the choice of the initial parameters, we kept one of them fixed to allow for a better solution with less degrees of freedom. These galaxies were mainly the faintest dwarf ellipticals (dE) or dwarf spheroidals (dSph). Fixing one or more parameters in the iteration does not modify the total magnitude of the galaxy although information on geometrical parameters may be lost.
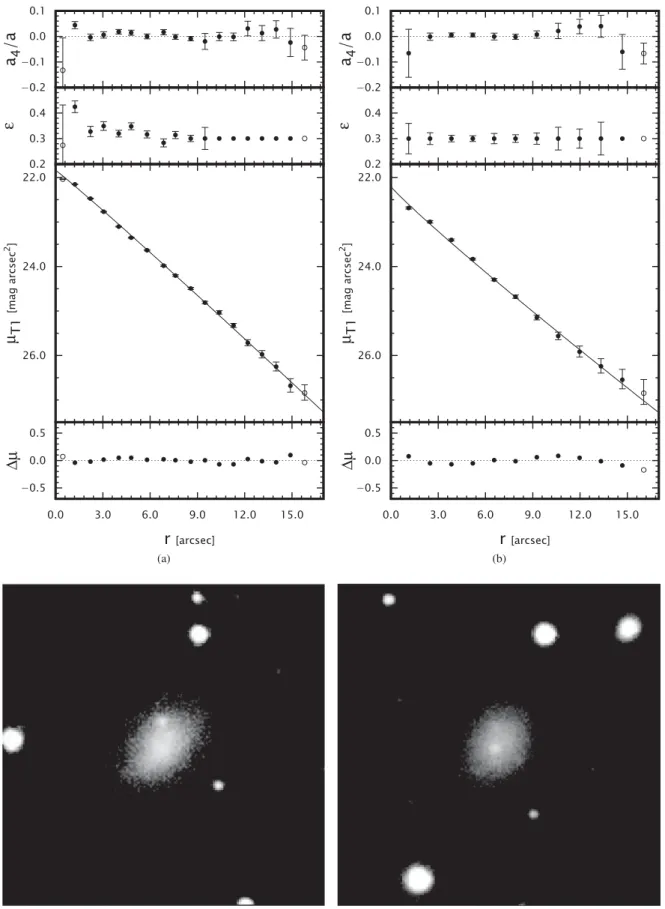
Fig.2shows examples of the galaxy brightness profiles of two galaxies in the sample (FS90 211 on the left and FS90 307 on the right). From top to bottom, the figure presents the run along r
of:a4/a,, surface brightnessμT1 (filled circles) along with the
fitted S´ersic model (continuous line), and the corresponding residual between model and observed profile. Finally, theT1-band image is shown.
Figure 2. Two examples of the profile fits on theT1-band images: FS90 211 (left) and FS90 307 (right). Parts (a) and (b) show (from top to bottom) the variation alongrofa4/a, ellipticity (), surface brightness (μT1), and the residual between the model and the observed profile. On each panel, we show with filled circles the data used in the fits and with open circles the discarded data, all of them with their respective error bars. Parts (c) and (d) showT1-band images of each galaxy (40×40 arcsec).
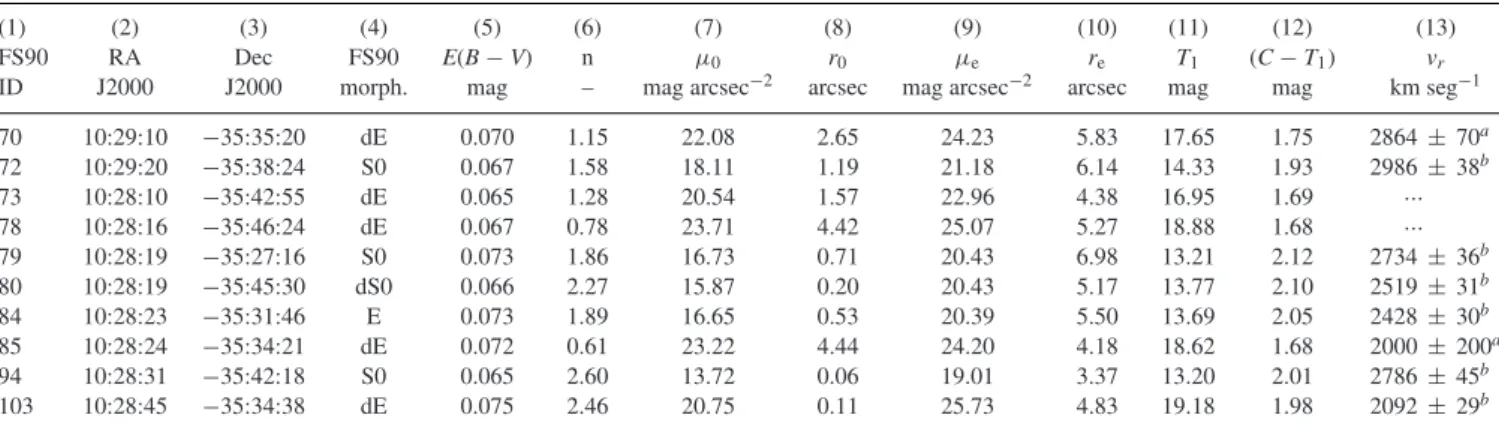
Table 2. Basic parameters of the Antlia galaxy sample: (1) ID from FS90, (2)–(3) J2000 coordinates, (4) morphology from FS90, (5) Galactic extinction from Schlafly & Finkbeiner (2011), (6)–(12) global properties calculated in this work (S´ersic index, central surface brightness, scale radius, effective surface brightness, effective radius,T1-band magnitude, (C−T1) colour), (13) radial velocity. The full table can be accessed electronically.
(1) (2) (3) (4) (5) (6) (7) (8) (9) (10) (11) (12) (13)
FS90 RA Dec FS90 E(B−V) n μ0 r0 μe re T1 (C−T1) vr
ID J2000 J2000 morph. mag – mag arcsec−2 arcsec mag arcsec−2 arcsec mag mag km seg−1
70 10:29:10 −35:35:20 dE 0.070 1.15 22.08 2.65 24.23 5.83 17.65 1.75 2864± 70a
72 10:29:20 −35:38:24 S0 0.067 1.58 18.11 1.19 21.18 6.14 14.33 1.93 2986± 38b
73 10:28:10 −35:42:55 dE 0.065 1.28 20.54 1.57 22.96 4.38 16.95 1.69 ···
78 10:28:16 −35:46:24 dE 0.067 0.78 23.71 4.42 25.07 5.27 18.88 1.68 ···
79 10:28:19 −35:27:16 S0 0.073 1.86 16.73 0.71 20.43 6.98 13.21 2.12 2734± 36b
80 10:28:19 −35:45:30 dS0 0.066 2.27 15.87 0.20 20.43 5.17 13.77 2.10 2519± 31b
84 10:28:23 −35:31:46 E 0.073 1.89 16.65 0.53 20.39 5.50 13.69 2.05 2428± 30b
85 10:28:24 −35:34:21 dE 0.072 0.61 23.22 4.44 24.20 4.18 18.62 1.68 2000± 200a
94 10:28:31 −35:42:18 S0 0.065 2.60 13.72 0.06 19.01 3.37 13.20 2.01 2786± 45b
103 10:28:45 −35:34:38 dE 0.075 2.46 20.75 0.11 25.73 4.83 19.18 1.98 2092± 29b
Notes. – Radial velocities are from:a=Smith Castelli et al. (2012),b=NED1,c=Caso & Richtler (2015).
1This research has made use of the NASA/IPAC Extragalactic Database (NED) which is operated by the Jet Propulsion Laboratory, California Institute of Technology, under contract with the National Aeronautics and Space Administration.
5.1 Numerical fits to the surface brightness profiles
To fit the brightness profiles, we used a uni-dimensional S´ersic model (S´ersic1968), which can be expressed as follows:
I(r)=Iee
while in magnitudes per square arcsec it is:
μ(r)=μe+1.0857bn
wherereis the effective radius,μeis the effective surface brightness, andnis the S´ersic index, which is a measure of the concentration of the profile. The constantbndepends on the shape parameternand is obtained numerically by solving the following equation (Ciotti
1991), (2n)
2 =γ(2n, bn), (6)
where(x) is the complete gamma function andγ(a, x) the in-complete gamma function. An alternative way to express the S´ersic model, in terms of intensity, is the following:
I(r)=I0e−
whereI0is the central surface brightness,r0is a scale parameter, andN=1/n. If we express the above equation in units of magnitude per square arcsec:
which is the one used for our profile fits, whereμ0is the central surface brightness. The transformation between effective radius and scale parameter can be obtained using equations 4 and 8:
I0e−
Consideringr=0, we obtain
I0=ebnIe (10)
and then,r0=b−nnre. (11)
The total flux is obtained by solving the integral:
FT= The integral magnitude is obtained by transforming the above equa-tion,
The fits were obtained using the taskNFIT1DfromIRAF, which implements theχ2statistic test through the Levenberg–Marquardt algorithm. We excluded the inner arcsec of the profile in the fits, in order to minimizeseeingeffects. We will show in the next sub-section that, in this way, the fits are not significantly affected by seeing for galaxies withn3. In most cases, we have been able to fit the profiles with a single S´ersic model obtaining residuals smaller than 0.5 mag. We want to remark that the scale parameters presented in this paper have been derived without trying a bulge–disc profile decomposition. Table2shows some of the scaling parameters and photometric magnitudes obtained for the sample.
5.2 Effects ofseeingon the modelled parameters
Ground-based images are affected by atmospheric seeing; for im-ages of extended objects it always acts distributing light from higher-to lower-surface brightness regions, thus mainly affecting the cen-tral portions of early-type galaxies profiles.
Instead of modelling out seeing effects on the fitted parameters (Trujillo et al.2001a,b), we performed a series of simple simu-lations of artificial galaxies following the procedure explained by Gavazzi et al. (2005). Using the taskMKOBJECTSfromIRAF ARTDATA package, we built a series of FITS images of simulated galaxies with S´ersic light profiles and null ellipticity. In addition, we fixed μ0in 10 mag arcsec−2, while the S´ersic index ranged between 0.5 and 4. Finally, we added to each simulated image a sky level and noise similar to those on the real images.
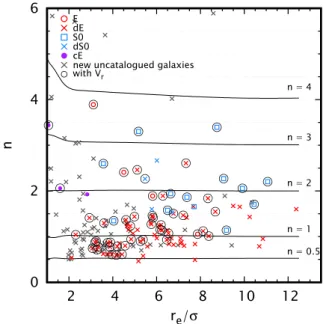
Figure 3. Measured S´ersic indexnversus effective radiusre(in units of the PSF dispersion). The solid lines show the results for artificial galaxies and the symbols for real ones.
To simulate the seeing effects, we performed a convolution using theGAUSStask, with Gaussian profiles andσ(σ=0.42466 FWHM) in the range of 0.5–10 arcsec. The S´ersic model was fitted to the simulated galaxies following exactly the same procedure as for the real galaxies, excluding the innermost arcsec from the profile.
Fig.3shows the results obtained for S´ersic indexnversusre/σ. The symbols indicate different galaxy morphologies and the lines correspond to different theoretical (model) S´ersic indices. It can be seen that for smallnvalues, the S´ersic indices measured from the convolved fake galaxies follow reasonably well their theoretical values; however, forn>3 there are significant differences for small
re/σ, in the sense that the measurednis overestimated. This result is in agreement with that obtained by Gavazzi et al. (2005), and it is due to light being distributed off the galaxy centre by seeing, thus leading to a measured S´ersic index that is higher than the intrinsic one. This effect is of course stronger for more concentrated (i.e.
n>3) profiles.
Given that there are very few real galaxies in the sample within the ranges ofnandrewhere the effect of seeing is significant, it was decided not to perform a general correction for seeing.
5.3 Signal-to-noise ratio
In order to estimate the quality of the profile fits and the param-eters obtained, we calculated how the S/N varies as a function of the equivalent radius of the profile using the following expression (McDonald et al.2011):
whereAisois the area of the given isophote in pixels2,
Aiso=2π
0.5(a2+b2), (17)
whereaandbare the semi-axes (major and minor) of the elliptic isophote, It(r) the total surface brightness of the galaxy, andIs the sky surface brightness. The S/N for the fainter galaxies in the
present sample (T1 >14 mag) at the isophote 27.5 mag arcsec−2 ranges between 1.6±0.3 and 3.0±1.0.
6 R E S U LT S
6.1 Comparison between isophotal and model-fit effective radii
The effective radius may be measured in different ways. In our case, we obtained it by fitting a single S´ersic model to the ob-served profile so thatreencloses half the luminosity of the model integrated to infinity (Calder´on et al.2015). Now, we want to com-pare these effective radii with the ones calculated directly from the isophotal parameters corresponding to∼27 mag arcsec−2in theT
1 band. Fig.4(a) shows the difference between therecalculated by Calder´on et al. (2015) performing an extrapolation to infinity and the ‘isophotal’ ones, versus absolute (top axis) and apparent (bottom axis)T1magnitudes. At the bottom of the same figure, we include a histogram that shows the number of galaxies considered in each magnitude bin, depicted on the right axis. The total galaxy sample is represented in green, candidate members in light grey, members in red, and members with measured radial velocity in black.
It is important to remark that for the two brightest galaxies (MT1<−22 mag), the effective radius results underestimated when
using a single component profile (for NGC 3268 the difference is even larger than 1 kpc). A similar (although milder) tendency is present for S0s and cEs. It can be seen that, as expected, the con-firmed dEs show mostly positive differences, while the new galaxies (mainly candidates) are the ones showing more negative differences. This effect is less noticeable if we consider a similar difference but for the effective surface brightness (Fig.4b). In this case, the con-firmed dEs are evenly distributed about zero.
6.2 Geometrical parameters at different galactocentric radii
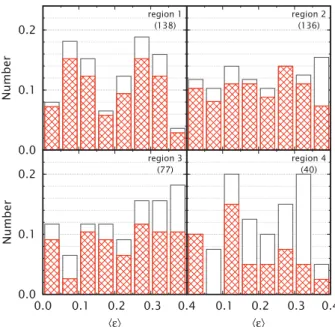
In this section, we analyse the geometrical parameters obtained from theELLIPSEoutput for the whole sample, considering the four radial ranges (regions 1 to 4) defined in Section 4. Fig.5shows the distribution of the intensity-weighted average ellipticity for the four regions, with a cross-hatched (red) histogram for faint galaxies (dEs and dSph) and an open one for the whole sample. We note that the morphological classification was done by visual inspection of each galaxy, following the criteria used in FS90. That is why we do not establish a magnitude limit (usually set aroundMB= −18 mag); an overlap in luminosity between bright and dwarf ellipticals can thus be seen.
The histograms of mean ellipticity show flatter (although slightly less extended) distributions, as compared to those obtained by Chaware et al. (2014) and Hao et al. (2006), where a main peak at ∼0.1→0.16 is evident in regions 1 to 4, implying a dom-inant fraction of nearly round galaxies. Besides a similar low peak, a second peak at ≈0.3 is also evident in region 1 of our sample. This reflects the fact that most of the brighter galaxies in Antlia are lenticulars (S0), while dwarfs also tend to exhibit rela-tively large flattenings, despite most of them being classified as dE (dS0s are found only among the brighter dwarfs.).
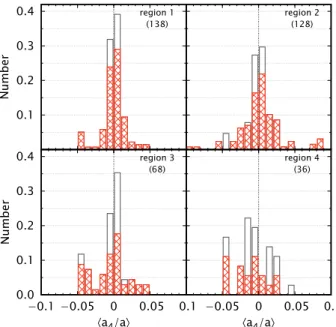
Figs6and7show the distributions of the weighted mean values of the Fourier coefficientsa3/a and a4/a . As usual, they are reasonably fitted with a single Gaussian centred at zero, except in the outermost region, where the distribution is much flatter. In particular, the coefficienta4/a is slightly positive in regions 1 through 3 for the dwarf galaxies, which indicates an excess of discy
Figure 4. Differences between structural parameters obtained from S´ersic fits and isophotal ones. (a) Difference betweenrecalculated by Calder´on et al. (2015) fitting a S´ersic model and the ‘isophotal’∼27 mag arcsec−2 ones, versus absolute and apparentT1magnitudes (top and bottom axes), respectively. (b) Same as plot (a) but for the difference in effective surface brightness.
isophotes. On the contrary, the brighter galaxies show an excess of negative values in region 2, pointing to boxy isophotes. Fig.6
shows, for the brighter galaxies, an excess of negative values of the a3/a coefficient in the innermost region; this can be related with minor mergers (Ryden et al.2001).
In order to assess the significance of any differences between the weighted-mean values along the equivalent radius, we perform a two-sample Kolmogorov–Smirnov (KS) test between adjacent re-gions (Press et al.1992), considering the whole sample. Regarding the mean ellipticity (Fig.8), the KS test shows that adjacent regions may share the same distribution (see Table3). The two-peaked dis-tribution for region 1, although visually evident in Fig.5, is thus
Figure 5. Histograms of the mean weighted ellipticity distributions, cross-hatched in red for dE and dSph and open for the whole sample. Number of galaxies in each region is indicated in parentheses.
Figure 6. Same as Fig.5but for thea3/a parameter distributions.
not significantly different (at a 5 per cent significance level) from the distributions in the other regions. With this in mind, we plot separately with red circles the fainter galaxies of the sample and with back squares the brighter sample, to compare their respective behaviours. While dwarfs seem to be mostly responsible for the disappearance of the ≈0.1 peak when going from region 1 to region 2, brighter galaxies play this role for the ≈0.3 peak. A qualitative analysis of Fig.8, then, shows that dwarfs on the low- peak in region 1 have been shifted to both higher and lower ellip-ticities in region 2, while bright galaxies on the high-peak have been mostly shifted to still higher ellipticities. This means that some of the brighter galaxies display positive ellipticity gradients (con-sistent with a S0 morphology), while dwarf galaxies may display either positive or negative gradients.
Figure 7. Same as Fig.5but for thea4/a parameter distributions.
Figure 8. Comparison of values between adjacent regions. The open circle at the lower right corner shows the median error bars for each panel.
Table 3. Results from the two-sample KS test (D) for the mean ellipticity. The probability to support the hypothesis that the compared distributions are taken from the same parent distribution is given byP.
Region 2 Region 3 Region 4
D P D P D P
Region 1 0.125 0.222 0.166 0.118 0.130 0.634
Region 2 0.108 0.579 0.120 0.732
Region 3 0.148 0.570
6.3 Relations betweena4/aand, S´ersic index and luminosity
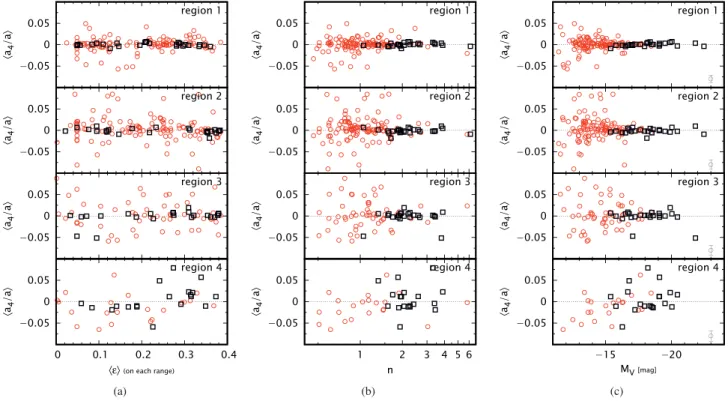
Fig.9(a) shows the relation betweena4/a and ellipticity (on each region). As already shown in Fig.7, we see that thea4/a distri-butions get broader for larger radii (regions 1 to 4), with a slight excess of positivea4/a values in the first two regions, indicating a dominance of discy isophotes. These features are evident along the full range of ellipticities, so there is no trend ofa4/a with . Fig.9(b) shows no clear correlation betweena4/a and S´ersic index. There is a group of galaxies with negativea4/a and lown in region 1, but the tendency is washed out in the outermost regions. Finally, Fig.9(c) clearly shows that the dispersion in thea4/a distribution increases with decreasing galaxy luminosity, with an important increment for galaxies withMT1>−16 mag. The
ten-dency in region 1 is not clear; however, in regions 2 and 3 there are more galaxies (particularly dwarfs) with discy isophotes. As in the other plots, the scatter of the relation increases rapidly as we go through region 1 to region 4. These plots are in agreement with Chaware et al. (2014), extending the range of surface brightnesses at the faint end.
We applied Spearman’s rank correlation (ρ) test (Spearman
1904), which is used to decide whether a pair of variables are correlated or not, to the data of Fig. 9. Its advantages over the Pearson correlation test are that it is non-parametric, and a linear relationship between the variables is not a requirement. When we consider the complete sample, the test results in small values for the a4/a–nrelation in regions 1 and 4, which implies a high correla-tion probability between both variables. The Spearman coefficients areρ=0.09 andρ=0.17, respectively, which lead to probabilities
p=0.24 andp=0.28 that the null hypothesis (i.e. no correlation) is true. Almost the same happens if we just consider the dE and dSph galaxies. For the relationa4/a versus the picture is similar, al-though just considering regions 2 and 4. The correlation coefficient values given by the test are:ρ = −0.2 for region 2, andρ =0.4 for region 4; the probability of the null hypothesis (no correlation) being true isp=0.01 for both regions.
7 D I S C U S S I O N
The study of the distributions of isophotal parameters in different ranges along the radial profiles of the galaxies is used as a tool to look for statistical differences between inner and outer parts of the galaxies, and their possible correlations with global galaxy properties. In this section, we compare our results with numerical simulations that involve galaxy mergers that took place out of any deep gravitational potential, such as a cluster. Thus, it should be taken into account that repeated tidal interactions may further af-fect the structural properties of cluster galaxies. Also, the merges themselves can be modified by the cluster potential well.
The ellipticity distribution (Fig.5) in our sample shows a main peak around ∼0.28, and a second peak around ∼0.08; this makes the galaxies in the Antlia cluster more flattened in compari-son to the samples presented in Chaware et al. (2014) and Hao et al. (2006). These differences may be explained by the distinctive char-acteristics of the galaxy sample, the Antlia one being dominated by lenticular galaxies. The shapes of the ellipticity histograms in re-gions 1 and 4 are similar, showing two peaks around the same mean ellipticities. This still holds when we consider the full range of radii. The dEs, which are shown in red, follow the same trend as all the other morphologies; this is true for all regions, except for region 4, which shows a large fraction of rounder dEs. This behaviour is also
Figure 9. Relation betweena4/a and (a), (b)n, and (c) luminosity. Each panel, on each figure, represents regions 1 to 4, from top to bottom. We identify dE and dSph galaxies of the sample with red circles and the brighter ones with black squares. The error bars on the last figure are as in Fig.8.
found in hydrodynamic simulations (Tenneti et al.2015). The KS test, however, shows no statistical differences between the elliptic-ity distributions for the inner and outer regions of the galaxies in the sample (Table3), so the above mentioned differences should be regarded as marginal.
The deviations from perfect ellipses, measured by the Fourier co-efficients, have been studied since Lauer (1985). However, several issues are pending and a new discussion is still relevant. Thea4 coefficient is an intrinsic parameter of the galaxy, without (projec-tion) dependence on the viewing angle. Khochfar & Burkert (2005) usedN-body simulations to predict that the percentage of discy-boxy galaxies is affected by the environment, so that in overdense regions, galaxies with more discy shape isophotes are produced (see also Pasquali et al.2006).
The separation in radial bins ofa4/a shows that, for our sam-ple, the distributions of the two innermost regions are similar to each other, and the KS test does not reveal any statistical difference between them. The percentage of discy isophotes is larger in all regions, except in region 4. There appears not to be a strong corre-lation betweena4/a and ellipticity, in agreement with Hao et al. (2006) and Chaware et al. (2014). The peculiar distribution ofa4/a in region 4 may be the result of the intrinsic merger history of the cluster.N-body simulations by Bournaud, Jog & Combes (2005), which take into account mergers of galaxies with different mass ratios (outside a cluster gravitational potential), produce galaxies with boxy isophotes in the inner part of the profile and discy ones in the outer part (i.e. positive radial gradients ina4/a). Considering the sample studied in this work, the profiles do not clearly show this behaviour, with half of them showing negative gradients for the meana4/a . The Antlia sample has a mild predominance of galax-ies witha4/a >0 in the innermost regions: 55 per cent for region 1, 54 per cent for region 2 (most are in the range of 0.0−0.02). This was pointed out by Naab & Burkert (2003) as the result of
binary disc galaxy mergers, from collisionlessN-body simulations. The larger values ofa4/a may be related with hybrid mergers with very different mass ratios (Bournaud et al.2005).
As pointed out by Calder´on et al. (2015), the CMR of the sample shows a ‘break’ at the bright end so that the most massive ETGs show almost constant colours. One possible interpretation is that this is a consequence of dry mergers – both minor and major – since
z∼2. Then, the more massive galaxies would evolve without gas and no further enrichment is expected (Jim´enez et al.2011). The analysis of geometrical parameters may show evidence of different possible scenarios. The largest galaxies in the sample have regular isophotes (a4/a ∼0) and the ellipticities show a wide distribu-tion along the range: 0.0–0.4, while dEs have large deviadistribu-tions from perfect isophotes. Numerical simulations of multiple mergers pre-sented by Bournaud, Jog & Combes (2007) show that the merger remnants tend to be boxy for 1:1 mergers (see also Naab & Burkert
2003; Naab & Trujillo2006, for dissipationless simulations), while larger mass ratio (like 3:1 and 4:1) mergers result in discy-shape ellipticals. Pasquali et al. (2006, and references therein) found that discy galaxies have higher ellipticities in the sample that they stud-ied. On the other hand, boxy galaxies have larger half-light radii, and tend to be bigger and brighter than discy galaxies. Chaware et al. (2014) and He et al. (2014) (also reported by Ferrarese et al.2006) found that their sample shows a trend betweena4/aand absolute magnitude in theiband, which could be considered similar to the boxiness trend found by Bournaud et al. (2007) for the remnants of multiple minor mergers, with boxiness increasing with mass ratio. In particular, we could not confirm any relation betweena4/a and magnitude in our sample. In any case, it is clear that early-type dwarfs display a broad range ina4/a at all radii, from fairly discy to boxy shapes. This could be due to dwarfs being more strongly affected by interactions, and/or to a mixture of objects with different origins/histories among low-luminosity systems.
The relations between the S´ersic indexnand a4/a, a3/a and have been studied by different authors on different magnitude ranges (Hao et al.2006; He et al.2014), who found only a mild correlation amongn,, anda4/a. We found a correlation between these parameters just for the innermost radial range; this behaviour still holds when we only consider the faintest galaxies in the sample. We also point out that the relatively broad ranges spanned by the values of the Fourier parameters of dEs cannot be explained just by the larger errors present in the relations depicted in Fig.9. Thus, it may be an intrinsic characteristic for the fainter galaxies, which has been shown to include several structural sub-classes pointing to different origins (Cellone & Buzzoni2005; Lisker et al.2007, and references therein).
8 S U M M A RY
We present the isophotal analysis as well as the surface photometry data (catalogue) for a sample of 138 early-type galaxies in the Antlia cluster. The scaling relations followed by them have been described in a previous companion paper (Calder´on et al.2015). Our study is based on MOSAIC II–CTIO images of four adjoining and slightly superimposed fields, covering each one 36×36 arcmin2, and taken with the Kron–CousinsRand WashingtonCfilters.
We have used ELLIPSE withinIRAF to obtain the geometrical parameters that characterize the isophotes of each galaxy along its radius. Then, we obtained mean values of ellipticity and Fourier coefficientsa3anda4in four radial bins, weighted by the intensity of each isophote. Total integrated magnitudes were obtained by fitting single S´ersic models to the observed surface brightness profiles. In addition to presenting the surface-photometry catalogue, our main goal was to find possible correlations among global properties. We also looked for statistical differences between the isophotal shapes in the inner and outer regions of the profiles, since it is supposed that physical processes ruling the evolution of galaxies affect both regions differently (Chaware et al.2014, and references therein). Most of the galaxies in our sample have discy isophotes, but they tend to change along radius, turning into boxy. The processes involved in the evolution of the galaxies are presumably different: while in the inner part they must be driven by internal ones, the outer regions are more sensitive to the environment (ram-pressure stripping, galaxy harassment, etc.) as suggested by Kormendy & Bender (2012).
AC K N OW L E D G E M E N T S
We thank an anonymous referee for constructive remarks. This work was funded by grants from Consejo Nacional de Investiga-ciones Cient´ıficas y T´ecnicas de la Rep´ublica Argentina, Agencia Nacional de Promoci´on Cient´ıfica y Tecnol´ogica, and Universidad Nacional de La Plata (Argentina). JPC and LPB are grateful to the Departamento de Astronom´ıa de la Universidad de Concepci´on (Chile) for financial support and warm hospitality during part of this research. MG acknowledges support from FONDECYT Regu-lar Grant No. 1170121. LPB and MG: Visiting astronomers, Cerro Tololo Inter-American Observatory, National Optical Astronomy Observatories, which are operated by the Association of Universi-ties for Research in Astronomy, under contract with the National Science Foundation.
R E F E R E N C E S
Barnes J. E., Hernquist L., 1992,ARA&A, 30, 705 Bekki K., Shioya Y., 1997,ApJ, 478, L17
Bender R., Surma P., Doebereiner S., Moellenhoff C., Madejsky R., 1989, A&A, 217, 35
Bertin E., Arnouts S., 1996, A&AS, 117, 393 Bournaud F., Jog C. J., Combes F., 2005,A&A, 437, 69 Bournaud F., Jog C. J., Combes F., 2007,A&A, 476, 1179
Calder´on J. P., Bassino L. P., Cellone S. A., Richtler T., Caso J. P., G´omez M., 2015,MNRAS, 451, 791
Canterna R., 1976,AJ, 81, 228
Caso J. P., Richtler T., 2015,A&A, 584, A125 Cellone S. A., Buzzoni A., 2005,MNRAS, 356, 41
Chaware L., Cannon R., Kembhavi A. K., Mahabal A., Pandey S. K., 2014, ApJ, 787, 102
Ciotti L., 1991, A&A, 249, 99
Dirsch B., Richtler T., Bassino L. P., 2003,A&A, 408, 929 Emsellem E. et al., 2011,MNRAS, 414, 888
Ferguson H. C., Sandage A., 1990,AJ, 100, 1
Ferrarese L., van den Bosch F. C., Ford H. C., Jaffe W., O’Connell R. W., 1994,AJ, 108, 1598
Ferrarese L. et al., 2006,ApJS, 164, 334
Fukugita M., Shimasaku K., Ichikawa T., 1995,PASP, 107, 945
Gavazzi G., Donati A., Cucciati O., Sabatini S., Boselli A., Davies J., Zibetti S., 2005,A&A, 430, 411
Geisler D., 1996,AJ, 111, 480
Hao C. N., Mao S., Deng Z. G., Xia X. Y., Wu H., 2006,MNRAS, 370, 1339
He Y.-Q., Hao C.-N., Xia X.-Y., 2014, Res. Astron. Astrophys., 14, 144
Jaff´e Y. L., Arag´on-Salamanca A., De Lucia G., Jablonka P., Rudnick G., Saglia R., Zaritsky D., 2011,MNRAS, 410, 280
Jedrzejewski R. I., 1987,MNRAS, 226, 747
Jim´enez N., Cora S. A., Bassino L. P., Tecce T. E., Smith Castelli A. V., 2011,MNRAS, 417, 785
Khochfar S., Burkert A., 2005,MNRAS, 359, 1379 Kormendy J., Bender R., 2012,ApJS, 198, 2 Krajnovi´c D. et al., 2013,MNRAS, 433, 2812 Lauer T. R., 1985,MNRAS, 216, 429 Lauer T. R. et al., 2005,AJ, 129, 2138
Lisker T., Grebel E. K., Binggeli B., Glatt K., 2007,ApJ, 660, 1186 Lisker T., Grebel E. K., Binggeli B., 2008,AJ, 135, 380
Malin D. F., Carter D., 1983,ApJ, 274, 534
McDonald M., Courteau S., Tully R. B., Roediger J., 2011,MNRAS, 414, 2055
Mei S. et al., 2012, Am. Astron. Soc. Meeting Abstr. 219, 411.06 Naab T., Burkert A., 2003,ApJ, 597, 893
Naab T., Trujillo I., 2006,MNRAS, 369, 625 Naab T., Khochfar S., Burkert A., 2006,ApJ, 636, L81 Nieto J.-L., Bender R., 1989, A&A, 215, 266 Pasquali A. et al., 2006,ApJ, 636, 115
Penny S. J., Conselice C. J., 2008,MNRAS, 383, 247
Press W. H., Teukolsky S. A., Vetterling W. T., Flannery B. P., 1992, Nu-merical recipes in C. The art of scientific computing. University Press, Cambridge
Rest A., van den Bosch F. C., Jaffe W., Tran H., Tsvetanov Z., Ford H. C., Davies J., Schafer J., 2001,AJ, 121, 2431
Ryden B. S., Forbes D. A., Terlevich A. I., 2001,MNRAS, 326, 1141 Schlafly E. F., Finkbeiner D. P., 2011,ApJ, 737, 103
Schweizer F., Seitzer P., 1988,ApJ, 328, 88
Seitzer P., Schweizer F., 1990, in Wielen R. ed., Dynamics and Interactions of Galaxies. Springer, Berlin, p. 270
S´ersic J. L., 1968, Atlas de galaxias australes. Observatorio Astronomico, Cordoba, Argentina
Smith Castelli A. V., Bassino L. P., Richtler T., Cellone S. A., Aruta C., Infante L., 2008a,MNRAS, 386, 2311
Smith Castelli A. V., Faifer F. R., Richtler T., Bassino L. P., 2008b,MNRAS, 391, 685
Smith Castelli A. V., Cellone S. A., Faifer F. R., Bassino L. P., Richtler T., Romero G. A., Calder´on J. P., Caso J. P., 2012,MNRAS, 419, 2472
Spearman C., 1904, Am. J. Psychol., 15, 88 Statler T. S., 1994,AJ, 108, 111
Tenneti A., Mandelbaum R., Di Matteo T., Kiessling A., Khandai N., 2015, MNRAS, 453, 469
Trujillo I., Aguerri J. A. L., Cepa J., Guti´errez C. M., 2001a,MNRAS, 321, 269
Trujillo I., Aguerri J. A. L., Cepa J., Guti´errez C. M., 2001b,MNRAS, 328, 977
Valdes F., 1997, in Hunt G., Payne H., eds, IRAF data reduction software for the NOAO mosaic. ASP Conf. Ser. Vol. 125, Astronomical Data Analysis Software and Systems VI. Astron. Soc. Pac., San Francisco, p. 455
van den Bosch F. C., Ferrarese L., Jaffe W., Ford H. C., O’Connell R. W., 1994,AJ, 108, 1579
S U P P O RT I N G I N F O R M AT I O N
Supplementary data are available atMNRASonline.
profiles.pdf
geometric-parameters.dat full-catalogue.dat
Please note: Oxford University Press is not responsible for the content or functionality of any supporting materials supplied by the authors. Any queries (other than missing material) should be directed to the corresponding author for the article.
This paper has been typeset from a TEX/LATEX file prepared by the author.