1
Adaptation and Validation of Quick, Easy, New, Cheap, and
2
Reproducible (QUENCHER) Antioxidant Capacity Assays in Model
3
Products Obtained from Residual Wine Pomace
4
Raquel Del Pino-Garc
í
a, Javier Garc
í
a-Lomillo, Mar
í
a D. Rivero-Pe
rez, Mar
́
í
a L. Gonza
lez-SanJose
́
,
́
5and Pilar Mun
̃
iz
*
6Department of Food Biotechnology and Science, Faculty of Sciences, University of Burgos, Plaza Misael Bañuelos, 09001 Burgos, 7 Spain
8
*
S Supporting Information9 ABSTRACT: Evaluation of the total antioxidant capacity of solid matrices without extraction steps is a very interesting 10 alternative for food researchers and also for food industries. These methodologies have been denominated by QUENCHER from 11 quick, easy, new, cheap, and reproducible assays. To demonstrate and highlight the validity of QUENCHER (Q) methods, values 12 of Q-method validation were showed for the first time, and they were tested with products of well-known different chemical 13 properties. Furthermore, new QUENCHER assays to measure scavenging capacity against superoxide, hydroxyl, and lipid peroxyl 14 radicals were developed. Calibration models showed good linearity (R2> 0.995), proportionality and precision (CV < 6.5%), and 15 acceptable detection limits (<20.4 nmol Trolox equiv). The presence of ethanol in the reaction medium gave antioxidant capacity 16 values significantly different from those obtained with water. The dilution of samples with powdered cellulose was discouraged 17 because possible interferences with some of the matrices analyzed may take place.
18 KEYWORDS: antioxidant activities, ABTS, Folin−Ciocalteu, free radical scavenging assays, cellulose
19
■
INTRODUCTION20Natural antioxidants are increasingly demanded by the food 21industry to prevent oxidative degradation reactions while 22satisfying consumers’demands. Furthermore, there is growing 23interest in knowing the antioxidant value of foods, food 24supplements, and diets. Therefore, in recent decades, several in 25vitro and in vivo assays have been developed to determine the 26total antioxidant capacity (TAC) of foods and biological 27samples.1−3 It is generally recognized that effects of food 28materials on the redox balance in vivo cannot be merely 29extrapolated from their activities in vitro, with the possible 30exception of their antioxidant action in the gastrointestinal 31tract.2,4However, the determination of the in vitro TAC can be 32achieved by simple and relatively fast chemical methodologies 33and may give more relevant information than that obtained 34from measuring each antioxidant compound separately, as 35possible synergistic interactions may not be considered.4 36Therefore, these methods have been largely used to estimate 37and compare the antioxidant capacity of food items.5,6Because 38most natural antioxidants are multifunctional, a reliable 39antioxidant protocol requires the measurement of more than 40one property relevant to either foods or biological systems.7,8 41 The most commonly applied in vitro TAC methodologies 42are based on diverse strategies to evaluate (1) the reducing 43ability of antioxidants, such as the Folin−Ciocalteu (FC) and 44ferric reducing/antioxidant power (FRAP) assays; (2) the 45scavenging of stable free radicals by antioxidants, including the 462,2′-azinobis(3-ethylbenzothiazoline-6-sulfonic acid) (ABTS) 47and 2,2-diphenyl-1-picrylhydrazyl (DPPH) assays; and (3) 48the scavenging of short-lived radicals by competition 49mechanisms, such as peroxyl radicals in the oxygen radical
50 absorbance capacity (ORAC) assay. Other less widely used
51 methods assess the free radical scavenging capacity (FRSC) of
52 antioxidants using radicals that are responsible for the oxidative
53 stress damage observed in vivo, such as the superoxide,
54 hydroxyl, and lipid peroxyl radicals. The respective FRSC
55 methods have been named the superoxide radical scavenger
56 capacity (SRSC), hydroxyl radical scavenger capacity (HRSC),
57 and lipid peroxyl scavenger capacity (LPSC) assays.
58 Most of the TAC and FRSC determinations in foods and
59 antioxidant products have been limited to their soluble
60 compounds, and the extraction procedure has been considered
61 a critical step.9,10This reason motivated the development of the
62 quick, easy, new, cheap, and reproducible (QUENCHER)
63 assays to measure the antioxidant activity of food materials.11
64 These methods are a very interesting approach that avoids
65 time-consuming solvent extraction steps of the classical
66 protocols. The basis of QUENCHER (Q-) protocols is to
67 place in direct contact the solid powdered food materials and
68 the reagent solutions. Thus, the soluble antioxidants of the
69 sample quench the radicals present in the reaction medium
70 according to usual liquid−liquid reactions, whereas the
71 antioxidants bound to the insoluble particle matter exert their
72 antioxidant activity by taking advantage of surface reactions
73 occurring at the solid−liquid interface.11
74 Several of the frequently used TAC methodologies (ABTS,
75 DPPH, ORAC, FRAP, and FC) have recently been adapted to
Received: December 1, 2014 Revised: June 23, 2015 Accepted: July 17, 2015
Article
pubs.acs.org/JAFC
© XXXX American Chemical Society A DOI: 10.1021/acs.jafc.5b01644
76the QUENCHER approach.12−15Up to now, these assays have 77been successfully applied to some foods for which the 78antioxidant activity is largely dependent on the insoluble part, 79such as cereals and bakery products, seeds, nuts, pulses, and 80dietary fibers.12−19 It must also be noted that a mixture of 81ethanol/water (50:50, v/v) has been suggested as the most 82appropriate reaction medium to carry out QUENCHER assays, 83and “neutral” powdered materials such as cellulose have been 84proposed as suitable diluting agents when products under study 85are very rich in antioxidants.11,12
86 Despite the advantages and previous applications of the 87QUENCHER methods, these assays are not yet extensively 88used, probably due to a lack of validation studies of these 89methodologies. In addition, to the best of our knowledge, the 90QUENCHER concept has still not been adapted to the 91methodologies that target biologically relevant radicals (SRSC, 92HRSC, and LPSC), and a statistical validation and correlations 93between the different Q-TAC and Q-FRSC assays have not yet 94been performed. These verifications are important to encourage 95the applicability of QUENCHER protocols as valuable tools for 96the in vitro antioxidant capacity assessment of different 97products such as foods, food ingredients, and others.
98 Therefore, to increase the use of the QUENCHER approach, 99the first aim of the present study was to develop new 100QUENCHER protocols to evaluate the scavenger capacity of 101some of the most biologically relevant radicals (superoxide, 102hydroxyl, and lipid peroxyl); the second aim was to optimize 103and, for the first time, validate different QUENCHER assays 104(FC, FRAP, ABTS, DPPH, ORAC, SRSC, Q-105HRSC, and Q-LPSC) using three model products of different 106chemical properties. Secondarily, the best combination of 107QUENCHER assays for routine analysis was identified, and 108several factors that might influence the Q-TAC results, such as 109the presence of ethanol in the reaction medium and the use of 110cellulose as a diluting agent, were assessed. The study was 111carried out with three powdered model products, all of them 112rich in antioxidant compounds, but each containing anti-113oxidants of different polarity. Powdered products were made in 114our pilot plant from wine pomace so that we could work with 115familiar products for which characteristics and composition 116were well-known.
117
■
MATERIALS AND METHODS118 Chemicals. ABTS, cellulose, DPPH, deoxyribose (2-deoxy-D -119ribose), 2,2′-diazobis(2-aminodinopropane) dihydrochloride 120(AAPH), gallic acid (GA), 6-hydroxyl-2,5,7,8-tetramethyl-2-carboxylic 121acid (Trolox), 4-nitroblue tetrazolium chloride (NBT), phenazin 122methosulfate (PMS), 2,4,6-tris(2-pyridyl)-S-triazine (TPTZ), and 2-123thiobarbituric acid (TBA) were obtained from Sigma-Aldrich Co (St. 124Louis, MO, USA). Ethylenediaminetetraacetic acid (EDTA), iron(III) 125chloride acid (FeCl3), iron(II) sulfate (FeSO4), FC reagent, hydrogen
126peroxide (H2O2), L-ascorbic acid (C6H8O6), potassium persulfate
127(K2O8S2), sodium acetate (NaC2H3O2), sodium carbonate (Na2CO3),
128sodium pyrophosphate anhydrous (Na4P2O7), and trichloroacetic acid
129(TCA) were purchased from Panreac (Barcelona, Spain).
130 Samples. Red wine pomace was kindly supplied by different 131wineries located at Burgos (Spain). All red wine pomace was mixed 132and dehydrated until reaching afinal water content of <10%. Dried 133materials were separated, ground, and sieved, thus obtaining three 134different powdered products,20 which were used as model matrices. 135One of them was derived from grape seeds (Sd) separated from the 136wine pomace; this model product represented foods with a significant 137content of fat and rich mainly in hydrophobic antioxidants. Another 138product was obtained from the wine pomace free of seeds, which was 139mainly constituted by grape skins (Sk); this model product
140 represented food matrices rich in hydrophilic antioxidant and without
141 or with very low levels of fat. The third powdered product was
142 obtained from whole (W) wine pomace; this model product
143 represented food materials with some fat and rich in both hydrophilic
144 and hydrophobic antioxidants. The particle size of these model
145 products was <0.250 mm in the cases of Sk and W and <0.355 mm for
146 Sd.21
147
QUENCHER Antioxidant Capacity Methods.The adapted Q-148 TAC and Q-FRSC methodologies were fixed end-point procedures
149 with the exception of the Q-ORAC method, which was a kinetic assay.
150 Results are given as mean values ± standard deviation of three
151 independent samples.
152
Q-FC Assay. This method was adapted from the FC assay 153 developed by Singleton and Rossi.22 Briefly, 1 ± 0.005 mg of the
154 tested products was weighed in a microbalance (MicroPro11,
155 Sartorius) and mixed with 0.2 mL of Milli-Q (MQ) water and 0.2
156 mL of FC reagent. After 5 min of reaction, 4 mL of a 0.7 M Na2CO3
157 solution was added, and thefinal volume was made up to 10 mL with
158 MQ water. After 1 h of incubation in an orbital shaker, the absorbance
159 at 750 nm was measured using an UV−vis spectrophotometer
(U-160 2000 Hitachi). The FC index was expressed as micromoles of gallic
161 acid equivalents per gram of product (GAE/g) by means of a dose−
162 response curve for different quantities of the standard.
163
Q-FRAP Assay. The Q-FRAP procedure was adapted from the 164 method described by Benzie et al.23The reactive mixture was freshly
165 prepared by mixing 10 mM TPTZ and 20 mM FeCl3 in 300 mM
166 NaC2H3O2buffer (pH 3.6) at a ratio of 1:1:10 (v/v/v) and diluted
167 10:1 (v/v) in MQ water. Ten milliliters of the FRAP solution was
168 added to 1±0.005 mg of the samples and incubated at 37°C for 30
169 min with continuous stirring. The absorbance at 593 nm was
170 measured. The results were expressed as micromoles of iron(II)
171 equivalents per gram of product (Fe(II)E/g) using linear calibration
172 obtained with different amounts of FeSO4.
173
Q-ABTS Assay.The method was adapted from the assay developed 174 by Re et al.24and modified by Rivero-Perez et al.́ 25The stock solution
175 of ABTS•+was diluted with MQ water to an absorbance of 0.70±0.02
176 at 734 nm; 1±0.005 mg of the assessed products was weighed, and
177 the reaction was started by adding 10 mL of ABTS•+working solution.
178 After 30 min of incubation in darkness with continuous stirring, the
179 absorbance of the samples at 734 nm was measured and subtracted
180 from the absorbance of the ABTS•+working solution. The results are
181 expressed as micromoles of Trolox equivalents per gram of product
182 (TE/g), using the dose−response curve described by different
183 amounts of this standard.
184
Q-DPPH Assay. This method is based on the scavenging of the 185 radical DPPH•.26 A 0.1 mM DPPH• working solution in pure
186 methanol was prepared and diluted until an absorbance at 517 nm of
187 0.70± 0.02.25 Then, 1 ±0.005 mg of the powdered products was
188 transferred into a test tube and mixed with 10 mL of DPPH•working
189 solution. The absorbance at 517 nm was measured after 30 min of
190 continuous stirring at room temperature in the samples and subtracted
191 from the absorbance of the DPPH•working solution. Trolox was used
192 as standard to perform a calibration curve, and the results were
193 expressed as micromoles of TE per gram of product.
194
Q-ORAC Assay.This assay was adapted from the method described 195 by Ou et al.27The analysis was conducted in a four-cellfluorometer
196 (Cary-Eclipse, Varian) with continuous stirring in the cuvette and at
197 37°C. Briefly, 0.2±0.005 mg of the assessed products was weighed
198 and resuspended in 0.8 mL of 75 mM phosphate buffer (pH 7.0,
199 warmed to 37 °C) just before use. A Trolox quality control (T10,
200 equivalent to 10 μg of Trolox) and a 300 mM AAPH solution in
201 phosphate buffer were also freshly prepared. At least one T10 and one
202 blank were analyzed with every set of samples (same AAPH solution).
203 In a glass cuvette, 0.4 mL of the samples (the resuspended products,
204 the T10 control or just phosphate buffer for the blank) was mixed with
205 2 mL of a freshly prepared 87.5 nMfluorescein solution in phosphate
206 buffer. Thefluorescence reading (λexc= 493 nm andλem= 511 nm)
207 was started, and 0.1 mL of the AAPH solution was added after 2.5 min.
208 The fluorescence decay curve was monitored for 100 min. The net
209 area under the curve (net AUC) was calculated for each sample by
DOI: 10.1021/acs.jafc.5b01644 J. Agric. Food Chem.XXXX, XXX, XXX−XXX
210subtracting the blank AUC from the sample AUC. Regression 211equations between net AUC and different quantities of Trolox were 212obtained and used for the expression of the Q-ORAC values as 213micromoles of TE per gram of product.
214 Q-SRSC Assay. The Q-SRSC procedure was adapted from the 215method described by Liu et al.28and Rivero-Pérez et al.25Briefly, 1.5± 2160.005 mg of the products was added to the test tube and mixed with a 2171.5 mLfinal volume of 78μM NADH, 50μM NBT, and 10μM PMS 218in 16 mM buffer Tris-HCl (pH 8.0). After the mixture had been 219shaken for 10 s, the absorbance (A) of the samples (S) at 560 nm was 220measured. “Oxidized controls”(OC; without products) and“sample 221controls”(SC; products and buffer) were also prepared. The results 222are expressed as oxidation inhibition percentages by the equation
= A − A −A A ×
oxidation inhibition % ( OC ( S SC))/ OC 100
223 (1)
224 Q-HRSC Assay.The Q-HRSC assay was adapted from the method 225developed by Halliwell et al.29and modified by Rivero-Perez et al.́ 25 226Briefly, 1± 0.005 mg of the powdered products was weighed and 227transferred into a screw-top test tube. A 1 mLfinal reaction volume 228contained a mixture of 1 mM deoxyribose, 0.1 mM C6H8O6, 1 mM
229H2O2, 0.1 mM FeCl3, and 0.1 mM EDTA in 5 mM phosphate buffer
230(pH 7.4). OC and SC were also prepared. The tubes were incubated 231for 60 min at 37°C with continuous stirring. Then, 1.5 mL of TCA 232(28% w/v) and 1 mL of TBA (1% w/v) were added, and the capped 233tubes were shaken and heated at 100°C for 15 min. The absorbance 234was recorded at 532 nm, and the results were expressed as oxidation 235inhibition percent followingeq 1.
236 Q-LPSC Assay.This assay was adapted from the method described 237by Rivero-Perez et al.́ 25The experiments were carried out in rat liver 238microsomal preparations,30 and lipid peroxidation was induced using 239AAPH as oxidant. The total microsomal protein content was 240determined using the Bradford method.31 A microsomal solution 241containing 10 mg/mL protein in 0.1 M Na4P2O7buffer (pH 7.4) was
242prepared and stored at−80°C until the day of analysis; 0.2±0.005 243mg of the tested products was placed into a screw-top tube, and 400 244μL of 50 mM Tris-HCl buffer (pH 7.0), 50 μL of the microsomal 245solution, and 50μL of 100 mM AAPH solution in the Tris-HCl buffer 246were added. OC and SC (replacing the AAPH solution by Tris-HCl 247buffer) were also prepared. The tubes were incubated at 37°C for 90 248min under continuous stirring. Then, 750μL of TCA (2.8% w/v) and 249500 μL of TBA (1% w/v) were added, and the capped tubes were 250shaken and heated at 100 °C for 15 min. Seven hundred and fifty 251microliters of the reaction mixture was transferred to another tube, and 252the TBA reactive substances were extracted with the same volume of 253butanol. The absorbance at 532 nm of the butanol extract was 254measured, and the results were expressed as oxidation inhibition 255percent with respect to the OC sample followingeq 1.
256 Statistical Analysis.The statistical validation of the methods was 257performed using Statgraphics Centurion XVI version 16.2.04 software 258(Statpoint Technologies, Inc., Warranton, VA, USA). The statistical 259analysis of the Q-TAC data was carried out using one-way analysis of 260variance (ANOVA). Fisher’s least significant difference (LSD) test was 261applied to determine the statistical significance of differences among 262various groups. A minimum significance level of p < 0.05 was 263considered. Pearson’s correlation coefficients were determined to 264study linear correlations between pairs of the Q-TAC methodologies.
265
■
RESULTS AND DISCUSSION266 Adaptation and Optimization of the TAC and Q-267FRSC Methods. This study shows some modifications with 268respect to Q-TAC protocols (Q-ABTS,12 Q-DPPH,12 Q-269FRAP,14 Q-ORAC,13 and Q-FC15) previously published. 270Moreover, three new QUENCHER methodologies were 271developed (Q-SRSC, Q-HRSC, and Q-LPSC), which were 272adapted from validated classical FRSC methods.25
273 The main modification from other Q-TAC assays was the 274selection of aqueous reaction mediums whenever the
method-275 ologies allowed for the use of both organic and aqueous
276 solvents. Aqueous medium might better represent the real
277 environment surrounding any food matrix or biological system.
278 Therefore, MQ water or aqueous buffer was initially used in all
279 protocols except in the Q-DPPH assay, which required an
280 organic solvent to dissolve the radical.
281 The particle size of the powdered products is a factor that
282 might influence the results of the Q-TAC and Q-FRSC
283 measurements, and this aspect should be taken into account for
284 comparisons among powders of different particle size.
Never-285 theless, Serpen et al.17did notfind a remarkable effect of this
286 factor, and Gökmen et al.11 suggested the use of powdered
287 samples of particle size ranging from 0.3 to 0.1 mm in
288 QUENCHER assays.
289 All protocols in this study were optimized for the direct
290 measurement of small quantities of powdered products,
291 considering the final reaction volume and amount of sample
292 weighed.
293 The Q-FC, Q-FRAP, Q-ABTS, and Q-DPPH methods are
294 rather inexpensive and simple methodologies, which allow for
295 the adjustment of the assay volumes (maintaining the
296 proportionality among the reagents) without a relevant increase
297 in the cost of the analysis. Preliminary studies were conducted
298 to establish 1 mg as an advisible amount of product, although
299 satisfactory results can also be obtained with smaller or larger
300 quantities (0.2−5 mg), depending on the TAC of the products
301 and the sensitivity of the assay.
302 In the case of the Q-ORAC method, the reaction volume is
303 restricted by the maximum volume of the cuvette because the
304 fluorescence decay needs to be continuously monitored (kinetic
305 assay). Amigo-Benavent et al.13 proposed that the Q-ORAC
306 assay be carried out in alternating stages of incubation at 37°C
307 in a test tube with centrifugation, transfer to a cuvette, and
308 fluorescence reading. The Q-ORAC method proposed in the
309 present study avoids several centrifugation/transfer steps, is
310 more similar to classical protocols, and reproduces more
311 effectively the advantages of the ORAC assay with respect to
312 other TAC methods.2,4,8 However, a fluorometer with a
313 temperature control chamber and constant stirring in the
314 cuvette is required, and the assay might not be suitable for
315 products of very high Q-TAC.
316 With regard to the Q-SRSC, QHRSC, and Q-LPSC methods,
317 thefinal reaction volume and amount of sample weighed must
318 be adjusted to give results in the range of 0−100% oxidation
319 inhibition. The Q-SRSC assay is a rather simple and quick
320 methodology that can be directly performed in the cuvette or in
321 a test tube. However, the Q-HRSC and the Q-LPSC assays
322 involve more tedious protocols. It is suggested that the amount
323 of sample used be adjusted rather than increasing the final
324 volume, although it must be remarked that the precision of the
325 QUENCHER methods might be compromised when <0.2 mg
326 of the samples is weighed.
327 QUENCHER fixed end-point procedures allow for
trans-328 ferring an aliquot of the reaction medium to a microplate for
329 the absorbance reading step. This alternative increases the
330 repeatability and reduces the time between different
measure-331 ments, so it is especially appropriate for the simultaneous
332 analyses of multiple samples. On the other hand, QUENCHER
333 kinetic assays cannot be carried out directly in a microplate due
334 to the interference of solid products on the absorbance
335 measurement. Furthermore, the extremely small quantity of
336 solid sample required, proportional to the small volume of
337 wells, could put at risk the validity of this procedure.
DOI: 10.1021/acs.jafc.5b01644 J. Agric. Food Chem.XXXX, XXX, XXX−XXX
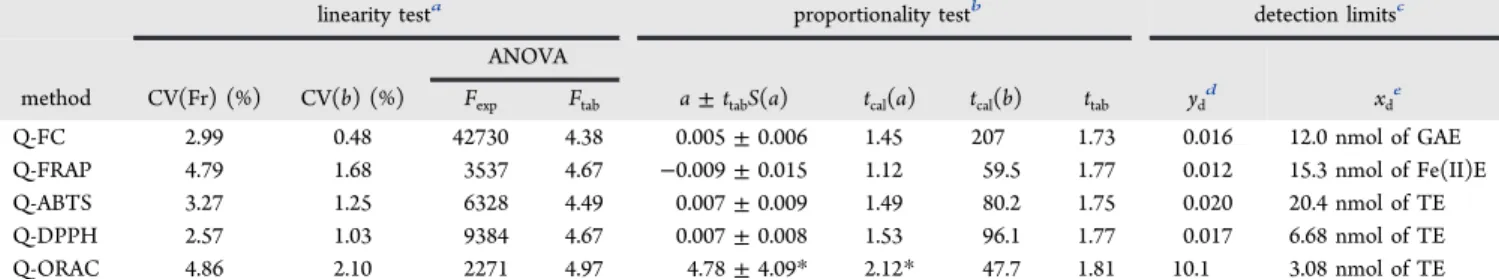
338 Validation of the Q-TAC and Q-FRSC Methods. The 339validation study was done by the examination of the following 340parameters: linearity, proportionality, detection limits, and 341precision (repeatability and intermediate precision).32 In the 342case of Q-FRSC assays (Q-SRSC, Q-HRSC, and Q-LPSC), 343only the precision was evaluated because in these methods a 344calibration curve is not needed. In the Q-TAC methodologies 345(Q-FC, Q-FRAP, Q-ABTS, Q-DPPH, and Q-ORAC), a dose− 346response curve was obtained by testing different amounts of the 347standard used in each method. The calibration was performed 348using linear models and the least-squares (LS) method. All of 349the models presented coefficient of determination (R2) values t1 350>0.995 (Table 1).
351 Once the parameters were estimated, the models were 352validated by verifying the assumptions related to the residuals
353 and the functions.33 The studentized residuals were normally
354 distributed (Kolmogorov−Smirnov, chi-square, and Shapiro−
355 Wilk tests), independent (Durbin−Watson test), and
homo-356 scedastic (Cochran and Bartlett tests) in all cases. The
357 functional part of each linear model was first validated in a
358 t2 linearity test. According to the results (Table 2), all of the
359 models were suitable for describing the linear relationship
360 between the standard concentration and the response of each
361 assay. The Q-FC method obtained the best values for all of the
362 parameters tested, whereas the Q-ORAC assay linearity
363 response was the least satisfactory, although within the
364 acceptance criteria. In addition, a proportionality test to
365 determine whether the mathematical model could be used for
366 predictive purposes was performed (Table 2). The conditions
367 of proportionality were corroborated for all methods except
Q-Table 1. Calibration Models of the QUENCHER Total Antioxidant Capacity (Q-TAC) Methods
method standarda range (μmol) calibration modelb R2c Q-FC GA 0.059−0.588 A750 nm= (1.79±0.009)μmol of GA + (0.005±0.004) 0.999 Q-FRAP Fe(II) 0.036−0.285 A593 nm= (2.76±0.046)μmol of Fe(II)−(0.009±0.008) 0.996
Q-ABTS T 0.083−0.499 (AWS−AS)734 nm= (1.20±0.015)μmol of T + (0.007±0.005) 0.998
Q-DPPH T 0.040−0.200 (AWS−AS)517 nm= (3.20±0.033)μmol of T + (0.007±0.004) 0.999
Q-ORAC T 0.010−0.050 net AUC = (3361±70.3)μmol of T + (4.78±2.25) 0.996 aGA, gallic acid; Fe(II), iron(II); T, Trolox.b3A
WS, absorbance of the radical working solution;AS, absorbance of the sample; net AUC, net area under the curve.cR2, coefficient of determination.
Table 2. Linearity Test, Proportionality, and Detection Limits of the QUENCHER Total Antioxidant Capacity (Q-TAC) Methods
linearity testa proportionality testb detection limitsc ANOVA
method CV(Fr) (%) CV(b) (%) Fexp Ftab a±ttabS(a) tcal(a) tcal(b) ttab ydd xde
Q-FC 2.99 0.48 42730 4.38 0.005±0.006 1.45 207 1.73 0.016 12.0 nmol of GAE Q-FRAP 4.79 1.68 3537 4.67 −0.009±0.015 1.12 59.5 1.77 0.012 15.3 nmol of Fe(II)E Q-ABTS 3.27 1.25 6328 4.49 0.007±0.009 1.49 80.2 1.75 0.020 20.4 nmol of TE Q-DPPH 2.57 1.03 9384 4.67 0.007±0.008 1.53 96.1 1.77 0.017 6.68 nmol of TE Q-ORAC 4.86 2.10 2271 4.97 4.78±4.09* 2.12* 47.7 1.81 10.1 3.08 nmol of TE aCV(Fr), coefficient of variation of the response factor; CV(b), coefficient of variation of the slope; ANOVA by means of the F test (F
exp, experimentalF;Ftab, tabulatedF(1,n−2, 0.05)). Linearity test acceptance criteria: CV(Fr) < 5%; CV(b) < 2%; ANOVAFexp>Ftab.ba±ttabS(a), confidence interval of the ordinate at origin;tcal, calculated Student’st;ttab, tabulated Student’st(n−2, 0.05). Proportionality acceptance criteria: interval should include 0;tcal(a) <ttab;tcal(b) >ttab.*, results do not meet the acceptance criteria.cyd, detection signal;xd, capability of detection. Detection limits calculated forαandβ= 0.05.dydunits, absorbance units (Q-FC, Q-FRAP, Q-ABTS, Q-DPPH); net area under the curve (net AUC) (Q-ORAC).eGAE, gallic acid equivalents; Fe(II)E, iron(II) equivalents; TE, Trolox equivalents.
Table 3. Precision of the QUENCHER Total Antioxidant Capacity (Q-TAC) and QUENCHER Free Radical Scavenging Capacity (Q-FRSC) Methods
repeatability intermediate precision
method units ofSrandSRa CVb(%) S
r (Rp)c Sr (IP)d CVe(%) SRf
Q-FC μmol GAE/g product 2.06 1.23 1.17 2.37 1.49
Q-FRAP μmol Fe(II)E/g product 4.98 10.8 10.7 6.48 16.0
Q-ABTS μmol TE/g product 2.13 2.24 2.73 3.05 3.26
Q-DPPH μmol TE/g product 3.12 1.24 1.26 3.85 1.59
Q-ORAC μmol TE/g product 5.45* 2.94 2.79 5.48 3.01
Q-SRSC oxidation inhibition % 3.27 1.05 1.46 6.35 1.62
Q-HRSC oxidation inhibition % 5.31* 2.79 3.09 6.32 3.28
Q-LPSC oxidation inhibition % 5.26* 4.01 4.44 6.35 4.87
aGAE, gallic acid equivalents; Fe(II)E, iron(II) equivalents; TE, Trolox equivalents.bRepeatability acceptance criteria: CV < 5%.*, results do not meet the acceptance criteria. cEstimate of repeatability (Sr) determined by one-variable analysis of seven replicates 1 day (Rp, repeatability experiment).dEstimate of repeatability (Sr) determined by one-way ANOVA of three replicates on three different days (IP, intermediate precision experiment).eIntermediate precision acceptance criteria: CV < 10%.fEstimate of intermediate precision (SR) determined by one-way ANOVA of three replicates on three different days (IP, intermediate precision experiment).
DOI: 10.1021/acs.jafc.5b01644 J. Agric. Food Chem.XXXX, XXX, XXX−XXX
368ORAC, where the ordinate at origin did not meet any of the 369criteria. In this assay the Q-TAC is assessed by the net AUC 370determination and a lag time is observed during oxidation of 371the fluorescein in the presence of an antioxidant.1,27 The 372unsatisfactory result of the ordinate at origin is explained by the 373lack of proportionality of this lag time at very small amounts of 374Trolox. However, a linear response was observed at higher 375quantities of the standard, as previously observed by Ou et al.27 376in the classical approach of this assay.
377 Having studied the acceptability of the linear models, the 378detection limits yd (detection signal) and xd (capability of 379detection) of the assessed methodologies were determined as 380described by Ortiz et al.33 In general, low limits of detection 381were observed (Table 2), which confirmed the acceptability of 382all methodologies to determine the TAC of very small 383quantities of antioxidants. Among the assays using Trolox as 384standard, the lowest xd value corresponded to the Q-ORAC 385assay, which was corroborated as a highly sensitive method-386ology, and the highest limits of detection were obtained by the 387Q-ABTS method. A similar observation was previously 388reported for a comparison of classical TAC methodologies.25 389 Finally, two different terms of the precision were evaluated, 390the repeatability (Rp) and the intermediate precision (IP), 391determining their estimates (Sr and SR, respectively) and 392coefficients of variance (CV).32The IP refers to the precision 393under reproducibility conditions when only some of the factors 394are varied. In this study a single factor (different days) was 395investigated. The results of the Rp and IP experiments for each t3 396methodology are shown inTable 3. It can be seen that similar 397Srvalues were obtained in both Rp and IP experiences for all of 398the methods. The CV of the assays was the criteria selected to 399evaluate their acceptability. The Rp of the longest protocols 400(Q-ORAC, Q-HRSC, and Q-LPSC) exceeded the CV < 5% 401cutoffvalue, whereas those assays with just one or two steps 402(Q-FC, Q-ABTS, and Q-DPPH) showed a high Rp between 403measurements. By comparison with the Rp obtained in classical 404protocols validated using different wines as samples,25slightly 405higher CV were observed in the Q-TAC, and especially in the 406Q-FRSC methods, as all classical assays obtained CV < 5%. The 407only exception was the Q-ABTS assay, which showed better Rp 408than the classical approach. In terms of IP (Table 3), all of the 409methodologies presented satisfactory results, with the lowest 410CV (%) obtained again by two of the simplest methods (Q-FC 411and Q-ABTS). Therefore, the differences in the Rp and IP 412among the methodologies were mainly attributed to the 413complexity of the protocols. The sensitivity of the assays
414 could also affect the precision observed, as might be the case for
415 the Q-ORAC method mentioned above.
416
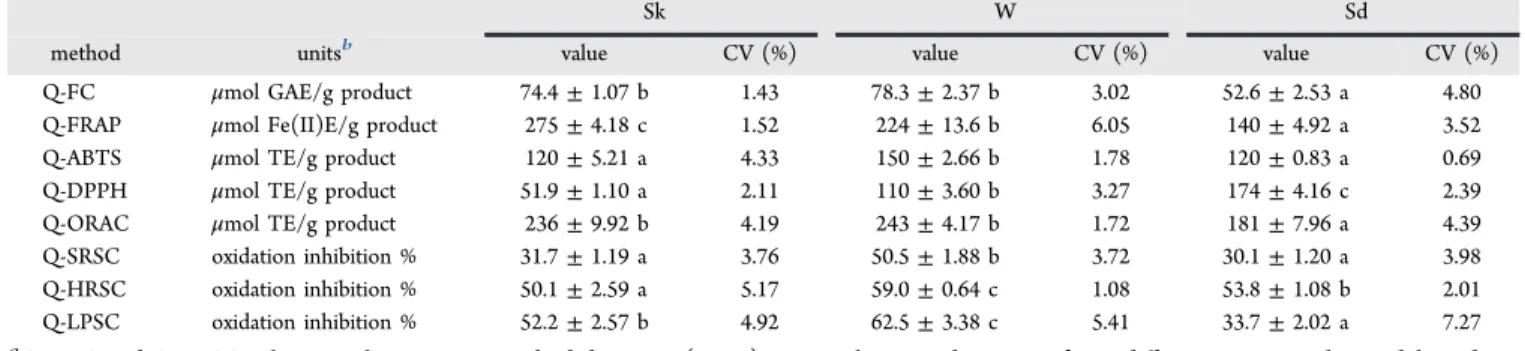
Q-TAC and Q-FRSC of the Model Products.To provide 417 comprehensive information on the actual TAC of food, it is
418 recommended that at least two TAC assays be used.6,8
419 Similarly, in this study, a broad overview of the antioxidant
420 capacity of the three model products (Sk, W, and Sd) was
421 achieved with the different QUENCHER methodologies under
422 study.
423 t4 As shown in Table 4, model product W (rich in both
424 hydrophobic and hydrophilic antioxidant compounds) showed
425 the highest Q-TAC and Q-FRSC values in most of the
426 methods, with the exception of the Q-FRAP assay, where Sk
427 (model product especially rich in hydrophilic antioxidant)
428 presented the most elevated antioxidant capacity and the
Q-429 DPPH assay, where Sd (model product especially rich in
430 hydrophobic antioxidant) exhibited the highest Q-TAC values.
431 The difference between the antioxidant capacity of Sk and W
432 was not significant in the Q-FC and Q-ORAC protocols. No
433 significant differences were found between Sk and Sd in the
Q-434 ABTS and Q-SRSC assays. From a comparison of the responses
435 obtained by the three methodologies where Trolox was used as
436 standard, Q-ORAC obtained the highest TAC values, but it
437 must be noted that the sensitivity of this method to Trolox was
438 also more elevated than in the Q-DPPH and Q-ABTS assays.
439 The obtained results were contrasted with those obtained by
440 classical determinations, and considerable differences were
441 found, except with the Q-DPPH method. Several studies
442 comparing extracts from wine pomace reported a higher
443 antioxidant capacity exhibited by seeds than skins, obtaining the
444 same tendency using different assays (FC,34−37 FRAP,34,36,37
445 ABTS,36 DPPH,34−37 ORAC,36 SRSC,35 and HRSC34). This
446 fact may be explained because classical protocols involve
447 extraction with solvents, which are capable of extracting both
448 hydrophobic and hydrophilic antioxidants. Therefore, the
449 extracts obtained might not be representative of the antioxidant
450 capacity that solid foods could actually exert, whereas
451 QUENCHER assays may provide more reliable information.11
452
Correlation Study between the QUENCHER
Method-453
ologies.Pearson’s correlation coefficients (r) between pairs of 454 the assays were determined using the Q-TAC and Q-FRSC
455 values obtained for Sk, W, and Sd by the different
456 QUENCHER methodologies.
457 In the literature, due to the wide spectrum of analytical
458 techniques and reaction conditions available, it is difficult to
459 find an agreement on the correlations among different TAC
460 methodologies.2,8,38 To the extent of our knowledge, the
Table 4. QUENCHER Total Antioxidant Capacity (Q-TAC) and QUENCHER Free Radical Scavenging Capacity (Q-FRSC) of the Model Products Obtained from Skins (Sk), Seeds (Sd), and Whole (W) Wine Pomacea
Sk W Sd
method unitsb value CV (%) value CV (%) value CV (%)
Q-FC μmol GAE/g product 74.4±1.07 b 1.43 78.3±2.37 b 3.02 52.6±2.53 a 4.80 Q-FRAP μmol Fe(II)E/g product 275±4.18 c 1.52 224±13.6 b 6.05 140±4.92 a 3.52 Q-ABTS μmol TE/g product 120±5.21 a 4.33 150±2.66 b 1.78 120±0.83 a 0.69 Q-DPPH μmol TE/g product 51.9±1.10 a 2.11 110±3.60 b 3.27 174±4.16 c 2.39 Q-ORAC μmol TE/g product 236±9.92 b 4.19 243±4.17 b 1.72 181±7.96 a 4.39 Q-SRSC oxidation inhibition % 31.7±1.19 a 3.76 50.5±1.88 b 3.72 30.1±1.20 a 3.98 Q-HRSC oxidation inhibition % 50.1±2.59 a 5.17 59.0±0.64 c 1.08 53.8±1.08 b 2.01 Q-LPSC oxidation inhibition % 52.2±2.57 b 4.92 62.5±3.38 c 5.41 33.7±2.02 a 7.27 aQ-TAC and Q-FRSC values are the mean±standard deviation (n= 3). Roman letters indicate significant differences among the model products (Sk, W, Sd) within each QUENCHER methodology.bGAE, gallic acid equivalents; Fe(II)E, iron(II) equivalents; TE, Trolox equivalents.
DOI: 10.1021/acs.jafc.5b01644 J. Agric. Food Chem.XXXX, XXX, XXX−XXX
461correlation between different QUENCHER methodologies has 462not been described yet. In this study, an interesting 463correspondence among the assays was observed, especially for 464the Q-FC and Q-ABTS assays with the rest of methods. A 465highly significant (p< 0.01) positive correlation was detected 466between Q-FC and Q-FRAP (r= 0.847), between Q-FC and 467Q-ORAC (r = 0.974), and between Q-FC and Q-LPSC (r= 4680.926). The correspondence between Q-FC and Q-FRAP is 469due to the fact that both methods measure the reducing 470capacity of the sample,38 also detected between the classical 471approaches.36,37 Furthermore, the significant correlation 472between Q-ORAC and Q-LPSC (r= 0.914) may be explained 473because peroxyl radicals are involved in both assays.39 The 474positive correlation of the FC with the ORAC and Q-475LPSC assays is very convenient as they are more biologically 476relevant methods, but these assays are also more complicated, 477and their validation study showed some unsatisfactory results. 478However, the obtained results contrast with the weaker 479correlation (R2 = 0.409) found between the classical 480approaches of the FC and the ORAC assays by Ky et al.36 481using also wine pomace as samples. In the present study, 482interesting high positive correlations (p < 0.01) between Q-483ABTS and Q-SRSC (r= 0.935) and between ABTS and Q-484HRSC (r = 0.903) were also observed. According to Rivero-485Pérez et al.,25such strong correlations were not detected in the 486classical approaches of these assays using wines as samples. On 487the other hand, negative correlations (p< 0.05) between Q-488DPPH and Q-FC (r = −0.781), between DPPH and Q-489FRAP (r=−0.986), and between Q-DPPH and Q-ORAC (r= 490−0.808) were found in the present study, and the Q-DPPH 491method was not significantly correlated with any of the 492biologically relevant Q-FRSC assays. In classical methodologies, 493the DPPH and HRSC assays were not found to be correlated 494either,34 but high positive correlations were usually detected 495between the DPPH and other TAC methods (FC,35−37 496FRAP,34,37and ABTS25). It must be noted that the Q-DPPH 497is the only QUENCHER methodology that was performed in 498an organic reaction medium, and its lack of positive correlation 499with the rest of the protocols indicates the elevated influence of 500the solvent used in these assays.
501 The different contents of hydrophilic and lipophilic 502compounds40,41 of the three model products used in this 503study allow for assessing the response of each method toward
504 matrices with compounds of high or low water solubility.
505 Anyway, it would be advisible to confirm the correlations found
506 in the current study by evaluating a wider range of products.
507 With the results of both the validation and correlation studies
508 taken into account, the combination of both FC and
Q-509 ABTS assays is suggested as a good selection for a general
Q-510 TAC analysis of powdered foods. The Q-SRSC, Q-HRSC, and
511 Q-LPSC methods,first adapted to the QUENCHER approach
512 in this study, might give a more biologically relevant overview
513 of the antioxidant capacity of the samples. However, the
Q-514 HRSC and Q-LPSC assays are complicated protocols for
515 routine analysis, and it has been shown that the combination of
516 the Q-FC and Q-ABTS methods covers the correspondence
517 with the results obtained by the three biologically relevant
Q-518 FRSC assays.
519
Effects of the Reaction Medium in the FC and
Q-520
ABTS Assays. In the QUENCHER methods there is no 521 extraction step, but the reaction medium is a key factor that
522 determines the solubility of the compounds present in the solid
523 powdered product, as well as the interactions between the
524 antioxidants and the radicals used as probes in the assays.
525 Serpen et al.42proposed a water/ethanol (H2O:EtOH) 50:50
526 (v/v) ratio as a suitable working solution, providing accurate
Q-527 TAC results for most of the food matrices studied. Therefore,
528 the effect of using water or a mixture H2O:EtOH 1:1 (v/v) as
529 reaction medium was assessed in the current study using the
530 two previously selected Q-TAC methods (Q-FC and Q-ABTS).
531 The Q-FC (H2O:EtOH) and Q-ABTS (H2O:EtOH) assays
532 were validated as previously described for the rest of the
533 methodologies and presented satisfactory results for all
534 parameters evaluated (Supporting Information 1). Slight
535 formation of white solids was observed in the Q-FC
536 (H2O:EtOH) method, probably due to the precipitation of
537 Na2CO3in the presence of ethanol. Nevertheless, these solids
538 did not interfere in the measurement. The responses of the
Q-539 FC and Q-FC (H2O:EtOH) assays to different standard
540 concentrations were not significantly different (similar slopes in
541 the calibration models), whereas a 2.54 times lower response to
542 Trolox in the Q-ABTS than in the Q-ABTS (H2O:EtOH)
543 method was detected. In contrast, Serpen et al.42found similar
544 slopes of the dose−response lines obtained in the Q-ABTS
545 assays using different solvent ratios H2O:EtOH (0:100, 25:75,
546 50:50, 75:25, 100:0). A possible explanation might be that the Figure 1.QUENCHER total antioxidant capacity (Q-TAC) of the model products (Sk, skins; W, whole; Sd, seeds): (A) Q-FC assays; (B) Q-ABTS assays. GAE, gallic acid equivalents; TE, Trolox equivalents. Data are expressed as mean values±standard deviation (n= 3). Roman letters indicate significant differences among the model products (Sk, W, Sd) within each assay. The asterisk (∗) refers to significant differences between the Q-TAC and Q-TAC (H2O:EtOH) approaches for each wine pomace product.
DOI: 10.1021/acs.jafc.5b01644 J. Agric. Food Chem.XXXX, XXX, XXX−XXX
547calibration curves of Q-TAC methodologies carried out in this 548study were performed by weighing directly the standards, 549without their previous dilution in any solvent. Thus, the lower 550solubility of Trolox in water than in organic solvents played a 551critical role in the response observed in each method, as 552previously described by other authors.9 This fact may lead to 553lower Q-TAC values in the Q-ABTS than in the Q-ABTS 554(H2O:EtOH) assay due intrinsically to the methods used rather 555than the samples analyzed. Therefore, as the numeric Q-TAC 556values obtained by the Q-ABTS assays may not be directly 557comparable, the tendency observed among the samples (higher 558or lower Q-TAC values) was the main interest of these 559analyses.
560 The Q-TAC of Sk, W, and Sd obtained using the Q-FC and f1 561Q-ABTS assays can be seen inFigure 1. As previously described 562for classical methods,1,39 the reaction medium greatly 563influenced the Q-TAC results, with both soluble compounds 564and insoluble antioxidants attached to the powdered products 565being affected by the solvent used in the Q-TAC assays. A 566similar tendency was observed in both Q-FC and Q-ABTS 567assays when water was replaced by a mixture of H2O:EtOH 568(1:1, v/v) as reaction medium. A significant increase in the Q-569TAC values of Sd was observed, reaching higher antioxidant 570capacity than W, for which Q-TAC was also enhanced, but to a 571lesser extent. The Sk product showed the lowest Q-TAC in 572both Q-FC (H2O:EtOH) and Q-ABTS (H2O:EtOH) assays. 573Similar results were obtained in previous studies21carried out 574using conventional methodologies including extraction steps 575with organic solvents. Indeed, a good correlation between 576general results obtained using Q-TAC (H2O:EtOH) and 577classical methods was observed. In contrast, this fact was only 578found between Q-TAC (carried out in water) and classical 579methods when the matrices under study were rich in 580hydrophilic antioxidants (Supporting Information2).
581 Differences among results obtained for the three model 582products using the different Q-TAC methods can be partly 583explained by their chemical composition, the solubility of their 584antioxidant compounds in the reaction medium, and their 585redox reactions with the radical probes or reagents used in each 586assay. With regard to the chemical composition of the model 587products tested, it is important to have in mind that skins of 588grapes are a rich source of anthocyanins and hydroxycinnamic 589acids, although they also contain some flavanols and flavonol 590glycosides, whereas gallic acid,flavanols, and proanthocyanidins 591are mainly present in the seeds of grapes.35,37,43According to
592 these facts, the Sk model product was rich mainly in
593 anthocyanins and hydroxycinnamic acids, whereas Sd was rich
594 inflavanols from monomers to polymers (proanthocyanins and
595 tannins). A description of the solubility of food antioxidants,
596 including main phenolic classes, can be found in Gökmen et
597 al.11In general, the water solubility of polyphenols increases
598 with the number of glycosylated hydroxyl groups and with the
599 amount of sugars constituting the carbohydrate moiety. On the
600 other hand, in the case of polymerized polyphenols (such as
601 proanthocyanidins or tannins), the water solubility considerably
602 drops with an increased number of units and with the
603 formation of intramolecular bonds.44Thus, the higher polarity
604 of the polyphenols found in the grape skins allows that they are
605 well solubilized when water is used as reaction medium,44
606 whereas the presence of ethanol seems to favor the extraction
607 of hydrophobic antioxidants present in the grape seeds. It must
608 be pointed out that lower H2O:EtOH ratios are not advised
609 because it may cause the shrinking of the major constituents of
610 the food matrices, such as cellulose and proteins.17,42 This
611 could hamper the release of the compounds or the diffusion of
612 the radicals into the solid matrices where they can react with
613 inner bound insoluble antioxidants, leading to lower Q-TAC
614 values.11
615 The reaction medium also affects the interactions between
616 the antioxidants and reagents involved in the methods by
617 enhancing or decreasing the equilibrium constant of their redox
618 reactions. In the QUENCHER approaches, when the redox
619 equilibrium constant of an antioxidant compound in a
620 determinate medium is higher than its solubility constant, the
621 extraction of this antioxidant from the insoluble matrix and its
622 solubilization in the reaction medium can be
thermodynami-623 cally enhanced.42
624 The study of the correlations between the Q-TAC assays
625 carried out in the same reaction medium showed a strong
626 correspondence (p< 0.01) between Q-FC (H2O:EtOH) and
627 Q-ABTS (H2O:EtOH) (r = 0.971), whereas there was no
628 significant correlation between Q-FC and Q-ABTS (r= 0.496).
629 Thisfinding shows that, in the Q-TAC (H2O:EtOH) methods,
630 the factors related to the assay reaction medium (solubilization
631 of the antioxidant compounds) play a more critical role than
632 those related to the method used (reaction with the probes or
633 reagents). Therefore, the mixture H2O:EtOH 50:50 (v/v)
634 proposed by Serpen et al.42might be adequate to evaluate the
635 global TAC of food materials, but the Q-TAC of hydrophobic
Table 5. Influence of the Amount of Sample Weighed and the Use of Cellulose (C) as a Diluting Agent in the Q-ABTS Assays Evaluated in Model Products Obtained from Skins (Sk) or Seeds (Sd) Separated from Red Wine Pomacea
method Q-TAC values (μmol TE/g product)
Q-ABTS Sk 3 mg Sk 2 mg Sk 1 mg Sk:C (2:1) 3 mg Sk:C (1:2) 3 mg 116±3.97 119±3.41 122±3.77 121±1.88 118±8.32
Sd 3 mg Sd 2 mg Sd 1 mg Sd:C (2:1) 3 mg Sd:C (1:2) 3 mg 126±5.47 a 139±5.83 b 148±3.30 c 153±3.44 c 167±5.11 d
Q-ABTS (H2O:EtOH) Sk 1.5 mg Sk 1 mg Sk 0.5 mg Sk:C (2:1) 1.5 mg Sk:C (1:2) 1.5 mg
124±4.10 cb 131±4.56 c 116±8.89 b 117±4.13 b 93.4±4.75 a
Sd 0.75 mg Sd 0.5 mg Sd 0.25 mg Sd:C (2:1) 0.75 mg Sd:C (1:2) 0.75 mg 314±5.45 320±9.30 318±18.1 323±10.1 320±17.4
aQ-TAC values are the mean±standard deviation (n= 3). TE, Trolox equivalents. Roman letters indicate significant differences among the different amounts of sample and the dilutions with cellulose tested within each method (Q-ABTS or Q-ABTS (H2O:EtOH)) for each product (Sk or Sd).
DOI: 10.1021/acs.jafc.5b01644 J. Agric. Food Chem.XXXX, XXX, XXX−XXX
636antioxidants could be overestimated under certain conditions 637and, then, their real antioxidant role in food matrices. 638 Moreover, the correlations between the biologically relevant 639Q-FRSC assays and both Q-TAC (H2O:EtOH) methods were 640not significant in the case for the Q-SRSC and Q-HRSC 641methods, and not even a significant (p < 0.01) negative 642correlation between Q-LPSC and Q-ABTS (H2O:EtOH) (r= 643−0.716) was found. These results further support the selection 644of the Q-FC and Q-ABTS assays in water as preferred protocols 645to assess a potentially more biologically relevant Q-TAC of 646food products and dietary supplements.
647 Effects of Using Cellulose as a Diluting Agent in the 648Q-ABTS Assays. Cellulose has been suggested as a diluting 649agent in previous Q-TAC protocols.11,12However, the affinity 650of polyphenols to cellulose is well-known,45so it is possible that 651interactions between the cellulose and these antioxidant 652compounds interfere in the quantification.
653 The possible influence of cellulose on the Q-TAC measure-654ments was evaluated with the Q-ABTS assays (the most widely 655used Q-TAC assay up to now), and it was compared with the 656effects of weighing different amounts of sample. The two model 657products that presented more differences between them (Sk 658and Sd) were chosen to carry out this study. Two dilutions or 659product/cellulose ratios (2:1 and 1:2) were used. The 660quantities of product weighed were adapted to those required 661by each method to give results within their detection range. As t5 662can be seen inTable 5, no influence of the amount of sample or 663the presence of cellulose on the Q-TAC values was observed 664for Sk in the Q-ABTS assay and for Sd in the Q-ABTS 665(H2O:EtOH) method. However, Q-ABTS results of Sd showed 666significantly higher Q-TAC values when lower amounts of 667sample were used, and this effect was more marked when the 668product was diluted with cellulose. In contrast, the opposite 669tendency was found for Sk in the Q-ABTS (H2O:EtOH) assay. 670In this case, inferior Q-TAC values were obtained when a lower 671amount of Sk was used, which were only significant in Sk/ 672cellulose (1:2) with respect to the nondiluted Sk sample. 673 The observed effect of weighing different amounts of Sd in 674the Q-ABTS assay could be due to a better water extraction of 675its slightly soluble hydrophobic polyphenols11,36when they are 676at a lesser concentration. Moreover, possible hydrophobic 677interactions between the antioxidant compounds (favored in 678the aqueous medium)46could be more relevant when a higher 679amount of sample is present, thus decreasing their ability to 680scavenge the soluble ABTS•+ radicals present in the reaction 681medium.
682 With regard to the influence of cellulose in the measure-683ments, absorbance values similar to those of the ABTS•+ 684working solution were obtained in both methods (Q-ABTS 685and Q-ABTS (H2O:EtOH)) when only cellulose was used as 686sample (data not shown), corroborating that cellulose alone is 687inert toward the ABTS•+ reagent, as has been previously 688described.12Therefore, the results obtained in this study could 689be due to the effects of cellulose in the solubility of the 690hydrophilic or lipophilic compounds present in the products 691and their capacity to interact with the ABTS•+ radicals, both 692factors influenced by the reaction medium. Hydrogen-bonding 693and hydrophobic interactions between cellulose and poly-694phenols have been described,45 which are also dependent on 695the solvent systems used. Hydrophobic interactions are favored 696in hydrophilic solvents, whereas hydrogen bonding is favored in 697the more hydrophobic ones. Thus, the affinity of polyphenols 698(such as gallotannins and ellagitannins) to cellulose is expected
699 to correlate with their hydrophobicity, their number of galloyl
700 groups, and their molecular size.44,45 This evidence explains
701 that cellulose effects are of particular importance in the
702 hydrophilic solvents when hydrophobic compounds are tested,
703 as happened when Sd was assessed by the Q-ABTS assay. The
704 monomeric and oligomeric proanthocyanidins of the grape
705 seeds might remain insoluble in aqueous reaction mediums.40,41
706 However, their interaction with cellulose through their
707 hydrophobic moieties might raise their water solubility and
708 leave the hydroxyl groups available to interact with the ABTS•+
709 radicals, leading to the increased Q-TAC values observed when
710 the product/cellulose ratio was decreased. On the other hand,
711 in the case of Sk in the Q-ABTS (H2O:EtOH) assay, the
712 contrary effect may take place. Hydrogen bonding between
713 cellulose and the hydrophilic phenolics present in wine pomace
714 skins could be favored in the presence of organic solvents.
715 Thus, the number of hydroxyl groups available in the molecules
716 to scavenge the radical probes of the assay is reduced.
717 On the basis of the cited results, the use of cellulose as a
718 diluting agent is discouraged in the Q-TAC methodologies,
719 especially if the antioxidant products tested are a source of
720 polyphenols. The main motive is the possible interaction of
721 cellulose with the phenolic compounds involved in the assays,
722 leading to an under- or overestimation of the Q-TAC of the
723 products.
724 In summary, a wide range of QUENCHER analytical
725 techniques to provide a comprehensive initial assessment in
726 vitro of the TAC and FRSC of food materials have been
727 adapted and validated (FC, ABTS, DPPH, FRAP,
Q-728 ORAC, SRSC, HRSC, and LPSC). The TAC and
Q-729 FRSC assays skip the extraction step of the classical antioxidant
730 capacity protocols and are simple, quick, inexpensive, and
731 precise methodological approaches. The QUENCHER
meth-732 odologies validated in this paper working with powdered model
733 products are suitable for application to other foods and food
734 ingredients, both rich in fat (as seeds) and not, as skins, which
735 are rich infiber and minerals among others. The combination
736 of the Q-FC and Q-ABTS assays using water as reaction
737 medium is proposed as the best choice to analyze a large
738 number of samples. They provide more biologically relevant
739 information than the classical TAC methods using extracts or
740 other Q-TAC approaches using nonaqueous solvents. It is
741 suggested that the same amount of sample be weighed,
742 especially when products rich in hydrophobic antioxidants are
743 assessed. The use of cellulose as a diluting agent is not
744 recommended in the Q-TAC methods. Finally, it must be
745 pointed out that, despite the advantages of the proposed
746 QUENCHER assays over other in vitro methodologies, the
Q-747 TAC or Q-FRSC of food materials and dietary supplements
748 cannot be directly translated into healthful effects provided in
749 vivo.
750
■
ASSOCIATED CONTENT751
*
S Supporting Information752 Validation of Q-FC (H2O:EtOH) and Q-ABTS (H2O:EtOH)
753 methods; correlations between classical TAC, Q-TAC
754 (H2O:EtOH) and Q-TAC methods. The Supporting
Informa-755 tion is available free of charge on theACS Publications website
756 at DOI:10.1021/acs.jafc.5b01644.
DOI: 10.1021/acs.jafc.5b01644 J. Agric. Food Chem.XXXX, XXX, XXX−XXX
757
■
AUTHOR INFORMATION 758Corresponding Author759*(P.M.) E-mail: [email protected]. Phone: +34-947258800, ext. 7608210. Fax: +34-947258831.
761Funding
762This research was supported by the autonomous government of 763Castilla y León (Project BU268A11-2). The Ph.D. grants to R. 764Del Pino-Garcıa and J. Garć ıa-Lomillo (FPU grants) are funded́ 765by the Ministerio de Educación, Cultura y Deporte of the 766Spanish government.
767Notes
768The authors declare no competingfinancial interest.
769
■
ABBREVIATIONS USED770ABTS, 2,2′-azinobis(3-ethylbenzothiazoline-6-sulfonic acid); 771AUC, area under the curve; DPPH, 2,2-diphenyl-1-picrylhy-772drazyl; FC, Folin−Ciocalteu; FRAP, ferric reducing/antioxidant 773power; FRSC, free radical scavenging capacity; GA, gallic acid; 774HRSC, hydroxyl radical scavenging capacity; LPSC, lipid 775peroxyl scavenging capacity; Q-, QUENCHER; OC, oxidized 776controls; ORAC, oxygen radical absorbance capacity; SC, 777sample controls; Sd, product from wine pomace seeds; Sk, 778product from wine pomace skins; SRSC, superoxide radical 779scavenging capacity; T, Trolox; TAC, total antioxidant capacity; 780W, product from whole wine pomace
781
■
REFERENCES (1)782 Prior, R. L.; Wu, X.; Schaich, K. Standardized methods for the 783determination of antioxidant capacity and phenolics in foods and 784dietary supplements.J. Agric. Food Chem.2005,53, 4290−4302.
(2)
785 Niki, E. Assessment of antioxidant capacity in vitro and in vivo. 786Free Radical Biol. Med.2010,49, 503−515.
(3)
787 López-Alarcón, C.; Denicola, A. Evaluating the antioxidant 788capacity of natural products: a review on chemical and cellular-based 789assays.Anal. Chim. Acta2013,763, 1−10.
(4)
790 Fraga, C. G.; Oteiza, P. I.; Galleano, M. In vitro measurements 791and interpretation of total antioxidant capacity.Biochim. Biophys. Acta, 792Gen. Subj.2014,1840, 931−934.
(5)
793 Sanchez-Moreno, C. Review: Methods used to evaluate the free 794radical scavenging activity in foods and biological systems.Food Sci. 795Technol. Int.2002,8, 121−137.
(6)
796 Perez-Jimé nez, J.; Arranz, S.; Tabernero, M.; Díaz- Rubio, M. E.;́ 797Serrano, J.; Goñi, I.; Saura-Calixto, F. Updated methodology to 798determine antioxidant capacity in plant foods, oils and beverages: 799extraction, measurement and expression of results.Food Res. Int.2008, 80041, 274−285.
(7)
801 Frankel, E. N.; Meyer, A. S. The problems of using one-802dimensional methods to evaluate multifunctional food and biological 803antioxidants.J. Sci. Food Agric.2000,80, 1925−1941.
(8)
804 Karadag, A.; Ozcelik, B.; Saner, S. Review of methods to 805determine antioxidant capacities.Food Anal. Methods2009,2, 41−60.
(9)
806 Pérez-Jiménez, J.; Saura-Calixto, F. Effect of solvent and certain 807food constituents on different antioxidant capacity assays.Food Res. Int. 8082006,39, 791−800.
(10)
809 Serrano, J.; Goñi, I.; Saura-Calixto, F. Food antioxidant capacity 810determined by chemical methods may underestimate the physiological 811antioxidant capacity.Food Res. Int.2007,40, 15−21.
(11)
812 Gökmen, V.; Serpen, A.; Fogliano, V. Direct measurement of 813the total antioxidant capacity of foods: the“QUENCHER”approach. 814Trends Food Sci. Technol.2009,20, 278−288.
(12)
815 Serpen, A.; Capuano, E.; Fogliano, V.; Gökmen, V. A new 816procedure to measure the antioxidant activity of insoluble food 817components.J. Agric. Food Chem.2007,55, 7676−7681.
(13)
818 Amigo-Benavent, M.; del Castillo, M. D.; Fogliano, V. Are the 819major antioxidants derived from soy protein and
fructo-oligosacchar-820 ides model systems colored aqueous soluble or insoluble compounds?
821 Eur. Food Res. Technol.2010,231, 545−553.
(14) Serpen, A.; Gökmen, V.; Fogliano, V. Total antioxidant822 823 capacities of raw and cooked meats.Meat Sci.2012,90, 60−65.
(15)Kraujalis, P.; Venskutonis, P. R.; Kraujalienė, V.; Pukalskas, A. 824 825 Antioxidant properties and preliminary evaluation of phytochemical
826 composition of different anatomical parts of amaranth. Plant Foods
827 Hum. Nutr.2013,68, 322−328.
(16) Açar, Ö. Ç.; Gökmen, V.; Pellegrini, N.; Fogliano, V. Direct 828 829 evaluation of the total antioxidant capacity of raw and roasted pulses,
830 nuts and seeds.Eur. Food Res. Technol.2009,229, 961−969.
(17) Serpen, A.; Gökmen, V.; Pellegrini, N.; Fogliano, V. Direct 831 832 measurement of the total antioxidant capacity of cereal products. J.
833 Cereal Sci.2008,48, 816−820.
(18) Çelik, E. E.; Gökmen, V.; Fogliano, V. Soluble antioxidant 834 835 compounds regenerate the antioxidants bound to insoluble parts of
836 foods.J. Agric. Food Chem.2013,61, 10329−10334.
(19)Delgado-Andrade, C.; Conde-Aguilera, J. A.; Haro, A.; Pastoriza 837 838 de la Cueva, S.; Rufian-Henares, J. Á ́. A combined procedure to
839 evaluate the global antioxidant response of bread.J. Cereal Sci.2010,
840 52, 239−246.
(20) González-Sanjosé, M. L.; García-Lomillo, J.; Del Pino-García, 841 842 R.; Muñiz-Rodríguez, P.; Rivero-Pérez, M. D. Universidad de Burgos.
843 ES Patent 2524870A1, 2013.
(21) García-Lomillo, J.; González-Sanjosé, M. L.; Del Pino-García, 844 845 R.; Rivero-Perez, M. D.; Muñiz, P. Antioxidant and antimicrobial
846 properties of wine by-products and their potential uses in the food
847 industry.J. Agric. Food Chem.2014,62, 12595−12602.
(22)Singleton, V. L.; Rossi, J. A. Colorimetry of total phenolics with 848 849 phosphomolybdic-phosphotungstic acid reagents. Am. J. Enol. Vitic.
850 1965,16, 144−158.
(23) Benzie, I. F.; Strain, J. J. The ferric reducing ability of plasma851 852 (FRAP) as a measure of“antioxidant power”: the FRAP assay. Anal.
853 Biochem.1996,239, 70−76.
(24) Re, R.; Pellegrini, N.; Proteggente, A.; Pannala, A.; Yang, M.; 854 855 Rice-Evans, C. Antioxidant activity applying an improved ABTS radical
856 cation decolorization assay.Free Radical Biol. Med. 1999,26, 1231−
857 1237.
(25) Rivero-Perez, M. D.; Muń ̃iz, P.; Gonzalez-SanJose, M. L.́ 858 859 Antioxidant profile of red wines evaluated by total antioxidant capacity,
860 scavenger activity, and biomarkers of oxidative stress methodologies.J.
861 Agric. Food Chem.2007,55, 5476−5483.
(26) Brand-Williams, W.; Cuvelier, M. E.; Berset, C. Use of a free 862 863 radical method to evaluate antioxidant activity. LWT−Food Sci.
864 Technol.1995,28, 25−30.
(27) Ou, B.; Hampsch-Woodill, M.; Prior, R. L. Development and 865 866 validation of an improved oxygen radical absorbance capacity assay
867 using fluorescein as the fluorescent probe.J. Agric. Food Chem.2001,
868 49, 4619−4626.
(28) Liu, F.; Ooi, V. E. C.; Chang, S. T. Free radical scavenging869 870 activities of mushroom polysaccharide extracts. Life Sci. 1997, 60,
871 763−771.
(29)Halliwell, B.; Gutteridge, J. M.; Aruoma, O. I. The deoxyribose 872 873 method: a simple“test-tube”assay for determination of rate constants
874 for reactions of hydroxyl radicals.Anal. Biochem.1987,165, 215−219.
(30)Kessler, M.; Ubeaud, G.; Jung, L. Anti- and pro-oxidant activity875 876 of rutin and quercetin derivatives.J. Pharm. Pharmacol.2003,55, 131−
877 142.
(31) Bradford, M. M. A rapid and sensitive method for the878 879 quantitation of microgram quantities of protein utilizing the principle
880 of protein-dye binding.Anal. Biochem.1976,72, 248−254.
(32) García, I.; Ortiz, M. C.; Sarabia, L.; Vilches, C.; Gredilla, E.881 882 Advances in methodology for the validation of methods according to
883 the International Organization for Standardization. Application to the
884 determination of benzoic and sorbic acids in soft drinks by
high-885 performance liquid chromatography.J. Chromatogr. A2003,992, 11−
886 27.
(33)Ortiz, M. C.; Sanchez, M. S.; Sarabia, L. A. Quality of analyticaĺ 887 888 measurements: univariate regression. InComprehensive Chemometrics.
DOI: 10.1021/acs.jafc.5b01644 J. Agric. Food Chem.XXXX, XXX, XXX−XXX
889Chemical and Biochemical Data Analysis; Brown, S. D., Tauler, R., 890Walczak, B., Eds.; Elsevier: Amsterdam, The Netherlands, 2009; pp 891127−169.
(34)
892 Makris, D. P.; Boskou, G.; Andrikopoulos, N. K. Polyphenolic 893content and in vitro antioxidant characteristics of wine industry and 894other agri-food solid waste extracts.J. Food Compos. Anal. 2007,20, 895125−132.
(35)
896 Cheng, V. J.; Bekhit, A. E.-D. A.; McConnell, M.; Mros, S.; 897Zhao, J. Effect of extraction solvent, waste fraction and grape variety 898on the antimicrobial and antioxidant activities of extracts from wine 899residue from cool climate.Food Chem.2012,134, 474−482.
(36)
900 Ky, I.; Lorrain, B.; Kolbas, N.; Crozier, A.; Teissedre, P. L. Wine 901by-products: phenolic characterization and antioxidant activity 902evaluation of grapes and grape pomaces from six different french 903grape varieties.Molecules2014,19, 482−506.
(37)
904 Rockenbach, I. I.; Gonzaga, L. V.; Rizelio, V. M.; De Sauza 905Schmidt Gonçalves, A. E.; Genovese, M. I.; Fett, R. Phenolic 906compounds and antioxidant activity of seed and skin extracts of red 907grape (Vitis vinifera and Vitis labrusca) pomace from Brazilian 908winemaking.Food Res. Int.2011,44, 897−901.
(38)
909 Huang, D.; Ou, B.; Prior, R. L. The chemistry behind 910antioxidant capacity assays.J. Agric. Food Chem.2005,53, 1841−1856.
(39)
911 Becker, E. M.; Nissen, L. R.; Skibsted, L. H. Antioxidant 912evaluation protocols: food quality or health effects. Eur. Food Res. 913Technol.2004,219, 561−571.
(40)
914 Yu, J.; Ahmedna, M. Functional components of grape pomace: 915their composition, biological properties and potential applications.Int. 916J. Food Sci. Technol.2013,48, 221−237.
(41)
917 Arranz, S.; Silvan, J. M.; Saura-Calixto, F. Nonextractablé 918polyphenols, usually ignored, are the major part of dietary 919polyphenols: a study on the Spanish diet.Mol. Nutr. Food Res.2010, 92054, 1646−1658.
(42)
921 Serpen, A.; Gökmen, V.; Fogliano, V. Solvent effects on total 922antioxidant capacity of foods measured by direct QUENCHER 923procedure.J. Food Compos. Anal.2012,26, 52−57.
(43)
924 Kammerer, D.; Claus, A.; Carle, R.; Schieber, A. Polyphenol 925screening of pomace from red and white grape varieties (Vitis vinifera 926L.) by HPLC-DAD-MS/MS. J. Agric. Food Chem. 2004, 52, 4360− 9274367.
(44)
928 Hemingway, R. W. Structural variations in proanthocyanidins 929and their derivatives. In Chemistry and Significance of Condensed 930Tannins; Hemingway, R. W., Karchesy, J. J., Branham, S. J., Eds.; 931Plenum Press: New York, 1989; pp 83−107.
(45)
932 Tang, H. R.; Covington, A. D.; Hancock, R. A. Structure-activity 933relationships in the hydrophobic interactions of polyphenols with 934cellulose and collagen.Biopolymers2003,70, 403−413.
(46)
935 Oh, H. I.; Hoff, J. E.; Armstrong, G. S.; Haff, L. A. Hydrophobic 936interaction in tannin-protein complexes.J. Agric. Food Chem.1980,28, 937394−398.
DOI: 10.1021/acs.jafc.5b01644 J. Agric. Food Chem.XXXX, XXX, XXX−XXX