American Journal of Kidney Diseases. 2006; 48(6): 972-982
Serum levels of anti-αGalactosyl antibodies predict survival
and peritoneal dialysis-related enteric peritonitis rates in
patients undergoing renal replacement therapy
Miguel Pérez Fontán, MD, Rafael Máñez, MD, Ana Rodríguez-Carmona, MD,
Javier Peteiro, MD, Verónica Martínez, MD, Teresa García-Falcón, MD, Nieves
Domenech, MD
Division of Nephrology and Laboratories of Biochemistry and Investigation, Hospital Juan Canalejo; Department of Medicine, Health Science Institute, University of A Coruña; and Hospital Universitario Bellvitge, IDIBELL, Hospitalet de Llobregat, Spain.
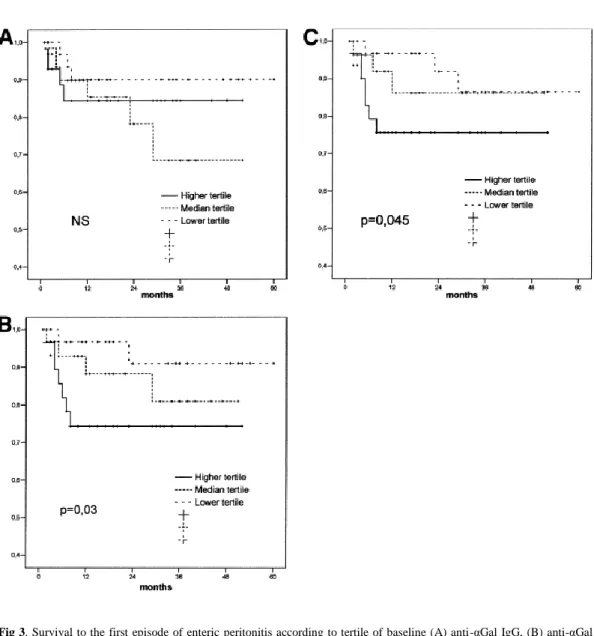
Background: Anti-Galα1-3Gal antibodies (anti-αGal) represent a significant fraction of natural antibodies and were implicated in several disease states, yet their origin and physiological significance remain largely undisclosed. Methods: Under a prospective observational design, we estimated anti-αGal immunoglobulin G (IgG)/IgM and antipig hemolytic antibody (APA) levels in 133 patients starting dialysis therapy and again after a 1-year follow-up. We used baseline data to show correlations with demographic, nutritional, inflammatory, and anemia markers and analyzed their correlation with outcomes by using univariate and multivariate strategies of survival analysis. Results: Serum anti-αGal and APA levels showed wide baseline variability, but remained relatively stable in time. Both were measurable in dialysate of peritoneal dialysis (PD) patients, showing close correlation to serum levels. We observed no association between levels of anti-αGal/APA and nutritional markers, but showed direct correlations of anti-αGal IgM (P = 0.005) and APA levels (P = 0.001) with tumor necrosis factor α (TNF-α) levels. High APA levels also were associated with severe anemia (P = 0.006). High baseline anti-αGal IgM (P = 0.03) and APA levels (P = 0.045) predicted later risk for enteric peritonitis in PD patients. Finally, univariate and multivariate analyses showed a consistent association between high baseline anti-αGal IgM (P = 0.014) and APA (P = 0.021) levels and global risk for mortality during follow-up. Conclusion: Anti-αGal IgM and APA levels at the start of dialysis therapy are significant predictors of later risk for mortality and, in PD patients, enteric peritonitis. Both correlate directly with TNF-α levels and, in the case of APA, severity of anemia in these patients.
Index words:
THE TERMINATED TRISACCHARIDE structure Galα1-3Galβ1-4GlcNAc (αGal) epitope is widely present on the cell surface of most living creatures, from bacteria to mammals. Humans and higher primates constitute a notable exception to this rule, and in these species, a reciprocal evolutionary pattern has resulted in the presence of variable amounts of preformed circulating antibodies (anti-αGal) against this epitope.1 Anti-αGal represent a small, yet significant, fraction of natural antibodies.2 They are synthesized by approximately 1% of B lymphocytes,3 accounting for approximately 1% to 8% of circulating γ-globulins,4 and appear to be present consistently in human secretions.5 They are most notorious for representing a main barrier to xenotransplantation, yet their origin and physiological roles are still not clear despite ample investigation in this field.6 Current knowledge suggests that anti-αGals are synthesized continuously by peritoneal cavity– derived B1 lymphocytes7,8, 9,10,11,12 as a response to lifetime contact between the organism and
intestinal flora.13 They are able to bind to the surface of different Enterobacteriaceae, including
Escherichia coli, Klebsiella species, and Serratia species, but it currently is unknown if they constitute a defense barrier against these bacteria.13 Anti-αGals may downregulate alternative complement pathway–dependent defense mechanisms, with a potential detrimental effect on the ability of the organism to combat infections by these microorganisms.14 This particularity may be aimed originally at limiting complement activation on the surface of senescent or abnormal erythrocytes, which anti-αGal contribute to clear from the circulation.15 Finally, anti-αGal also were implicated in the genesis of some autoimmune diseases.16,17
Anti-αGal and antipig hemolytic antibodies (APAs; a relatively nonspecific estimator of the functional properties of anti-αGal) have been studied insufficiently in patients undergoing renal replacement therapy (RRT). Some years ago, we reported a preliminary cross-sectional survey of a small group of patients prevalent on RRT.18 We now report on a wider cohort of patients followed up prospectively after starting RRT. Our main points of interest are to disclose the basic demographic characteristics of anti-αGal and APA in patients starting RRT; assess the correlation between serum levels of these antibodies and the nutritional, inflammatory, and anemia status of these patients; compare the time course of anti-αGal levels in patients treated with peritoneal dialysis (PD) and hemodialysis; and analyze the potential correlation between anti-αGal levels at the start of RRT and clinical outcome (survival) of these patients. In PD patients, we also scrutinized for the presence of these antibodies in peritoneal fluid and searched for an association between baseline serum and dialysate anti-αGal levels and later risk for PD-related peritonitis.
METHODS
General Design
(high-sensitivity C-reactive protein [hs-CRP], interleukin 6 [IL-6], tumor necrosis factor α [TNF-α], intercellular adhesion molecule [ICAM]), and residual renal function.
Table 1. Study Population
Age (y) 60 (7-87)
Sex (men/women) 84/49 (63.2/36.8)
Diabetes 54 (40.6)
Charlson comorbidity score 6 (2-12)
Malnutrition (Subjective Global Assessment) 13 (9.8)
Chronic liver disease 10 (7.5)
Chronic lung disease 12 (9.0)
Steroid or immunosuppressive therapy 8 (6.0) Initial mode of RRT (PD/hemodialysis) 93/40 (69.9/30.1)
NOTE. Values expressed as median (range) for numerical variables or number of cases (percent) for categorical variables.
In a randomly selected group (n = 37) of patients starting PD therapy, we collected dialysate samples after a 12-hour dwell during their second week of PD therapy and, when possible, again at the end of the first year. We estimated anti-αGal and APA levels in these samples.
Strategy of Analysis
The study had a 4-fold objective: (1) to define basic demographic features of anti-αGal and APA in patients starting RRT and the time course of serum levels of these antibodies during the first year of dialysis therapy, with a specific interest in comparing effects of PD and hemodialysis; (2) to disclose potential correlations between baseline serum anti-αGal and APA levels and levels of selected inflammatory, nutritional, and anemia markers; (3) to analyze correlations of anti-αGal and APA levels with PD-related peritonitis, answering to a double-sense question: First, do serum or dialysate anti-αGal and/or APA levels predict the later incidence of peritonitis (overall) or enteric peritonitis during PD therapy? Second, do patients with peritonitis during their first year of PD therapy present a different time-course of anti-αGal or APA levels?; and (4) to assess the correlation between baseline serum levels of anti-αGal/APA and mortality during the course of RRT.
Definition of Variables
Laboratory Methods
Measurement of anti-αGal antibodies by enzyme-linked immunoassay.20 Microtiter plates were coated with 50 μg/well of αGal(1-3)βGal(1-4)GlcNAc linked to human serum albumin (5 μg/mL; Dextra Labs, Reading, UK) in 0.1 M of carbonate buffer, pH 9.6, overnight at 4°C. Coated plates were blocked with 200 μL/well of 0.5% Tween/phosphate-buffered saline (PBS; Sigma-Aldrich Lab, Steinheim, Germany) for 1 hour at room temperature. After washing, duplicate dilutions of serum prepared with 0.5% Tween/PBS, ranging from 1:2.5 to 1:320 or 1:10 to 1:1280, were pipetted (50 μL/well) to the antigen-coated wells and into uncoated blank wells serving as controls for nonspecific antibody binding. After incubation for 1 hour at room temperature, plates were washed 6 times with 0.1% Tween/PBS and incubated with horseradish peroxidase–labeled goat F(ab′)2 antihuman immunoglobulin G (IgG; γ chain specific) or IgM (μ chain specific; Sigma, St Louis, MO) at 1:200 in 0.5% Tween/PBS for 1 hour at room temperature. After 6 washes with 0.1% Tween/PBS, the plate was developed with a solution of orthophenylene diamine (Sigma), prepared according to the manufacturer’s instructions, and quenched with 1 m of H2SO4 before
reading absorbance at 492 nm. Anti-αGal IgG or IgM levels in different assays were normalized by comparison to a pool of human sera provided by the local blood bank, set at 1,000, which was included in all assays.
APA measurement.20 Clotted blood samples were spun for 5 minutes at 3,000 rpm at 4°C. Sera then were collected, transferred into Eppendorf tubes, and heat inactivated at 56°C for 30 minutes. Subsequently, each serum was diluted serially in a 96-well plate with complement fixation diluent (ICN, Costa Mesa, CA) from 1:2.5 to 1:1280. After the addition of rabbit complement (Serotec, Oxford, UK) and 1% porcine red blood cells, plates were placed in an orbital incubator at 37°C for 1 hour and centrifuged for 10 minutes. Next, 100 μL of supernatant from each well was transferred into reading plates. The reading was performed using a Labsystems Multiskan Plus (Labsystems, Helsinki, Finland) at a wavelength of 420 nm. Mean absorbance of the 2 replicates was calculated for each dilution and expressed in area under the curve units, considering the number of area under the curve units of the pool of human control serum as equal to 1,000.
The APA assay provides information about functional properties of antibodies, detecting rabbit complement-fixing antibodies that bind to porcine red blood cells. In normal conditions, anti-αGals are the main, but not only, natural antibodies responsible for the result of this assay.
Other Laboratory Methods
Coefficients of variation (SD/mean) of main laboratory variable estimations were 0.83 (anti-αGal IgG), 0.84 (anti-(anti-αGal IgM), and 0.87 (APA). PD dialysate samples underwent concentration (×5) using Millipore Amicon Ultra-4 centrifugal filter devices (PL-10, 10,000 NMWL; Millipore, Billerica, MA) before estimation of anti-αGal and APA levels. Hemoglobin, albumin, prealbumin, urea, and creatinine levels were estimated by using standard autoanalyzers. Residual renal function was calculated after 24-hour urine collections as the mean of urea and creatinine clearances. hs-CRP level was estimated by means of immunoturbidimetry (Roche Diagnostics, Mannheim, Germany). Serum IL-6, TNF-α, and ICAM levels were estimated by means of enzyme-linked immunosorbent assay (R&D Systems, Minneapolis, MN).
Statistical Analysis
of anti-αGal and APA levels were explored according to multiple regression and logistic regression (anemia) analysis. Analysis of mortality or survival to the first episode of peritonitis (overall or enteric) was carried out by using the Kaplan-Meier method (comparisons by means of log-rank test; univariate) and Cox model (multivariate). Patients were censored at renal transplantation or loss to follow-up and, in the case of peritonitis risk analysis, also in case of death or switch to hemodialysis therapy. SPSS 12.0 software (SPSS Inc, Chicago, IL) was used to produce statistical analysis.
RESULTS
Baseline
Baseline serum anti-αGal and APA levels showed wide variability (Table 2), but were interrelated significantly: anti-αGal IgG-anti-αGal IgM (r = 0.44; P < 0.001), anti-αGal IgG-APA (r = 0.40; P = 0.001), and anti-αGal IgM-APA (r = 0.70; P < 0.001).
Table 2. Main Baseline Laboratory Variables
Anti-αGal IgG* 359 (13-1,898)
Anti-αGal IgM* 331 (21-2,463)
Anti-APA* 712 (27-4,141)
Albumin (g/dL) 3.6 (2.1-4.6)
Prealbumin (mg/dL) 31 (9-61)
Hemoglobin (g/dL) 10.1 (6.4-15.0)
EPO dose (U/wk)†† 4,000 (0-12,000)
hs-CRP (mg/L) 7 (1.2-85)
IL-6 (pg/mL) 5.0 (0.0-101.0)
TNF-α (pg/mL) 6.0 (0.1-15.7)
ICAM (ng/mL) 269 (21-882)
Mean renal clearance (mL/min) 6.1 (0-12.6)
NOTE. Values expressed as median (range). To convert albumin and hemoglobin in g/dL to g/L, multiply by 10; renal clearance in mL/min to mL/s, multiply by 0.01667.
* Dimensionless.
† In patients treated with darbepoetin, 1 μg:200 units equivalence was applied.
There were trends to greater anti-αGal IgM (median, 375 versus 282; P = 0.03, Mann-Whitney) and APA levels (median, 841 versus 661; P = 0.09) in women than men (anti-αGal IgG, not significant [NS]). We also observed a weak trend to an inverse correlation between age and APA level (r = −0.18; P = 0.04). Conversely, we did not detect a correlation between any of the following clinical markers and baseline serum anti-αGal or APA levels: underlying disease, Charlson score, diabetes, mode of dialysis (intention to treat), malnutrition by means of Subjective Global Assessment, cardiovascular comorbidity, chronic liver or lung disease, or current treatment with steroids or immunosuppressants at the start of RRT, either on univariate or multivariate analysis.
Time Course of Anti-αGal and APA Levels
Eighty-one patients completed a minimum follow-up of 1 year and had a second estimation of anti-αGal and APA levels at this time. Reasons for dropping out during the first year included death (n = 16), renal transplantation (n = 20), change in dialysis mode (n = 6), and loss to follow-up or failure to obtain a second estimation of antibodies (n = 10).
Median values (dimensionless) at the end of the first year were 372 (range, 8 to 2,237) for anti-αGal IgG, 277 (range, 20 to 3,228) for anti-anti-αGal IgM, and 775 (range, 59 to 6,976) for APA. Again, both variables were interrelated significantly: anti-αGal IgG–anti-αGal IgM (r = 0.46; P < 0.001), anti-αGal IgG-APA (r = 0.39; P = 0.002), and anti-αGal IgM-APA (r = 0.81; P < 0.001).
APA levels tended to increase from baseline to the end of the first year (median, 551 to 775; P
= 0.04), whereas anti-αGal IgG and IgM levels remained essentially stable. There were strong correlations between baseline and 1-year levels of anti-αGal IgG (r = 0.86; P < 0.001), anti-αGal IgM (r = 0.81; P < 0.001), and APA (r = 0.64; P < 0.001). Bland-Altman plots showed a high degree of concordance between baseline and 1-year anti-αGal levels, although this concordance was lower in patients with highest serum levels (Fig 1).
Whereas anti-αGal and APA levels remained essentially stable in elderly patients, there were trends to an increase in APA (P = 0.009) and anti-αGal IgM (P = 0.09) levels from baseline to the end of the first year in younger patients (<60 years; anti-αGal IgG, NS). Neither PD nor hemodialysis patients presented a significant change in αGal or APA levels, but both anti-αGal IgM (median, 260 versus 463 units; P = 0.03) and APA levels (632 versus 990 units; P = 0.09) tended to be lower in PD patients than hemodialysis patients at the end of the first year (anti-αGal IgG, NS).
Anti-αGal and APA Levels in Dialysate (PD Patients)
Baseline median dialysate levels were 37 (range, 0 to 1,010; anti-αGal IgG), 33 (range, 0 to 317; anti-αGal IgM), and 84 (range, 11 to 344; APA). These 3 variables were interrelated in a similar way to serum levels: anti-αGal IgG–anti-αGal IgM (r = 0.36; P = 0.07), anti-αGal IgG-APA (r = 0.25; P = 0.20), and anti-αGal IgM-APA (r = 0.44; P = 0.03). Dialysate levels also correlated significantly with simultaneous serum levels: anti-αGal IgG, r = 0.53 (P = 0.008); anti-αGal IgM, r = 0.46 (P = 0.03); and APA, r = 0.38 (P = 0.05).
We obtained new dialysate samples at the end of the first year for 20 patients, and median anti-αGal levels were 30 (range, 0 to 868; anti-anti-αGal IgG), 32 (range, 0 to 136; anti-anti-αGal IgM), and 74 (range, 15 to 285; APA; NS versus baseline).
Correlation With Other Laboratory Markers
Baseline correlations of anti-αGal and APA levels with the selected nutritional, inflammatory, and anemia markers are listed in Table 3. There was a trend to a direct correlation between anti-αGal IgM and APA and simultaneous TNF-α levels. Conversely, we observed no association between serum natural antibody or APA levels and those of hs-CRP, IL-6, or ICAM.
Table 3. Correlations Between Anti-αGal and APA Levels and Laboratory Markers
Anti-αGal IgG Anti-αGal IgM APA
Albumin −0.02 (0.81) −0.17 (0.05) −0.06 (0.48)
Prealbumin −0.09 (0.37) 0.004 (0.96) −0.02 (0.83)
hs-CRP −0.08 (0.47) −0.16 (0.10) −0.01 (0.96)
IL-6 0.06 (0.51) −0.06 (0.59) 0.09 (0.32)
TNF-α 0.14 (0.14) 0.25 (0.005) 0.30 (0.001)
ICAM 0.04 (0.66) −0.06 (0.56) −0.05 (0.61)
Hemoglobin −0.12 (0.17) −0.07 (0.41) −0.17 (0.05)
EPO dose −0.15 (0.09) −0.08 (0.40) 0.18 (0.04)
Mean renal clearance 0.02 (0.84) −0.14 (0.16) −0.14 (0.18)
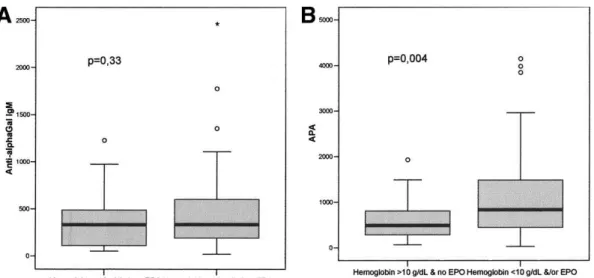
APA levels (but not anti-αGal IgG or IgM levels) correlated directly with severity of anemia (Table 3). Patients with nonsevere anemia had significantly lower baseline serum APA levels than patients with severe anemia (Fig 2; anti-αGal IgM and IgG, NS). Logistic regression analysis identified residual renal function (odds ratio, 0.80 per mL/min; 95% confidence interval [CI], 0.67 to 0.95; P = 0.013) and the higher (odds ratio, 4.78; 95% CI, 1.57 to 14.56; P = 0.006), but not the median (odds ratio, 1.67; 95% CI, 0.56 to 4.96; P = 0.36 versus lower), tertiles of baseline serum APA levels as the main independent predictors of severe anemia at the start of RRT (Charlson score, malnutrition, and other laboratory markers, NS).
Fig 2. Baseline serum (A) anti-αGal IgM and (B) APA levels according to severity of anemia. Comparisons using Mann-Whitney test. To convert hemoglobin in g/dL to g/L, multiply by 10.
Anti-αGal, APA, and Peritonitis in PD Patients
During the study period, we recorded 74 episodes of infectious peritonitis (1 episode every 31.4 patient-months). The etiologic spectrum was similar to that of other studies, with a predominance of gram-positive bacteria (n = 41; 55.4%). Only 51 patients (54.8%) were free of peritonitis at the end of follow-up, whereas 27 patients (29.0%) experienced at least 1 episode of peritonitis, but no enteric peritonitis. Finally, we observed 18 instances of enteric peritonitis (8 episodes, polymicrobial) in 15 patients (16.1%). The first episode of enteric peritonitis occurred a median of 5 months after the start of PD therapy (range, 1 to 29 months); in 11 cases (73.3%), it occurred during the first year of PD therapy. No patient died, but 3 patients were switched to hemodialysis therapy as a direct consequence of enteric peritonitis.
Table 4. Baseline Anti-αGal and APA Levels and Risk for Peritonitis in PD Patients
No Peritonitis Nonenteric Peritonitis Enteric Peritonitis
Anti-αGal IgG serum 361 (13-1,898) 315 (13-1,367) 314 (68-1,367)
Anti-αGal IgM serum 312 (40-2,463) 319 (21-1,227) 612 (57-1,247)*††
APA serum 639 (74-3,839) 764 (67-4,141) 1,169 (92-1,929)*
Anti-αGal IgG dialysate 30 (0-238) 55 (0-1,000) 70 (18-745)
Anti-αGal IgM dialysate 34 (2-317) 31 (0-294) 89 (29-294)*††
APA dialysate 81 (20-208) 99 (11-344) 178 (11-344)‡‡
NOTE. Values expressed as median (range; dimensionless). Comparisons by means of Mann-Whitney test. * P < 0.05 versus no peritonitis.
† P < 0.05 versus nonenteric peritonitis.
‡ P = 0.06 versus no peritonitis. Other differences NS.
We did not detect a different time course of serum or dialysate anti-αGal or APA levels in patients with nonenteric or enteric peritonitis during their first year of PD therapy.
Anti-αGal, APA, and Survival on Dialysis Therapy
Table 5 lists hemodialysis and PD patient status at the end of follow-up. Univariate Kaplan-Meier analysis showed trends to lower survival in patients with the higher tertiles of APA (P = 0.002 versus lower tertile) and anti-αGal IgM levels (P = 0.08 versus lower tertile), but not anti-αGal IgG levels (Fig 4). Multivariate analysis confirmed these trends, indicating that both baseline serum APA and anti-αGal IgM levels were independent predictors of risk for mortality (Table 6). This association persisted after controlling for clinical, inflammatory, and nutritional markers. Lack of statistical power hampered in-depth exploration of whether this association could be restricted to specific causes of death, but Kaplan-Meier analysis suggested similar trends for cardiovascular and noncardiovascular mortality.
Table 5. Patient Status at the End of Follow-Up
PD (n = 93) Hemodialysis (n = 40)
Follow-up (mo) 25 (2-60) 32 (3-72)
Still on same mode of dialysis 25 (26.9) 15 (35.0)
Switch to another modality 8 (8.6) 1 (2.5)
Renal transplant 26 (28.0) 11 (27.5)
Loss to follow-up 3 (3.2) 2 (5.0)
Death 31 (33.3) 11 (27.5)
Cardiovascular 14 (45.2) 6 (54.5)
Infectious 3 (9.7) 0 (0)
Dementia/failure to thrive 4 (12.9) 2 (18.2)
Other/multifactorial 7 (22.6) 2 (18.2)
Uncertain 2 (6.5) 1 (9.1)
Fig 4. Patient survival according to tertile of baseline (A) anti-αGal IgG, (B) anti-αGal IgM, and (C) APA levels. Comparisons using log-rank test.
Table 6. Patient Survival According to Baseline Serum Anti-αGal and APA Levels, Multivariate
Anti-αGal IgG Model Chi-Square = 39.0; P < 0.0005
Anti-αGal IgM Model Chi-Square = 41.4; P < 0.0005
APA Model Chi-Square = 43.7; P < 0.0005
Charlson score (per
point) 1.41 (1.15-1.73) P < 0.001 1.35 (1.15-1.59) P < 0.001 1.41 (1.17-1.70) P < 0.001
IL-6 (per pg/mL) 1.03 (1.01-1.05) P = 0.008 1.04 (1.02-1.06) P < 0.001 1.03 (1.01-1.05) P = 0.002
Albumin (per g/dL) 0.93 (0.87-0.98) P = 0.023 Out of model 0.95 (0.89-1.00) P = 0.05
Anti-αGal/APA (per
tertile) 1.15 (0.75-1.77) P = 0.53 1.71 (1.11-2.71) P = 0.014 1.67 (1.06-2.63) P = 0.021
DISCUSSION
Our results confirm the notion that serum anti-αGal and APA levels show wide variability between patients starting RRT, as previously shown in healthy people21 and individuals awaiting renal transplantation.22 Moreover, these levels appear to be relatively stable in time, shown by the strong correlation and high degree of concordance (Fig 1) between baseline and 1-year anti-αGal levels. Only APA levels increased slightly after 1 year of dialysis therapy, at the expense of younger patients. Conversely, the only apparent, yet weak, demographic correlates of anti-αGal levels in our study were sex and age. Anti-αGal IgM levels previously were reported to be greater in women among healthy individuals,21 whereas older patients previously were claimed to present greater serum levels of low-affinity anti-αGal than younger patients.23 As a final comment to the demographic analysis in our study, we emphasize that sample size limits the significance of negative data in specific subsets (eg, patients on immunosuppressive therapy).
Recurrent lavage of B1 cells, which may be located preferentially in the peritoneal cavity,7,8,9, 10, 11, 12 could have a potential impact on the time course of serum anti-αGal levels during PD
therapy. However, we did not observe a significant difference between the time course of serum anti-αGal or APA levels in patients undergoing PD or hemodialysis. A previous study of humans24 showed that long-term PD treatment results in a 50% decrease in numbers of B lymphocytes (including B1) in the peritoneal cavity, without an apparent impact on total serum or salivary
immunoglobulin levels (αGal levels were not specifically scrutinized). In our study, both anti-αGal IgM and APA levels tended to be lower in PD patients after 1 year of RRT, but this may be the consequence in part of selection bias because PD patients with greatest levels of these 2 markers were more likely to abandon PD therapy during the first year because of their increased risk for enteric peritonitis.
Our study indicates that nutritional status of uremic patients does not influence significantly serum anti-αGal or APA levels. Neither of these antibodies appears to correlate clearly with well-known markers of inflammation, although we were able to detect a moderate direct correlation between APA and anti-αGal IgM levels on one side and TNF-α levels on the other. It is widely accepted, but unproved, that continuous contact between the human organism and gram-negative resident intestinal bacteria triggers anti-αGal synthesis.13, 20 However, it presently is unclear whether recurrent intestinal transmigration of bacteria may contribute to the inflammatory status of some dialysis patients or, alternatively, inflammatory states may have a detrimental effect on the competence of the intestinal barrier in a way similar to the case of critical patients,25 thus favoring the interaction between the immune system and intestinal bacteria. Results of our study do not contribute to clarify this point.
Our study shows a significant correlation between APA (but, interestingly, not anti-αGal IgM or IgG) levels (Fig 2) and severity of anemia in patients starting RRT, indicating that the hemolytic activity of these antibodies may be clinically significant in these patients. Anti-αGals were implicated in the clearance of senescent or abnormal erythrocytes,15 but discordant correlations between anti-αGal IgM and APA levels (which usually correlate closely) on one side and severity of anemia on the other suggest that a non–anti-αGal fraction of APA-related natural antibodies may be involved in the genesis of anemia of our patients. Our laboratory recently showed that these non–anti-αGal APA–related antibodies are polyreactive and able to recognize both pig and human cells (R.M., N.D.; unpublished data). However, similar to the case of inflammatory markers, evidence provided by our study is far from conclusive, and additional studies are necessary to confirm and interpret these correlations.
A remarkable finding of our study is the consistent ability of serum anti-αGal IgM and APA levels to predict mortality in patients starting RRT. This effect persisted after controlling for a comprehensive (age, diabetes, comorbidity) prognostic marker, such as Charlson score and IL-6 and albumin levels (Table 6). Our data also indicate similar risk for cardiovascular and noncardiovascular mortality, although cardiovascular disease had either a direct or permissive role in the majority of deaths. We do not have a clear explanation for these findings. High anti-αGal and APA levels could be simple bystanders in poor-quality patients, but if this is the case, a baseline association of anti-αGal/APA levels with Charlson score and markers of malnutrition and inflammation should be expected. The moderate correlations found with TNF-α levels and anemia (Table 3) could be clues to this type of relationship, but anti-αGal and APA could have a potential pathogenic role in these associations. Enteric peritonitis is another putative pathway to mortality in patients with high baseline serum anti-αGal IgM and APA levels. It is true that no patient died as a direct consequence of these infections; however, their debilitating effects could contribute to later mortality in some cases. However, the possibility that high anti-αGal and APA levels may be directly pathogenic cannot be ruled out. The physiopathologic characteristics of these antibodies remain unknown for the most part, but their potential roles in inhibition of complement-mediated clearance of intestinal bacteria,14 anemia,15 and autoimmune disease16,17 suggest they potentially may be pathogenic, at least under certain concentrations or conditions. The last hypothesis clearly is speculative, but in the last years, there has been renewed interest in the potential role of natural antibodies in the pathogenesis of several diseases, including disorders of early defense against microbial disease,26 autoimmunity, and atherosclerosis.27
In conclusion, serum anti-αGal IgM and APA levels at the start of RRT are associated significantly with risk for mortality and, in PD patients, enteric peritonitis during follow-up. Also, these antibodies correlate directly with serum TNF-α levels and, in the case of APA, severity of anemia in these patients. Additional studies are warranted to clarify the significance of these findings.
REFERENCES
1. Galili, U., Shohet, S.B., Kobrin, E. et al. Man, apes and Old-World monkeys differ from other mammals in the expression of alpha-galactosyl epitopes on nucleated cells. J Biol Chem. 1988; 263: 17755–17762
2. Janeway, C.A. and Medzhitov, R. Innate immune recognition. Annu Rev Immunol. 2002; 20: 197–216
3. Galili, U., Anaraki, F., Thall, A. et al. One percent of human circulating B lymphocytes are capable of producing the natural anti-Gal antibody. Blood. 1993; 8: 2485–2493
4. Bracy, J.L., Cretin, N., Cooper, D.K., and Iacomini, J. Xenoreactive natural antibodies. Cell Mol Life Sci. 1999; 56: 1001–1007
5. Hamadeh, R.M., Galili, U., Zhou, P., and Griffiss, J.M. Anti-α-galactosyl immunoglobulin A (IgA), IgG and IgM in human secretions. Clin Diagn Lab Immunol. 1995; 2: 125–131 6. Cooper, D.K.C. Xenoantigens and xenoantibodies. Xenotransplantation. 1998; 5: 6–17 7. Marcos, M.A.R., Huetz, F., Pereira, P. et al. Further evidence for coelomic-associated B
lymphocytes. Eur J Immunol. 1989; 19: 2031–2035
8. Klinman, D.M. and Holmes, K.L. Differences in the repertoire expressed by peritoneal and splenic Ly-1 (CD5)+ B cells. J Immunol. 1990; 144: 4520–4525
9. Lalor, P.A. and Morahan, G. The peritoneal Ly-1 (CD5) B cell repertoire is unique among murine B cell repertoires. Eur J Immunol. 1990; 20: 485–492
10.Marcos, M.A.R., Gaspar, M.L., Malenchere, E., and Coutinho, A. Isolation of peritoneal precursors of B-1 cells in the adult mouse. Eur J Immunol. 1994; 24: 1033–1040 11.Nisitani, S., Murakami, M., Akamizu, T. et al. Preferential localization of human CD5+ B
cells in the peritoneal cavity. Scand J Immunol. 1997; 46: 541–545
12.Kawahara, T., Ohdan, H., Zhao, G. et al. Peritoneal cavity B cells are precursors of splenic IgM natural antibody-producing cells. J Immunol. 2003; 171: 5406–5414
13.Galili, U., Mandrell, R.E., Hamadeh, R.M. et al. Interaction between human natural anti-α-galactosyl immunoglobulin G and bacteria of the human flora. Infect Immun. 1988; 56: 1730– 1737
15.Galili, U., Flechner, I., Knyszynski, A. et al. The natural anti-α-galactosyl IgG on human normal senescent red blood cells. Br J Hematol. 1986; 62: 1–4
16.Gabrielli, A., Leoni, P., Davieli, G. et al. Antibodies against galactosyl α(1–3)galactose in connective tissue diseases. Arthritis Rheum. 1991; 34: 375–376
17.Galili, U., Wang, L., LaTemple, D.C., and Radic, M.Z. The natural anti-Gal antibody. Subcell Biochem. 1999; 32: 79–106
18.Pérez Fontán, M., Mañez, R., Blanco, F., and Rodríguez-Carmona, A. Natural anti-α-galactosyl antibodies in patients undergoing peritoneal dialysis and haemodialysis. Adv Perit Dial. 2000; 16: 216–218
19.Charlson, M.E., Pompei, P., Ales, K.L., and McKenzie, C.R. A new method of classifying prognostic comorbidity in longitudinal studies: Development and validation. J Chronic Dis. 1987; 40: 373–383
20.Mañez, R., Blanco, F.J., Díaz, I. et al. Removal of bowel anaerobic gram-negative bacteria is more effective than immunosuppression with cyclophosphamide and steroids to decrease natural α-galactosyl IgG antibodies. Xenotransplantation. 2001; 8: 15–23
21.Buonomano, R., Tinguely, C., Rieben, R. et al. Quantitation and characterization of anti-Gal-α-1,3-Gal antibodies in sera of 200 healthy persons. Xenotransplantation. 1999; 5: 173–180 22.Díaz, I., Veira, P., Valdés, F. et al. Quantitation and comparison of anti-Gal-α-1,3-Gal
antibodies in sera of healthy individuals and patients waiting for kidney transplantation. Transplant Proc. 2003; 35: 2043–2044
23.Wang, L., Anaraki, F., Henion, T.R., and Galili, U. Variations in activity of the human natural anti-Gal antibody in young and elderly populations. J Gerontol A Biol Sci Med Sci. 1995; 50: 227–233
24.Donze, H.H., Lue, C., Julian, B.A. et al. Human peritoneal B-1 cells and the influence of continuous ambulatory peritoneal dialysis on peritoneal and peripheral blood mononuclear cell (PBMC) composition and immunoglobulin levels. Clin Exp Immunol. 1997; 109: 356– 361
25.Fink, M.P. Intestinal epithelial hyperpermeability: Update on the pathogenesis of gut mucosal barrier dysfunction in critical illness. Curr Opin Crit Care. 2003; 9: 143–151
26.Ochsenbein, A.F., Fehr, T., Lutz, C. et al. Control of early viral and bacterial distribution and disease by natural antibodies. Science. 1999; 286: 2156–2159