Study of the cycle-to-cycle variations of an internal
combustion engine fuelled with natural gas/
hydrogen blends from the diagnosis of combustion
pressure
M. Reyes
a,*
, A. Melgar
a, A. Pe´rez
b, B. Gime´nez
aaDepartment of Energy and Fluid Mechanics Engineering, University of Valladolid, Paseo del Cauce 59, E-47011
Valladolid, Spain
bCIDAUT Foundation, Parque Tecnolo´gico de Boecillo, P. 209, Boecillo, E-47151 Valladolid, Spain
a r t i c l e i n f o
Article history: Received 29 April 2013 Received in revised form 9 September 2013
Accepted 13 September 2013 Available online 9 October 2013
Keywords: Cyclic variations Spark ignition engine Combustion diagnosis Alternative fuels Genetic algorithm
a b s t r a c t
A methodology is presented for studying the influence of using alternative fuels on the cycle-to-cycle variations of a spark ignition engine which has been fuelled with mixtures of natural gas and hydrogen in different proportions (0e100%). The experimental facility consists of a single-cylindrical spark ignition engine coupled to an asynchronous machine with a constant engine rotation speed of 1500 rpm. A thermodynamic combustion diag-nostic model based on genetic algorithms is used to evaluate the combustion chamber pressure data experimentally obtained in the mentioned engine. The model is used to make the pressure diagnosis of series of 830 consecutive engine cycles automatically, with a high grade of objectivity of the combustion analysis, since the relevant adjustment pa-rameters (i.e. pressure offset, effective compression ratio, top dead center angular position, heat transfer coefficients) are calculated by the genetic algorithm. Results indicate that the combustion process is dominated by the turbulence inside the combustion chamber (generated during intake and compression), showing little dependency of combustion variation on the mixture composition. This becomes more evident when relevant com-bustion variables are plotted versus the Mass Fraction Burned of each mixture. The only exception is the case of 100% hydrogen, due to the inherent higher laminar speed of hydrogen that causes combustion acceleration and thus turbulence generation.
Copyrightª2013, Hydrogen Energy Publications, LLC. Published by Elsevier Ltd. All rights reserved.
1.
Introduction
Because of the increasing concern about energy deficiency and environmental defence, much effort has been focused on the use of alternative fuels in internal combustion engines (ICE). Alternative fuels are clean, when compared to
conventional ones derived from petroleum in ICE. Natural gas (NG) is considered to be a probable alternative fuel due to its properties and higher octane number. NG is a mixture of different gases where methane is its main constituent (75e98% of methane; 0.5e13% of ethane; and 0e2.6% of pro-pane[1]). NG combustion causes less emissions than that of
*Corresponding author. Tel.:þ34 630202208.
E-mail addresses:[email protected],[email protected](M. Reyes).
Available online at
www.sciencedirect.com
journal hom epa ge: www.elsev ier.com/locate/he
conventional fuels because the chemical structure of NG is less complicated, together with the non-existence of evapo-ration phase of the fuel[2]. The high octane number of NG (between 120 and 130) allows the engine to operate at more elevated compression ratios, because it gives a high anti-knocking potential[3]. However, NG has a slow burning ve-locity, compared to liquid fuels, which can be solved by mix-ing it with a fuel with a high burnmix-ing velocity such as hydrogen[4]. Hydrogen has also been mixed with gasoline because of its excellent combustion properties[5,6].
Burning velocity of NGehydrogen mixtures varying from 0 to 100% have been carried out for different conditions of pressure and temperature. Huang et al.[7]studied the laminar flame characteristics of NGehydrogen mixtures in a constant-volume combustion bomb at normal temperature and pres-sure (300 K and 0.1 MPa of initial conditions) by using the Schlieren photographic method and a high-speed camera. Their results show that laminar burning velocities increase exponentially with the increase of the percentage of hydrogen in the mixture and they obtained a formula (based on the experimental data) for calculating the laminar burning ve-locity of NGehydrogen mixtures as a function of the equiva-lence ratio and the percentage of hydrogen in the mixture. Hu et al.[8]developed an experimental and numerical study of lean mixtures of NGehydrogen at elevated temperatures and pressures over a wide range of hydrogen percentages in the mixture. In this work the un-stretched laminar burning ve-locities rose with the increase of hydrogen fraction and initial temperature, and decreased with the increase of initial pres-sure (the case in which the flame instability increased because of the decrease of the Markstein number). Hu et al.[9] con-ducted an experimental numerical study on laminar burning velocities of premixed methaneehydrogen mixtures at room conditions of temperature and pressure. They identify three zones on the burning velocity depending on the percentage of hydrogen in the mixture. When the content of hydrogen in the mixture is less than 60% the combustion is dominated by methane; the transition zone where hydrogen percentage is between 60% and 80%; and the methane-inhibited hydrogen combustion zone, where the percentage of hydrogen is greater than 80%. In the first and third zones, the laminar burning velocity increases linearly with the increase of hydrogen percentage in the mixture. However, in the transition zone the increment is exponential.
Cycle-to-cycle variations in spark ignition engines fuelled with mixtures of natural gas and hydrogen have been widely studied[10e14]. Wang et al.[10]studied the effect of hydrogen addition on cycle-by-cycle variations of the natural gas en-gine. Their results showed that the peak cylinder pressure, the maximum rate of pressure rise and the indicated mean effective pressure increased and their corresponding cycle-by-cycle variations decreased with the increase of hydrogen fraction at lean mixture operation. Huang et al.[11]analised the cycle-by-cycle variations in a spark ignition engine fuelled with natural gasehydrogen blends combined with Exhaust Gas Recirculation (EGR). The effects of EGR ratio and hydrogen percentage on engine cycle-by-cycle variations were studied. The results show that cycle-by-cycle variations increase with the increase of EGR ratio. For a given EGR ratio, combustion stability is promoted and cycle-by-cycle variations are
decreased with the increase of hydrogen fraction in the fuel mixtures. Ma et al.[12]conducted an experimental work to investigate the effects of hydrogen addition on the combus-tion behaviour and cycle-by-cycle variacombus-tions in a turbo-charged lean burn natural gas SI engine. They found that hydrogen addition contributes to reducing flame development duration, whose reduction has highly positive effects on keeping down cycle-by-cycle variations. Wang and Ji [13] investigated the cyclic variation characteristics of a hydrogen-enriched gasoline engine, and their results showed that hydrogen addition was more effective in reducing cyclic variation at low loads and the coefficient of variation in indi-cated mean effective pressure (IMEP) decreased with the increment of the percentage of hydrogen in the mixture. Wang et al. [14] studied cyclic variations of natural gas/ hydrogen mixtures in a constant-volume vessel with direct-injection. Their results showed that cyclic variations were initiated at the beginning of the flame development and cyclic variations decreased with the increase of hydrogen addition. Different mixtures of NG and hydrogen have been used as fuel in internal combustion engines in the works previously mentioned[7e14]and in the work of Tinaut et al.[15]where the effect of the addition of hydrogen on the emissions and performance of an engine fuelled with NG is analised.
The experimental study of the combustion process in in-ternal combustion engines through combustion chamber pressure analysis is frequently used to accurately know the evolution of thermodynamic variables, such as temperature, heat release, turbulent combustion speed, etc. These studies are focused on the improvement of thermal efficiency and reduction of pollutant emissions.
Depending on the aim of the combustion study, different kinds or categories of models can be proposed. If the detailed effects of geometry are not considered to be necessary, zero-dimensional models (also called thermodynamic models) are widely used[16e18]. In general, these models are structured on a thermodynamic analysis of the contents of the engine cylinder during the engine operating cycle. The output of the model is the heat release rate or the Mass Fraction Burned (MFB) evolution, seeFig. 1.
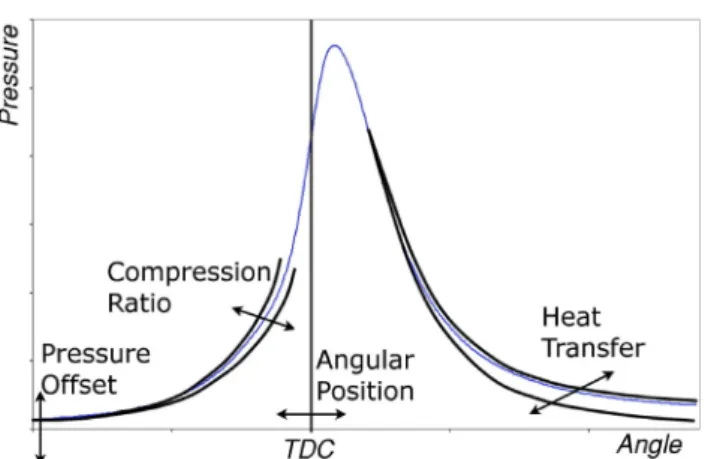
In order to obtain an appropriate diagnosis of the com-bustion based on the analysis of experimental in-cylinder pressure data, some parameters need to be adjusted. These are: pressure offset, angular positioning of the pressure trace, heat transfer through the walls and compression ratio or clearance volume. Pressure offset and angular positioning are directly related to the measuring techniques. Heat transfer can be modelled and the compression ratio can vary slightly from the specifications. The influence of these parameters is schematically shown inFig. 2.
described by Lapuerta[19]and Payri[20]. One of the disad-vantages of the utilization of these kinds of transducers for pressure measurement is that they can only measure pressure variations, thus an absolute pressure can not be obtained directly. This means that a pressure offset correction (also called pressure pegging) is needed in order to obtain an ab-solute value, being this being one of the main problems for this measuring technique[20,21].
Another experimentally related parameter that needs to be adjusted is the angular positioning of the pressure trace. Normally pressure signal is acquired synchronized with an angular encoder, in general a crankshaft angular basis is preferred than a time basis. The positioning of the reference relative to the top dead center (TDC) of the encoder reference signal (usually one pulse per revolution) is not easy. Martin [22]estimates that an error of2 crank angle degrees is usu-ally obtained when the encoder is attached. The issue is to correctly locate the position of TDC [19,20,23] in order to calculate the correct volume for each pressure data acquired using a correct angular position and compression ratio.
Heat transferred through the walls is usually calculated using Woschnis’s model[24]. Heat losses can represent up to 20% of the heat released[25]. Due to this fact, an accurate heat loss estimation is necessary in order to adjust the calculated heat released, i.e. the amount of energy released by the fuel. A calibration of Woschni’s heat transfer coefficient is usually done to obtain a correct diagnosis of combustion[26].
Normally all of these parameters are adjusted by different methodologies or, in many cases, based on the researcher’s experience. In the present paper a more objective new adjusting method is proposed, based on a genetic algorithm strategy in order to ensure an optimal adjustment.
Genetic algorithms were first introduced by Holland[27]. These algorithms belong to a group of heuristic mathematical techniques generally used to solve optimization problems, which are known as evolutionary algorithms. Since its intro-duction, genetic algorithms have been widely used to solve diverse optimization problems in different fields of thermo-dynamic and fluid science[28,29], proving to be a powerful tool to solve complex problems.
As an application of the model presented in this paper, a study of cycle-to-cycle variation in a spark ignition engine is carried out. This phenomenon is inherent to this kind of en-gine[25]and has been widely studied. Many studies have been carried out in order to find out the main causes of this effect [30,31]. Cycle-to-cycle variations are considered to be caused by dispersions in the flame speed, combustion duration and turbulence [32]. The effect of cyclic dispersion is also
described and studied by Litak et al. [33,34]using statistical treatments (such as histograms, return maps and recurrence plots) of pressure data and heat release. These variations result in a diminution of up to 20% in the mean effective tor-que[35].
Cyclic dispersion can be evaluated by statistical processing of the maximum pressure (pmax) and the angle at which the maximum pressure is reachedðapmaxÞ[36]. It has been studied with the variation in heat released during combustion[37,38], and by using continuous wavelet transform to analise Indi-cated Mean Effective Pressure (imep) time series[39]. Recently it also has been studied in Homogeneous Charge Compression Ignition (HCCI) engine processes[40,41], using complex CFD simulations [42] and using zero-dimensional predictive models based on stochastic estimation of the physically relevant parameters[43].
The authors have developed a diagnostic model, with temperature dependent thermodynamic properties and consideration of heat losses, to perform an analysis of engine combustion pressure. In combination with a procedure based on genetic algorithms, the diagnostic tool can eliminate the subjectivity (or bias) introduced by the operator in obtaining results and to increase the analysis capability to using hun-dred of. In the work, six series of 830 consecutive engine pressure cycles have been analysed, obtaining the combustion diagnosis of each cycle. The study of the cyclic variability is carried out first by using traditional parameters, such as the coefficient of variation of the imep between others. In second place, this study is also carried out by considering the values of the deviation of the Mass Fraction Burning Rate (MFBR) as a function of the Mass Fraction Burned (MFB).
The principal objective of this work is to obtain an esti-mation of the influence of the percentage of hydrogen in the fuel mixture in a single-cylinder spark ignition engine on the cycle-to-cycle variations by means of a thermodynamic combustion diagnostic model which uses genetic algorithms to adjust the experimental correction factors. Mixtures of natural gas and hydrogen in six different proportions (100, 60, 40, 20, 0% of hydrogen in volume) with a fuel/air equivalence ratio of 0.7 are used as fuel in the engine studied.
2.
Methodology
2.1. Experimental apparatus and procedure
designed as a compression ignition engine. A few changes were made to transform it into a spark ignition engine. The original injector was substituted for a spark plug and a modification in the piston was made in order to transform the combustion chamber and reduce the original compression ratio. The specifications of the cylinder are: 80 mm bore, and 75 mm stroke.
This engine was coupled to a 5.5 kW LEROY SOMER asyn-chronous machine that was used as cranker and brake. The engine has been instrumented for the measurement of mean engine performance values to determine when it is stabilized, such as, intake and exhaust pressures, and intake, exhaust, cylinder head and oil temperatures. When the engine is sta-bilized in the certain operating point, the instantaneous pressure in the combustion chamber is registered and stored in the digital oscilloscope. Imep at each operating point is then calculated from the instantaneous pressure plot.
Engine rotational speed was maintained at 1500 rpm and intake pressure was set at 0.5 bar, while the angle of spark ignition was set to obtain the maximum brake torque for each fuel composition. Six different fuel mixtures composed of different proportions of hydrogen and NG with a fixed fuel/air
equivalence ratio4of 0.7 have been tested. A schematic dia-gram of the test facility is presented inFig. 3.
2.1.1. Cylinder pressure measurement
In the experimental setup, the pressure inside the cylinder was measured by using a piezo-electric sensor AVL GU21D (maximum calibration error of 0.06%). This sensor was con-nected to a KISTLER 5018A1000 charge amplifier (maximum calibration error of 0.3%). The output signal of the charge amplifier was recorded on a Yokogawa DL750 Scopecorder (16 bits AD converter). The estimated error of the pressure acqui-sition is 0.36% over the measuring range. The crankshaft angle was measured using a free end AVL 360C.03 angular encoder. This encoder has 600 marks per revolution: i.e. a 0.6 degrees resolution and also a single pulse per revolution signal. In order to synchronize the pressure signal with the crankshaft angle, the option of an external clock was activated in the Scopecorder.
2.1.2. Mass flow set and measurement
The fuel used during the experiments was a mixture of hydrogen and NG. The inlet mixture of hydrogen/NG and air was established with two BROOKS thermal mass flow con-trollers. These kinds of controllers are equipped with a pro-portional valve and an actuator. Therefore, the mass flow rate could be measured and controlled at once. A 5853S model was used for the air and two 5851S models were used for the NG and hydrogen. The mixture of the NG, hydrogen and air was formed in the intake port.
2.2. Models employed
2.2.1. Thermodynamic model for combustion analysis The one-zone, zero-dimensional thermodynamic model used is designed to perform the analysis (or diagnosis) of premixed combustion. The model solves the energy conservation equation during the closed valves phase interval. As it is a diagnostic model, pressure is the input of the model, whereas MFB, imep,pmaxandamaxcan be calculated.Equation (1)is a form of the energy equation discretized between two Fig. 2ePressure trace parameters that have to be adjusted
in order to obtain an appropriate pressure analysis.
consecutive data points. Since pressure acquisition is gov-erned by the marks of the angular encoder, data points are separated by 0.6 crank angle degrees. For a constant engine speed of 1500 rpm data points they are separated by an in-terval of time (Dt) of 66.7ms. The ideal gas state equation, Equation (2), is used to calculate the temperature at each data point. Additionally the total volume of the combustion chamber is a function of the crank angle (for each data point) and the geometric values of crank radius and connecting rod.
UjUj1¼Q_WOS$Dt pjþpj1
2
VjVj1
(1)
pjVj¼mRgjTj (2)
Vj¼V
aj
(3)
Uis total internal energy,pis the pressure,Vis the volume,Tis the mean absolute temperature,Rgis the ideal gas constant
referred to engine contents, andm the total mass, assumed constant because the leakage flow is neglected and the model is executed within the closed valves interval.Q_wosis the mean heat transfer flux through the walls, calculated using Woschni’s heat transfer coefficient (seeEquation (6)later). The subscriptjrefers to a time point, whilej1 refers to the previous one.
Previous equations are solved using the following procedure: pressure is known at all angles. The initial composition of the unburned mass is a mixture of fresh intake mass (air and gaseous fuels), determined by the mass flow meters data, and an estimated mass of residuals. The composition of the final burned mass is calculated assuming a complete combustion and is the same for the residuals. The quantity of the residuals inside the cylinder is determined with a predictive model which simulates the processes of intake and exhaust from data of the intake and exhaust temperatures and the geometry of the engine[15].
The mean temperature is calculated by the ideal gas state equation,Equation (2). Internal energy is calculated with the Equation (5), as a function of the composition and tempera-ture, where the specific internal energies per unit massuband uu(subscript b is for burned and u for unburned) are calculated with the correlations published by the NIST[44]where sen-sible and formation energy are included and weighted with the species composition.
MFBðaÞ ¼mbðaÞ
m (4)
UðTÞ ¼mðMFB$ubðTÞ þ ð1MFBÞ$uuðTÞÞ (5) In order to calculate the values of variables at timejonce the values at timej1 are known, an increment of burned mass is assumed (Dmb). An error in terms of energy is computed by Equation (1). This is iteratively solved to adjust the increment of burned mass to satisfy the conservation energy equation.
Heat transferred through the walls is computed by means of Woschni’s expression as is shown inEquation (6).
h¼kwos$0:013$dp0:2$p0:8$T0:53
2:28cmþ0:00324
VdTic pic
ppm
0:8
(6)
wherehis the coefficient of heat transfer,dpis the diameter of
the piston,cmis the mean piston speed.Tic,picare the tem-perature and pressure when the intake valve closes andpmis
the motored engine pressure. The parameter kwos is the multiplier that has to be adjusted.
2.2.2. Genetic algorithm
In order to successfully process the pressure data with the thermodynamic model the parameters such as pressure offset, crank angle positioning, compression ratio and kwos should be correctly adjusted. To solve these issues, the au-thors have implemented a genetic algorithm, so the adjust-ment of the parameters is performed automatically.
Genetic algorithms have been widely used to solve many different kinds of scientific matters. These algorithms are based on Darwin’s Theory of Evolution. The key evolution mechanism is natural selection: that is, the best adapted in-dividuals are selected to survive and to be the progenitors of the next generation. Thus by this selection, the best genetic combination is transmitted to the next generation of in-dividuals. This procedure, repeated over several generations, ends with a new, highly-adapted individual.
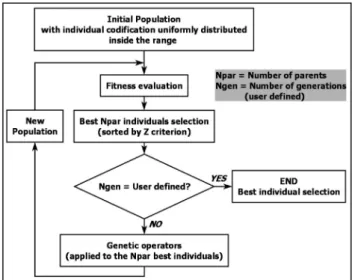
The method used in this paper is specifically programmed to obtain the most accurate combustion diagnosis for each engine cycle. The concepts of individual, genetic information, codification, selection and fitness evaluation that are common in genetic algorithms have their counterparts in the presented model, seeFig. 4andTable 1.
The genetic algorithm is used to obtain the best combina-tion of diagnostic parameters for each cycle. This ensures that the best determination of MFB is obtained for each cycle. Normally the parameters vary inside a range determined by the user. This range can be a single value, as in this case where the parameter is fixed.
The amount of individuals of the population is Npar2 ob-tained by all the possible pairs of Nparindividuals. For the formation of the initial population, the individual codification ofNparindividuals is a combination of the uniformly distrib-uted values within the range of variation of each diagnostic parameter defined by the user. The crossover function is applied to these individuals in order to obtain the initial population. The genetic algorithm model has been verified
doing a diagnostic of an ideal pressure curve obtained from a predictive model.
2.2.2.1. Zfunction.The criteria to select the best adapted in-dividuals is done using the fitness functionZ, Equation (7), which is applied to the MFB trace calculated with the diag-nostic model for each individual codification. TheZfunction evaluates that there is no energy released during the compression and during the expansion phases, so that, it must be maximized (this is similar to the method proposed by Tunestal[45]). An extra criterion is added in order to take into account the average final value of Mass Fraction Burned (MFBf)
during the expansion, which is calculated when the com-bustion is finished. The score achieved by the individuals with this criterion (Z) is defined in theEquation (7).
Z¼ logbcpKþ1Ecpþ ðjbexjKþ1ÞEexþMFBf1kMFB
(7)
Where bcp and bex are the slopes of compression and expansion strokes, calculated by means of a linear regression of the MFB versus angle in the compression and expansion angular intervals; K is a scale factor and Ecp and Eex are compression and expansion errors respectively, seeEquations (8e11).
Ecp¼Ecbcpþ X
icp
jMFBij2 (8)
Eex¼Ecbexþ X
iex
MFBiMFBf
2
(9)
Ecbcp¼ ( P
icbj
MFBij2 if MFBi<0
0 if MFBi>0
(10)
Ecbex¼ ( P
icb
MFBiMFBf
2
if MFBi<MFBf
0 if MFBi>MFBf
(11)
EcpandEexare computed by zones: compression, combustion and expansion (subscripts cp, cb and ex respectively). The summation in the equations is extended to the points of the indicated zone beingichfor combustion,icpfor compression andiexfor expansion.
The last term on the right hand-side of Equation (7), is related to the final value of MFBf.kMFBis used to evaluate the completeness of the combustion (See the next section for application details).
2.2.2.2. Crossover function.In the crossover step, each parent is individually crossed with the rest of the parents. For the defi-nition of the properties of each child (new individual), the ge-netic operators are applied. This gege-netic operator is a function applied to the genetic information of two parents in order to obtain the new genetic information of a child. Each value of the individual codification of the new child is obtained by means of a randomly generated number (j) and the crossover function, Equation (12), where x is the new value of the diagnostic parameter, xh andxlare the higher and lower values of the
properties of the parents, all of which are normalized between 0 and 1 in the range of variation of the diagnostic parameter.
x¼ 8 > > > > > > < > > > > > > : xl
10:25j
0:25 s
if 0j<0:25
xlþ
xhþxl 2 þxl
0:25j
0:25 s
if 0:25j<0:5
xhþxl 2 þ
xlxhþ2xl
10:75j
0:25 s
if 0:5j<0:75
xhþ ð1xhÞ þ
j0:75 0:25
s
if 0:75j<1
(12)
sis the genetic exponent (user defined), which is a parameter that modifies the shape of the genetic operator. Higher s values increase the probability that the child diagnostic parameter value is similar to one of the parent values and decreases the probability of mutation (child value is not similar to any of the parents).
2.2.2.3. Selection of the genetic algorithm configuration. The three user selectable values for the genetic algorithm config-uration are the following: the crossover function parameters, the number of parentsNpar, and the number of generations Ngen.
The number of diagnoses made for each cycle in order to obtain the optimal diagnostic parameters combination is selected through the number of parents and the number of generations (Npar,Ngen), being the number of diagnosis being: Ndiag¼N2par$Ngen.
The speed and accuracy of the algorithm were analised in the context of this paper, by generating a pressure trace with a predictive model and then applying the diagnostic model presented in this paper to this pressure trace. The predictive model used is very similar to the diagnosis one as it is also a one-zone model and with temperature varying thermal properties. It solves the energy conservation equation using as input a combustion law being the output a pressure trace (among many other data). The coherence between both models (diagnostic and predictive) was checked in order to carry out the analysis. The advantage of the utilization of a generated pressure trace is that the exact value of the pres-sure offset, angular positioning etc. are known and distur-bances due to experimental noise does not exist. Strict tolerances for all the parameters were applied in order to obtain the most accurate solution and several combinations of Npar,Ngenandswere tested.
The conclusion obtained from these tests was that for higher values of s reduces the number of possible Table 1eGenetic algorithm concepts applied to the
proposed method.
Genetic information Set of diagnosis parameters (CR,DP,Da,kwos)
Individual codification Set of the values of the diagnosis parameters Fitness evaluation Execution of the diagnosis
model and MFB evaluation withZfunction
Best individuals selection
BestNparindividuals (ordered usingZvalue) Genetic operators Crossover function,
combinations and the solution is reached after an elevated number of diagnoses (generations). Higher values ofsalso imply that the accuracy of the solution is higher. On the other hand, lower values of s increase the number of possible combinations and the solution is reached with fewer number of diagnosis (generations) but with a lower precision.
Finally, the authors concluded that the valuesNpar¼30 and Ngen¼30 (Ndiag¼27,000), and using a value ofs¼3.0, it rep-resents a good compromise between the accuracy and speed of the method.
3.
Results and discussions
3.1. Data analysis and diagnostic model based on genetic algorithms results
To make a study of cyclic dispersion a high number of engine cycles must be analised for each experimental set of condi-tions (i.e. regime, load, etc). The amount chosen by other au-thors varies between 120 and 2000 cycles[25,33,36,46]. In order to obtain a correct diagnosis, the parameters related to the experimental measurement procedure, i.e. angular posi-tioning, compression ratio, heat transfer multipliers and pressure offset, must be determined, ideally without any subjectivity.
Angular position of the TDC and the compression ratio are the same for all the tests if the engine geometry and encoder position is not changed, but are initially unknown. Heat transfer coefficient multipliers need to be adjusted and pres-sure offset must be adjusted for each cycle individually.
The set of experiments for this work consisted of the acquisition in the motored engine of the pressure trace of 20 consecutive cycles and the acquisition of the pressure data of six series of 830 consecutive cycles, each one with a fixed equivalence ratio 4 of 0.7. The NG and hydrogen mixture tested were with 100, 80, 60, 40, 20 and 0% of NG and completion of hydrogen. Inlet pressure was maintained constant (0.5 bar), engine speed was fixed at 1500 rpm and pressure data were recorded when the engine reached steady conditions. The diagnostic tool is applied to the first pressure trace (motored engine) in the [100; 140] crank angle interval. In the first round all the test parameters were released with the exception of the Woschni’s multi-plier. The results for each fuel mixture composition tested are shown inTable 2, where also the imep is exposed. In
this Table it is possible to see that the Woschni’s coefficient increases with the increment of the percentage of hydrogen in the mixture.
In a second round the model is newly run and in this case the angular position and compression ratio are fixed to the previously obtained average values. In this execution Woschni’s multiplier is released. The results of the Woschni’s multiplier are then compared with the MFB final value for all cycles (MFBf). By means of a linear regression, the optimum
value of Woschni’s multiplier is then calculated in order to obtain an MFBfvalue of one.
Woschni’s coefficient can be different from one test to another, depending on the equivalence ratio, although in this paper only results for a fixed value of equivalence ratio are presented.
In a third and last round, all the genetic algorithm pa-rameters are fixed except the pressure offset, which is always left free.
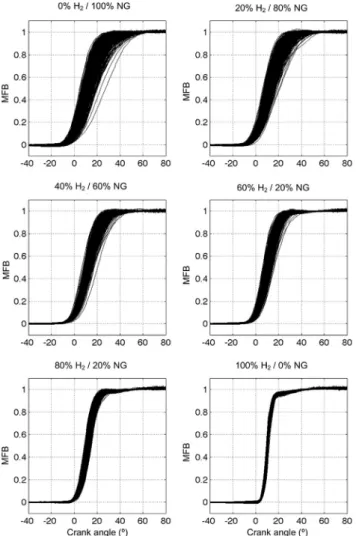
InFig. 5results of MFB are represented versus the angle obtained in the diagnostic process for all the cycles and tests. It is possible to see that as the proportion of hydrogen in-creases, the duration of the combustion and the dispersion of the results decrease.
3.2. Cycle-to-cycle dispersion analysis results
Cyclic dispersion analysis has been carried out over six series of 830 consecutive cycles for a fixed value of the fuel/air equivalence ratio. A traditional estimator[47]of the cycle-by-cycle variation is the Coefficient of Variation of Indicated Mean PressureðCOVIMEP¼ ðsIMEP=mIMEPÞ$100Þ, obtained by non-dimensionalising the standard deviation with the mean value of IMEP.
With the diagnostic model, the MFB of each cycle as a function of crank angle for six series (shown inFig. 5) is ob-tained. Also, the angular derivative of MFB (MFBR, Mass Fraction Burning Rate) of each cycle again as a function of crank angle can be obtained (checkFig. 1).
The MFBR is related to the turbulent combustion speedSc of flame front throughEquation (13).
MFBR¼ruAf
mda
dt
Sc (13)
whereScis the combustion velocity for a given value of crank anglea(and a related value of MFB), andmis the total mass. For a specific crank angle a, ru and Af can show different
values from cycle-to-cycle. In all cycles, when the amount of burned mass is the same (same value of MFB), if we assume that the piston position varies slightly during the combustion, ruandAfcan be considered similar for all the cycles. In this
case, the average value of MFBR is proportional to the average value ofSc,Equation (14), whereNcis the number of cycles of a pressure record.
MFBRðMFBÞ ¼X
Nc
i¼1
MFBRiðMBFÞ ¼ru
Af
mda
dt
ScðMFBÞ (14)
Analogously, the standard deviation of MFBR (s(MFBR)) is proportional to the standard deviation ofSc. This latter value Table 2eValues ofkwos, COVimep(%) and IMEP (bar) for
each test blend.
H2 % NG kwos COVimep(%) IMEP (bar)
0 100 0.9300 3.53 2.82
20 80 0.9520 3.12 2.86
40 60 1.0852 2.43 2.89
60 40 1.1284 2.03 2.95
80 20 1.2231 1.67 3.00
may be considered as the turbulent intensity of the combus-tion speed.
sðMFBRÞ ¼
ffiffiffiffiffiffiffiffiffiffiffiffiffiffiffiffiffiffiffiffiffiffiffiffiffiffiffiffiffiffiffiffiffiffiffiffiffiffiffiffiffiffiffiffiffiffiffiffiffiffiffiffiffiffiffiffiffiffiffiffiffiffiffiffiffiffiffiffiffiffiffiffiffiffiffiffiffiffiffiffiffiffi 1
Nc XNc
i¼1
MFBRiðMFBÞ MFBRðMFBÞ
2 v
u u
t ¼ruAf
mda
dt
sðScÞ
(15)
The average ofðMFBRðMFBRÞÞand the standard deviation,s (MFBR), are plotted versus MFB inFigs. 6and7. These results are calculated for different fuel mixture compositions.Fig. 6 shows that the average value of MFBR is dependent on the proportion of hydrogen in the fuel mixture, as could be ex-pected due to the dependence on the laminar combustion velocity.
InFig. 7, the standard deviation of MFBR is presented in the same conditions. The turbulent variation of the com-bustion speed is much less dependent on the percentage of hydrogen in the fuel mixture, with the exception of pure hydrogen, in which the values are higher than in the other cases. If we observe the mixtures up to 80% of hydrogen, the turbulent intensity of the combustion speed is similar in all the cases. This suggests that the combustion process is mainly dominated by the turbulence inside the combustion chamber due to the admission and compression processes. As the conditions (geometry, rpm, load rate) are similar in all the cases, those turbulence levels are also the same. How-ever, in the case of pure hydrogen, the turbulence intensity of the burning rate is higher, since the elevated combustion speed has a huge influence on the turbulence levels for the coupling between combustion development and fluid conditions.
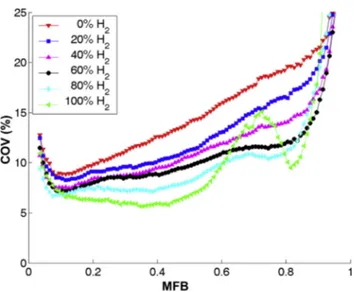
InFig. 8the coefficient of variation of MFBR (COV(MFBR), given as the ratio of the standard deviation of MFBR and the average value of MFBR) is plotted versus MFB. This COV(MFBR) represents a measure of the combustion speed dispersion relative to the combustion speed. As can be seen, in general COV(MFBR) decreases as the percentage of hydrogen increases in the fuel mixture in line with what was previously observed inFig. 7.
Fig. 5eResults of the MFB versus crank angle for six series of 830 cycles.
Fig. 6eEvolution of the MFBR versus the MFB for the experimental tests.
Finally,Fig. 9shows, for each fuel mixture, the average MFBR at 45% of MFB versus the MFBR at 5% of MFB. In order to increase the resolution, the axis range for all the graphs is the same, although in the bottom plots the origin of both
axis is shifted. Values of MFBR at 5% of MFB are represen-tative of the burning rate during the first stage of combus-tion, while values of MFBR at 45% of MFB are representative of burning rate during the second stage of the combustion process where turbulence is important. The cloud-like shape of correlation points for all mixtures show that there is little relationship between the combustion velocity in the first stage of the combustion and its posterior evolution. In addition, the worst correlation can be seen for the case of 100% hydrogen, reinforcing the idea that hydrogen com-bustion is not so dominated by flow turbulence, due to its high laminar speed.
4.
Conclusions
In this work the cycle-to-cycle variations in a spark ignition engine fuelled with alternative fuel mixtures of NG and hydrogen have been studied, with the objective of deter-mining the effect of introducing in the engine different pro-portions of hydrogen in the combustion process.
A new method for characterizing the cycle-to-cycle varia-tions has been developed. This technique is based on the use of genetic algorithms. The method automatically yields an objective diagnosis of combustion pressure records for a high number of cycles. The methodology allows us to obtain a very accurate adjustment of the optimum parameters of a diag-nosis: angular positioning, compression ratio, heat transfer coefficients and pressure offset. Since the diagnosis is made in an automatic and objective way, it allows us to study a high number of cycles without introducing any subjectivity due to data manipulation.
With some hypotheses it is possible to determine the average combustion burning rate (proportional to combustion speed) and its standard deviation. Results indicate that as the proportion of hydrogen increases in the mixture, the duration of the combustion and the relative dispersion are reduced, as expected.
In order to have a better understanding of the influence of mixture composition on the combustion development, inde-pendently of combustion duration, the relevant combustion variables are plotted versus the Mass Fraction Burned of each mixture. The standard deviation of the Mass Fraction Burning Rate is an estimator of the turbulence intensity of the com-bustion speed. For all the cases tested, except when the engine is only fuelled with hydrogen, this variable shows little dependence on the Mass Fraction Burned. These results show that the turbulence in the combustion chamber is a charac-teristic of the engine for a given engine geometry and speed, and the variations of the combustion process are a conse-quence of the velocity inside the combustion chamber.
The mixture with 100% of hydrogen shows differential characteristics, since its high combustion speed causes a strong acceleration of combustion, increasing fluid turbulence.
For all proportions of hydrogen in the fuel mixture, results indicate that there is a little dependency between the first stage of the combustion (characterized by a value of 0.05 MFB) and the second stage of combustion (characterized by a value of 0.45 MFB).
Fig. 8eEvolution of the COV (%) versus the MFB for the experimental tests.
Acknowledgments
The authors of this work would like to thank the Spanish Ministry of Science and Innovation for the financial support of this research through the project ENE 20012-34830 (with by FEDER funds) and the Regional Government of Castilla and Leon for funding the Excellence Research Group GR203.
Nomenclature
Af spherical flame front area, m2
cm piston velocity, m/s
dp piston diameter, m
E error
EGR Exhaust Gas Recirculation FSR flame speed ratio
HCCI Homogeneous Charge Compression Ignition ICE internal combustion engine
imep Indicated Mean Pressure, Pa m total mass, kg
MFB Mass Fraction Burned MFBR Mass Fraction Burning Rate NG natural gas
Ndiag number of diagnosis Ngen number of generations Npar number of parents p pressure, Pa
pm motored engine pressure, Pa
RoHR rate of heat release Rj universal constant, kJ/kg K
Sc combustion speed, m/s T temperature, K TDC top dead center uj internal energy, kJ/kg
V volume, m3
V(a) cylinder volume for each crank angle, m3
Greek
a crank angle
b slope
r density
s standard deviation j crossover function x diagnostic parameter s genetic exponent
Subscripts
b burned
cb combustion cp compression
ex expansion
ic intake valve closes
max maximum
u unburned, fresh wos Woschni’s
r e f e r e n c e s
[1] Naber JD, Siebers DL, Di Julio SS, Westbrook CK. Effects of natural gas composition on ignition delay under diesel conditions. Combust Flame 1994;99:192e200.
[2] El-Sherif AS. Effects of natural gas composition on the nitrogen oxide, flame structure and burning velocity under laminar premixed flame conditions. Fuel 1998;77:1539e47.
[3] Das LM, Gulati R, Gupta PK. A comparative evaluation of the performance characteristics of a spark ignition engine using hydrogen and compressed natural gas as alternative fuels. Int J Hydrogen Energy 2000;25:783e93.
[4] Akansu SO, Dulger Z, Kahraman N, Veziroglu TN. Internal combustion engines fueled by natural gasehydrogen mixtures. Int J Hydrogen Energy 2004;29:1527e39. [5] Ji C, Wang S. Experimental study on combustion and
emissions performance of a hybrid hydrogenegasoline engine at lean burn limits. Int J Hydrogen Energy 2010;35:1453e62.
[6] Ji C, Wang S. Combustion and emissions performance of a hybrid hydrogenegasoline engine at idle and lean conditions. Int J Hydrogen Energy 2010;35:346e55. [7] Hu E, Huang Z, He J, Miao H. Experimental and numerical
study on lean premixed methaneehydrogeneair flames at elevated pressures and temperatures. Int J Hydrogen Energy 2009;34:6951e60.
[8] Hu E, Huang Z, He J, Jin C, Zheng J. Experimental and numerical study on laminar burning characteristics of premixed methaneehydrogeneair flames. Int J Hydrogen Energy 2009;34:4876e88.
[9] Huang Z, Zhang Y, Zeng K, Liu B, Wang Q, Jiang D. Measurements of laminar burning velocities for natural gasehydrogeneair mixtures. Combust Flame
2006;146:302e11.
[10] Wang J, Chen H, Liu B, Huang Z. Study of the cycle-by-cycle variations of a spark ignition engine fuelled with natural gasehydrogen blends. Int J Hydrogen Energy
2008;33:4876e83.
[11] Huang B, Hu E, Huang Z, Zheng J, Liu B, Jiang D. Cycle-by-cycle variations in a spark ignition engine fuelled with natural gasehydrogen blends combined with EGR. Int J Hydrogen Energy 2009;34:8405e14.
[12] Ma F, Ding S, Wang Y, Wang Y, Wang J, Zhao S. Study on combustion behaviors and cycle-by-cycle variations in a turbocharged lean burn natural gas S.I. engine with hydrogen enrichment. Int J Hydrogen Energy 2008;3:7245e55. [13] Wang S, Ji C. Cyclic variation in a hydrogen-enriched spark-ignition gasoline engine under various operating conditions. Int J Hydrogen Energy 2012;37:1112e9.
[14] Wang J, Huang Z, Miao H, Wang X, Jiang D. Study of cyclic variations of direct-injection combustion fuelled with natural gasehydrogen blends using a constant volume vessel. Int J Hydrogen Energy 2008;33:7580e91. [15] Tinaut FV, Melgar A, Gime´nez B, Reyes M. Prediction of
performance and emissions of an engine fuelled with natural gas/hydrogen blends. Int J Hydrogen Energy 2011;36:947e56. [16] Horrillo A. Utilization of multi-zone models for the
prediction of the pollutant emissions in the exhaust process in spark ignition engines [Ph.D. thesis]. Universidad de Valladolid; 1998 [in Spanish].
[17] Lapuerta M, Armas O, Herna´ndez JJ. Diagnosis of diesel combustion from in-cylinder pressure signal by estimation of mean thermodynamic properties of the gas. Appl Thermal Eng 1999;19:513e29.
hydrogenenatural gas blends. Int J Hydrogen Energy 2012;37:2644e54.
[19] Lapuerta M, Armas O, Bermu´dez V. Sensitivity of diesel engine thermodynamic cycle calculation to measurement errors and estimated parameters. Appl Thermal Eng 2000;20:843e61.
[20] Payri F, Luja´n J, Martı´n J, Abbad A. Digital signal processing of in-cylinder pressure for combustion diagnosis of internal combustion engines. Mech Syst Signal Process
2010;24:1767e84.
[21] Lee K, Yoon M, Sunwoo M. A study on pegging methods for noisy cylinder pressure signal. Control Eng Pract
2008;16(8):922e9.
[22] Martı´n Dı´az J. Aportacio´n al diagno´stico de la combustio´n en motores diesel de inyeccio´n directa [Ph.D. thesis].
Universidad Polite´cnica de Valencia; 2007 [in Spanish]. [23] Kouremenos DA, Margaronis JE. Thermodynamic
determination of the top dead centre of diesel engines. Forschung im Ingenieurwesen 1987;53:37e42.http:// dx.doi.org/10.1007/BF02558495.
[24] Woschni G. A universally applicable equation for the instantaneous heat transfer coefficient in the internal combustion engine. Society of Automotive Engineers; 1967. SAE 670931.
[25] Heywood JB. Internal combustion engine fundamentals. McGraw-Hill; 1988.
[26] Demuynck J, Paepe MD, Huisseune H, Sierens R, Vancoillie J, Verhelst S. On the applicability of empirical heat transfer models for hydrogen combustion engines. Int J Hydrogen Energy 2011;36:975e84.
[27] Holland J. Adaptation in natural and artificial systems: an introductory analysis with applications to biology, control, and artificial intelligence. Cambridge: MIT Press; 1998. [28] Herna´ndez JJ, Ballesteros R, Sanz-Argent J. Reduction of
kinetic mechanisms for fuel oxidation through genetic algorithms. Math Comput Model 2010;52(7e8):1185e93. [29] Gosselin L, Tye-Gingras M, Mathieu-Potvin F. Review of
utilization of genetic algorithms in heat transfer problems. Int J Heat Mass Transf 2009;52(9e10):2169e88.
[30] Galloni E. Analyses about parameters that affect cyclic variation in a spark ignition engine. Appl Thermal Eng 2009;29(5e6):1131e7.
[31] Sen AK, Longwic R, Litak G, Go´rski K. Analysis of cycle-to-cycle pressure oscillations in a diesel engine. Mech Syst Signal Process 2008;22(2):362e73.
[32] Tinaut FV, Gime´nez B, Horrillo A, Cabaco G. Use of multizone combustion models to analyze and predict the effect of cyclic variations on SI engines. Society of Automotive Engineers; 2000. SAE 2000-1-0961.
[33] Litak G, Kaminski T, Czarnigowski J, Czarnigowski D, Wendeker M. Cycle to-cycle oscillations of heat release in a spark ignition engine. Meccanica 2007;42:423e33.
[34] Litak G, Kaminski T, Rusinek R, Czarnigowski J, Wendeker M. Patterns in the combustion process in a spark ignition engine. Chaos Solutions Fractals 2008;35(3):578e85.
[35] Litak G, Kaminski T, Czarnigowski J, Sen A, Wendeker M. Combustion process in a spark ignition engine: analysis of cyclic peak pressure and peak pressure angle oscillations. Meccanica 2009;44:1e11.
[36] Selim MY. Effect of engine parameters and gaseous fuel type on the cyclic variability of dual fuel engines. Fuel
2005;84(7e8):961e71.
[37] Hill PG. Cyclic variations and turbulence structure in spark-ignition engines. Combust Flame 1988;72(1):73e89.
[38] Hill PG, Kapil A. The relationship between cyclic variations in spark-ignition engines and the small structure of turbulence. Combust Flame 1989;78(2):237e47.
[39] Sen AK, Zheng J, Huang Z. Dynamics of cycle-to-cycle variations in a natural gas direct-injection spark-ignition engine. Appl Energy 2011;88(7):2324e34.http://dx.doi.org/ 10.1016/j.apenergy.2011.01.009.
[40] Ebrahimi R, Desmet B. An experimental investigation on engine speed and cyclic dispersion in an HCCI engine. Fuel 2010;89(8):2149e56.
[41] Sen A, Litak G, Edwards K, Finney C, Daw C, Wagner R. Characteristics of cyclic heat release variability in the transition from spark ignition to HCCI in a gasoline engine. App Energy 2011;88(5):1649e55.http://dx.doi.org/10.1016/ j.apenergy.2010.11.040.
[42] Vermorel O, Richard S, Colin O, Angelberger C, Benkenida A, Veynante S. Towards the understanding of cyclic variability in a spark ignited engine using multi-cycle LES. Combust Flame 2009;156(8):1525e41.
[43] Curto-Risso P, Medina A, Herna´ndez AC, Guzma´n-Vargas L, Angulo- Brown F. On cycle-to-cycle heat release variations in a simulated spark ignition heat engine. App Energy 2011;88(5):1557e67.http://dx.doi.org/10.1016/ j.apenergy.2010.11.030.
[44] NIST Chemistry Webbook (12 2010). URL:http://webbook. nist.gov/chemistry/.
[45] Tunestal P. Self-tuning gross heat release computation for internal combustion engines. Control Eng Pract
2009;17(4):518e24.http://dx.doi.org/10.1016/ j.conengprac.2008.09.012.
[46] Li G, Yao B. Nonlinear dynamics of cycle-to-cycle combustion variations in a lean-burn natural gas engine. Appl Thermal Eng 2008;28(5e6):611e20.
[47] Peucheret S, Wyszynsky ML, Lehrle RS. Use of
catalytic reforming to aid natural gas HCCI combustion in engines: experimental and modeling results of open-loop fuel reforming. Int J Hydrogen Energy