Image Segmentation Using Ant System-based
Clustering Algorithm
Aleksandar Jevtic, Joel Quintanilla-Dom´ınguez, Jose´ M i g u e l Barro´n-Adame and Diego Andina
Abstract Industrial applications of computer vision sometimes require detection of atypical objects that occur as small groups of pixels in digital images. These objects are difficult to single out because they are small and randomly distributed. In this work we propose an image segmentation method using the novel Ant System-based Clustering Algorithm (ASCA). ASCA models the foraging behaviour of ants, which move through the data space searching for high data-density regions, and leave pheromone trails on their path. The pheromone map is used to identify the exact number of clusters, and assign the pixels to these clusters using the pheromone gra dient. We applied ASCA to detection of microcalcifications in digital mammograms and compared its performance with state-of-the-art clustering algorithms such as 1D Self-Organizing Map, k-Means, Fuzzy c-Means and Possibilistic Fuzzy c-Means. The main advantage of ASCA is that the number of clusters needs not to be known
a priori. The experimental results show that ASCA is more efficient than the other
algorithms in detecting small clusters of atypical data.
1 Introduction
Soft-computing methods have been widely used in industrial and environmental applications. They usually find application to complex optimization problems for which approximate solutions are acceptable within a given error margin. Soft-computing methods have been successfully applied to knowledge extraction [1],
Aleksandar Jevtic´, Joel Quintanilla-Dom´ınguez and Diego Andina
E.T.S.I. de Telecomunicacio´n, Universidad Polite´cnica de Madrid, Avda. Complutense 30, Madrid 28040, Spain. e-mail: [email protected]; [email protected]; [email protected]
Jose´ Miguel Barro´n Adame
Divisio´n de Ingenierias, Campus Irapuato-Salamanca, Universidad de Guanajuato, Carretera Salamanca-Valle de Santiago Km 3.5+1.8 Km Comunidad de Palo Blanco, Salamanca, Gto., 36885, Mexico. e-mail: [email protected]
information security [2], manufacturing [3], sustainable building [4], meteorology [5], etc.
In applications of computer vision, image segmentation is an important pre-processing step. The objective is to partition the image into homogeneous regions that share certain visual characteristics. There is therefore a natural tendency to ap-ply data clustering algorithms to image segmentation. Clustering is a method of unsupervised learning because no prior labeling of data is available [6].
In computer vision applications such as digital mammography for cancer risk analysis, the less representative pixels are the most interesting since they represent a variation with respect to healthy tissue. Pixels of high grey-level intensity may indi-cate the presence of microcalcifications which may be an early sign of breast cancer. These microcalcifications are difficult to detect because they appear in groups of just a few pixels, which are often merged with larger clusters of high intensity in their proximity.
For the image segmentation method, the ASCA is proposed to group the pixels of similar grey-level intensity. The proposed method is based on the Ant System (AS) algorithm, which was originally created to solve the traveling salesman problem [7]. The AS models the pheromone-laying behaviour of ants for a discrete data space, which in our case is a digital image. For the experiments, two types of images were used. In these pictures, imperfections can be the result of light reflection over the image, or real imperfections that can be used as an aid in medical diagnosis. ASCA uses only the intensity level of the grey-level images as a criterion for image segmentation.
The paper is organised as follows. Sect. 2 provides a summary of related lit-erature. Sect. 3 describes the proposed ASCA algorithm. The image segmentation method based on the proposed algorithm is presented together with the experimen-tal results in Sect. 4. The results are discussed and compared with those obtained by the current state-of-the-art clustering algorithms. Finally, in Sect. 5 the conclusions are drawn.
2 Related Work
In this section, we give an overview of the state-of-the-art clustering algorithms. For image segmentation, clustering can be considered a preprocessing step that does not include the spatial information of the pixels. Therefore, the goal of the clustering process is to group the pixels based on their similarities in order to facil-itate further knowledge extraction. Kotsiantis and Pintelas [8] define the following five categories of clustering algorithms: partitioning methods, hierarchical methods, density-based methods, grid-based methods and model-based methods. The swarm-based algorithms do not explicitly belong to any of the named categories [9].
recognition in satellite images [11], segmentation of colour images [12], but also many others.
A cluster of pixels is usually associated with a prototype as the most represen-tative pixel also considered the cluster centre. Some clustering methods use this centric property to divide iV-dimensional data space, where the partitions are ei-ther strict, fuzzy or possibilistic. A well-known strict partitioning algorithm is the fe-Means [13] which divides a data set into k subsets such that all points in a given subset are closest to the same centre. In order to obtain more information about the proximity of a data point to a prototype, Bezdek [14] proposed the Fuzzy c-Means algorithm (FCM) that calculates a membership degree for each data point in rela-tion to different clusters. Since several equidistant data with the same membership values are not equally representative of the clusters, the Possibilistic c-Means al-gorithm (PCM) alal-gorithm was proposed in [15], which identified the similarity of data with a given number of prototypes using typicality values ranging from (0, 1). Pal et al. proposed to use both membership degrees and typicality values and implemented it in the Fuzzy Possibilistic c-Means (FPCM) algorithm [16]. Another improvement was proposed with the Possibilistic Fuzzy c-Means (PFCM) algorithm [17] by introducing the control parameters which define the relative importance of the membership degrees and the typicality values.
The clustering performance of the mentioned algorithms is greatly dependent on the initial guess of cluster centres and it is time consuming. Various methods were proposed to address these issues. One simple implementation of the fe-Means algorithm to colour quantization, data compression and image segmentation was proposed in [18]. The algorithm stores the multidimensional data points in a kd-tree that is computed only once, which results in faster computation. Laia and Liaw [19] proposed a modified fe-Means algorithm to speed up the clustering process for larger data sets with higher dimension. Some clustering methods were proposed to reduce the effect of the initially selected cluster centres [20] or for a more robust and less noise-sensitive clustering [21].
The sensitivity in detection of the atypical data remains an issue for the state-of-the-art clustering algorithms. Ojeda et al. [22] propose an image sub-segmentation method based on the PFCM algorithm in order to detect small homogeneous regions in mammograms. The authors applied a typicality value threshold to delimit a sub-group containing atypical pixels within the initially detected clusters. The threshold value was set manually which is the main drawback of this method.
3 Ant System-based Clustering Algorithm
The novel Ant System-based Clustering Algorithm (ASCA) proposed in this paper was inspired by the foraging behaviour of ant colonies in nature. When ants find a food source, they leave pheromone trails that attract other ants to follow their path. Pheromone trails evaporate over time, so a path that leads to a closer food source accumulates more pheromone as it is crossed by ants more frequently. The AS algorithm exploits this cooperative behaviour of ant colonies that features indi-rect communication through the environment. Unlike their biological counterparts, the artificial ants move through a discrete space defined with nodes and they have memory of the taken path.
Pheromone trails in the ASCA algorithm are accumulated in nodes in order to represent the density of the surrounding data. This differs from what was proposed in basic Ant System algorithm where pheromone trails marked the edges that con-nected the nodes in order to represent the favorite path. The process of pheromone accumulation is iterative and creates a pheromone map of the data set we want to cluster. Higher data-density areas accumulate more pheromone and they rep-resent cluster centres. This is used to extract the number of clusters. Gradient of the pheromone trail is used to assign every node to a cluster by applying local Hill-climbing search [23]. The ASCA algorithm consists of three consecutive parts, namely: a) pheromone accumulation, b) local pheromone summing, and c) data la-beling.
3.1 Pheromone Accumulation
In the pheromone accumulation stage, the artificial ants move in iV-dimensional data space looking for the high data-density regions. The algorithm starts with an initialization step which is followed by the iterative construction of new solutions and pheromone update. It involves the following steps:
1. Initialization: All nodes are initialised with an equal small amount of pheromone, To. The population of M ants is created and placed on randomly chosen nodes. 2. Node transition rule: Ant chooses the next node to move to by applying the
roulette rule. That is, every node has associated probability with which it is cho-sen from a set of available nodes. The probability of displacing feth ant from node / to node j depends on the Euclidean distance between the nodes and the amount of pheromone trail accumulated in node j , and it is given by:
pfj = < (i)
where T/ and r¡¡j are the intensity of the pheromone trail on the node j and the visibility of the node j with respect to the node /, respectively. The visibility is given as the reciprocal value of the Euclidean distance, d¡j, between the nodes / and j : r¡¡j = l/d¡j. Ant is not allowed to displace to the nodes it has already vis-ited. Tabut list contains the nodes visited by the feth ant. The control parameters
a and ¡5 allow us to bias the decision-making mechanism towards the
exploita-tion of the generated knowledge about the environment or exploraexploita-tion of new solutions, respectively. (a,/3 > 0; a,/3 e 9Í.) It can be noticed that the accumu-lated pheromone trails serve as a colony's external memory where the extracted knowledge about the environment is stored.
3. Pheromone update rule: Once all the ants carry out the transition to other nodes, the pheromone update is applied to each node as follows:
M
Tj,new = (1 - P ) 1),oU + £ ^ tf (2) k=l
where p is the pheromone evaporation rate (0 < p < 1; p e 9Í), and Axk- is the
amount of pheromone laid on the node j by the feth ant, and is given by:
Í
r¡ij, if node j has been visited by feth ant (3) 0, otherwise.where r¡¡j is the visibility of the node j from the node / from which the feth ant was displaced.
4. Stopping criterion: The steps 2 and 3 are repeated in a loop and the algorithm stops executing when the maximum number of iterations is reached.
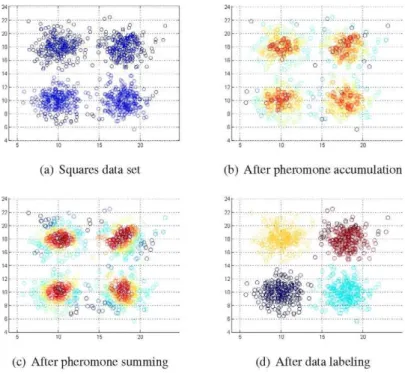
The output is a pheromone matrix where the distribution of pheromone is scarce, but the highest concentrations are found around the dense regions of nodes in data space. The ants make a probabilistic choice of path, therefore the neighbour-ing nodes may have significantly different amounts of pheromone deposits (see Fig. 1(b)). For this reason, we apply the local pheromone summing.
3.2 Local Pheromone Summing
The pheromone trails are locally summed to obtain a smooth pheromone surface to which a local gradient-based search will be applied. We define the neighbourhood resolution as an iV-dimensional sphere that represents a portion of the Euclidean data space, and whose diameter is given by:
(a) Squares data set (b) After pheromone accumulation
.8..:°
»
'W
(c) After pheromone summing (d) After data labeling
Fig. 1 Clustering result after applying the proposed ASCA algorithm to a Squares data set, which consists of four groups of 250 data patterns with normal Gaussian distribution.
where 7 is the resolution ratio, and {xn,min,Xn,max) is the data space range along
the rath dimension. For each node /, the pheromone deposits from the neighbouring nodes are added to already present pheromone value, T,O, as follows:
^neigh
T¡Í = T;o + £ T„ (5)
n=\
where Nnejgk is the number of neighbouring nodes contained within the sphere
defined in Eq. 4.
The output of the local pheromone summing process is a smooth (N + 1)-dimensional surface with pheromone value peaks around the cluster centres (see Fig. 1(c)).
3.3 Data Labeling
search is performed from each node with the step size defined in Eq. 4. The nodes which lead to the same local maximum are grouped in one cluster (see Fig. 1(d)). The number of clusters is therefore equal to the number of local maxima. It is impor-tant to emphasise that the ASCA algorithm extracts the number of clusters from the data set, unlike the other algorithms compared that require it to be set in advance.
4 Experimental Results and Discussion
In this section the ASCA algorithm is applied to the image segmentation task. The proposed method mimics the distributed organization of an artificial ant colony, and exploits the pheromone patterns that emerge as a result of local interactions. Specifically, the algorithm creates the pheromone mapping of a set of unlabeled image pixels in order to cluster them according to their grey-scale intensity level. The objective is to detect the atypical pixels, and for this two kinds of images are used, the "Splash" image, see Fig. 2(a), and a mammogram, see Fig. 3(a).
For all the images, the parameters of the algorithm are set to: To = 100, a = 1,
¡5 = 5, p = 0.05, 7 = 30. The experiments were performed in 3 cycles with 30
itera-tions. In each cycle, a population of 1000 ants were displaced on randomly chosen nodes. The experiments were performed using MATLAB (software MATLAB, ver-sion R2009b), on a computer with Pentium IV processor at 3.4 GHz, with 2 GB of RAM. For the fe-Means and FCM algorithms, the native MATLAB functions were used. The settings for the ID-SOM and the PFCM were implemented as proposed in [24] and [22], respectively. The results of experiments are shown in Fig. 2, for the "Splash" image, and Fig. 3 for a region of interest (ROI) mammogram.
For the "Splash" image the goal was to detect the pixels of high grey-level in-tensity that are a result of light reflection. The ASCA algorithm extracted six clus-ters which was enough to single out the atypical pixels. A comparison was made with ID-SOM, fe-Means and FCM algorithms using the same number of clusters. The ASCA outperformed ID-SOM, fe-Means and FCM. None of the control al-gorithms was able to extract the regions of interest. In case of the PFCM, image sub-segmentation was applied after the initial segmentation in two pixel groups. Because of the limitation of this approach to divide the data space in 2" partitions, the segmentation was performed for four clusters as proposed by the authors. Al-though the PFCM managed to detect the light reflection pixels, some other features like the shadow of the splash were not extracted. As a second part of the experiment, though not presented here, for each algorithm we incremented the number of clus-ters until the image segmentation allowed the separation of light reflection pixels. We obtained the following results: ID-SOM, 17 clusters; fe-Means, 9 clusters; and FCM, 7 clusters.
Fig. 2 Comparison of the segmentation results for the "Splash" image, 320 x 400 pixels. The
ASCA extracted six clusters; for the purpose of comparison, other algorithms were set to partition the data set in six clusters as well, only in case of PFCM with sub-segmentation the results are shown for four clusters because of the limitation of the algorithm to have 2" partitions.
were performed and the results of image segmentation using 1D-SOM, fc-Means, FCM, PFCM and the proposed ASCA are shown in Fig. 3. The ASCA extracted three clusters. For comparison, the same number of clusters was used for the seg-mentation trials based on the 1D-SOM, fe-Means and FCM methods. The image segmentation using the latter three algorithms gave poor results as the microcalcifl-cation pixels could not be isolated. PFCM managed to detect the microcalciflmicrocalcifl-cations but with a higher number of clusters (four) than ASCA. Even increasing the number of clusters, 1D-SOM, fe-Means and FCM were not able to obtain better segmentation results. The output images became over-segmented which prevented the extraction of the regions of interest.
Fig. 3 Comparison of the segmentation results for a ROI mammogram, 256 x 256 pixels. The
ASCA extracted three clusters; for the purpose of comparison, other algorithms were set to parti-tion the data set in three clusters as well, only in case of PFCM with sub-segmentaparti-tion the results are shown for four clusters because of the limitation of the algorithm to have 2" partitions.
5 Conclusions
References
1. Yu W-D, Liu Y-C (2006) Hybridization of CBR and numeric soft computing techniques for mining of scarce construction databases. Automat Constr 15(1):33^16
2. Corchado E, Herrero A (2010) Neural visualization of network traffic data for intrusion de-tection. Appl Soft Comput, doi: 10.1016/j.asoc.2010.07.002
3. Andina D, Pham D T (2007) Computational intelligence: For engineering and manufacturing. Springer-Verlag New York, Inc., Secaucus, NJ, USA
4. Sedaño J, Curiel L, Corchado E, de la Cal E, Villar J R (2010) A soft computing method for detecting lifetime building thermal insulation failures. Integr Comput-Aided E 17(2): 103-115 5. Corchado E, Arroyo A, Tricio V (2010) Soft computing models to identify typical
meteoro-logical days. Log J IGPL, doi:10.1093/jigpal/jzq035
6. Jain A K, Murty M N, Flynn P J (1999) Data clustering: A review. ACM Comput Surv 31(3):264-323
7. Dorigo M, Maniezzo V, Colorni A (1996) Ant System: Optimization by a colony of cooper-ating agents. IEEE T Syst Man Cyb - Part B 26(1):29^U
8. Kotsiantis S, Pintelas P (2004) Recent advances in clustering: A brief survey. WSEAS Trans-actions on Information Science and Applications 1(1):73-81
9. Handl J, Meyer B (2007) Ant-based and swarm-based clustering. Swarm Intelligence 1(1):95-113
10. Kohonen T (1990) The self-organizing map. P IEEE 78(9):1464-1480
11. Richardson A J, Risien C, Shillington F A (2003) Using self-organizing maps to identify patterns in satellite imagery. Prog Oceanogr 59:223-239
12. Jiang Y, Zhou Z H (2004) SOM ensemble-based image segmentation. Neural Process Lett 20:171-178
13. MacQueen J B (1967) Some methods for classification and analysis of multivariate
obser-vations. Proc 5th Berkeley Symposium on Mathematical Statistics and Probability, Berkeley,
University of California Press 281-297
14. Bezdek J C (1981) Pattern recognition with fuzzy objective function algorithms. P. Press, edn. Plenum Press, New York
15. Krishnapuram R, Keller J M (1993) A possibilistic approach to clustering. IEEE T Fuzzy Syst 1(2):98-110
16. Pal N R, Pal K, Bezdek J C (1997) A mixed c-means clustering model. Proc 6th IEEE Int
Conf Fuzzy Syst 11-21
17. Pal N R, Pal K, Keller J M, and Bezdek, J C (2005) A possibilitic fuzzy c-means clustering algorithm. IEEE T Fuzzy Syst 13(4):517-530
18. Kanungo T, Mount D M, Netanyahu N S, Piatko C D, Silverman R, Wu A Y (2002) An efficient k-Means clustering algorithm: Analysis and implementation. IEEE T Pattern Anal 24(7):881-892
19. Laia J Z C, Liaw Y C (2008) Improvement of the k-means clustering filtering algorithm. Pattern Recogn 41:3677-3681
20. Chang K C, Yeh M F (2005) Grey relational analysis based approach for data clustering. IEE P-Vis Image Sign 152(2):165-172
21. Awad M, Chehdi K, Nasri A (2009) Multi-component image segmentation using a hybrid dynamic genetic algorithm and fuzzy C-means. IET Image Process 3(2):52-62
22. Ojeda-Magaña B, Quintanilla-Dominguez J, Ruelas R, Andina D (2009) Images
sub-segmentation with the PFCM clustering algorithm. Proc 1th IEEE Int Conf Industrial
In-formatics 499-503
23. Russell S J, Norvig P (2003) Artificial intelligence: A modern approach, 2nd edn. Prentice Hall, Upper Saddle River, New Jersey
24. Barrón-Adame J M, Herrera-Delgado J A, Cortina-Januchs M G, Andina D, Vega-Corona A
(2007) Air pollutant level estimation applying a self-organizing neural network. Proc 2nd Int