Research Paper
Mechanical behavior of bilayered small-diameter
nanofibrous structures as biomimetic vascular grafts
Florencia
Montini-Ballarin,
Daniel
Calvo,
Pablo
C.
Caracciolo,
Francisco
Rojo,
Patricia
M.
Frontini,
Gustavo
A.
Abraham,
Gustavo
V.
Guinea
Keywords: Electrospinning
Small-diameter vascular grafts Dynamic compliance
Biomimetic behavior
a b s t r a c t
To these days, the production of a small diameter vascular graft (o6 mm) with an appropriate and permanent response is still challenging. The mismatch in the grafts mechanical properties is one of the principal causes of failure, therefore their complete mechanical characterization is fundamental. In this work the mechanical response of electrospun bilayered small-diameter vascular grafts made of two different bioresorbable synthetic polymers, segmented poly(ester urethane) and poly(L-lactic acid), that mimic the biomechanical characteristics of elastin and collagen is investigated. A J-shaped response when subjected to internal pressure was observed as a cause of the nanofibrous layered structure, and the materials used. Compliance values were in the order of natural coronary arteries and very close to the bypass gold standard-saphenous vein. The suture retention strength and burst pressure values were also in the range of natural vessels. Therefore, the bilayered vascular grafts presented here are very promising for future application as small-diameter vessel replacements.
1.
Introduction
Cardiovascular diseases are the main cause of death world-wide; they represent 29% of total global deaths. In particular, coronary arteries affections represent 50% of cardiovascular diseases death cause (Seifu et al., 2013). The use of autologous and homologous natural arteries and veins, specifically the
internal mammary artery (also known as internal thoracic artery) and mayor saphenous vein, are to this day the gold standard for bypass surgery treatment. Despite the good performance of autologous grafts, 15% of patients with cor-onary diseases need alternative grafts due to impossibility or not availability of the mentioned grafts (Canver, 1995;McClure
et al., 2011). In the last 60 years, the use of synthetic grafts like
has been the only alternative to autografts and homografts. Even though these grafts work well for larger arteries replace-ment, they are too stiff and lack regeneration potential (Seifu
et al., 2013;McClure et al., 2011;Ravi and Chaikof, 2009;Kurobe
et al., 2012;Catto et al., 2015). When used as small-diameter
vascular grafts they are associated with different levels of thrombogenicity, stenosis, and infection susceptibility, mainly due to mechanical mismatch at the anastomosis site and lack of bioactivity. This leads to intima hyperplasia and a reduction in patency rate (Abbott et al., 1987). In particular, compliance mismatch between native artery and the artificial graft was determined as one of the mayor failure causes over prolonged periods of implantation (Sonoda et al., 2001). The ideal vas-cular graft must achieve numerous attributes, the mayor of which concern mechanical strength, compliance, suture reten-tion strength and a J-shaped mechanical response comparable to physiologic values (Nerem, 2003).
The mechanical response of the arterial wall depends on the mechanical role of its passive (elastin and collagenfibers) and active components (smooth muscle cells). The mechan-ical properties of the vessel are determined by these compo-nents and it is possible to identify each component contribution to thefinal elastic response (Roach and Burton,
1957; O’Rourke, 1982; Armentano et al., 1991; Fung, 1993;
Barra et al., 1993; Shadwick, 1999). When arteries undergo
internal pressure a non-linear elastic response, J-shaped curve, is observed. At low pressures, the artery wall presents high compliance, which is mainly attributed to elastinfibers. As the pressure increases, collagenfibers start to align and orient, lowering the artery compliance. At high pressures, the mechanical response is mainly due to collagen, which results in high stiffness (Sonoda et al., 2001;Roach and Burton, 1957;
Fung, 1993;Bergel, 1961;Bergel, 1961;Armentano et al., 1995).
Therefore, to obtain a small-diameter vascular graft that mimics this mechanical response, the use of collagen and elastin, as well as mimicking their crimped morphology, appears as a solution.
The J-shaped mechanical response has often been observed in vascular grafts obtained fromin vitrocellular cultures (Konig
et al., 2009;Zahedmanesh et al., 2011) as well as in some cases
where natural polymers like collagen, elastin orfibrin were used (McMahon et al., 2010). However, natural polymers properties differ from batch to batch and reproducible proces-sing conditions are hard to obtain. Even more, they present low strength that impedes them to withstand high internal pressures (McClure et al., 2011;Lee et al., 2008;Sell et al., 2009). The use of synthetic biocompatible and bioresorbable poly-mers, which behave mechanically as collagen and elastin, appear as an appealing alternative. Nevertheless, a J-shaped response is hard to achieve with vascular grafts made purely from synthetic polymers, which present an inverse curvature, i.e. compliance decreases with increasing load.
The importance of a J-shaped biomimetic response has led to different design strategies of vascular grafts. Sonodaet al. developed an adaptable concentric two-layered graft designed with a gap between each layer, where the mechan-ical behavior of the artery could be mimicked by selecting the layers properties and the distance between them (Sonoda
et al., 2001;Sonoda et al., 2003). At low pressures the internal
layer alone mimics the pressure resistance, while at high
pressures both layers copy the response together. Rapoport
et al. (2012) developed a variable diameter collector that permits the production of a corrugated external layer that mimics the collagenfiber topography. In this way, the inter-nal layer supports the pressure, until ondulations start to act (as collagenfibers do) at higher pressure ranges. This design could be adapted to mimic different arteries depending on the materials used and the expansion degree of the collector. Besides the advances in the area, to these days the production of a small diameter vascular graft (o6 mm) with an appropriate and permanent response is still challenging. Electrospun nanofibrous vascular grafts arrived as a potential tailor made solution to the mechanical mismatch problem. The electrospinning technique has gained attention in the last decade as an attractive and versatile method to obtain nanofibrous porous structures that mimic natural tissues extracellular matrix. Their nanofibrous morphology, inter-connected porosity and high surface to volume ratio convert them in good potential scaffolds for tissue engineering applications (Dahlin et al., 2011; Agarwal et al., 2008; Sill
and von Recum, 2008). Additionally, the use of a
small-diameter rotating collector together with sequential electro-spinning allows the production of multilayered structures, which mimic the artery wall structure. Therefore, there have been a number of studies focused on the production of electrospun tubular structures with potential applications as small-diameter vascular grafts (Hasan et al., 2014). Besides the important advances and encouraging results, only few studies present a complete mechanical characterization of the developed vascular grafts.Leeet al.(2008)produced a poly (ε-caprolactone) (PCL) and collagen blend graft with appro-priate mechanical properties and long-term stability.McClure
et al.(2012)produced trilayered vascular grafts with different collagen or silkfibroin, elastin and PCL ratios at each layer. Multilayered grafts that architecturally mimic the native vascular wall and mechanically match the gold standard of vessel replacement, saphenous vein, were produced. Han
et al.(2013)obtained multilayered vascular grafts from poly (ethylene glycol)-b-poly(L-lactide-co-ε-caprolactone) (PELCL), poly(L-lactide-co-glycolide) (PLGA), PCL and gelatin with suf-ficient mechanical properties for vascular tissue engineering applications.Yinet al.(2013)developed vascular grafts from poly (L-lactide-co-ε-caprolactone) (PLLACL), collagen and chit-osan at different blend ratios by electrospinning, also with similar mechanical properties to those of saphenous vein.
changes in the grafts geometry, like diameter, thickness and amount of layers were performed.
2.
Materials and methods
2.1. Materials
PLLA (PLA2002D, Mn¼78.02 kg mol1, Mw¼129.91 kg mol1, IP¼1.67) was obtained from Natureworks (MN, USA). A bioresorbable SPEU named PHD was synthesized from ali-phatic diisocyanate, aliali-phatic polyester, and a diester– diphe-nol chain extender according to previously reported procedures (Caracciolo et al., 2009). Dichloromethane (DCM) andN,N-dimethylformamide (DMF) were acquired from Ane-dra (BA, Argentina). Tetrahydrofuran (THF) was purchased from Cicarelli (Santa Fe, Argentina). 2,2,2-trifluoroethanol (TFE) was purchased from Sigma-Aldrich (MO, USA). All solvents were analytical grade and were used as received.
2.2. Methods
2.2.1. Electrospun scaffolds fabrication
Electrospun scaffolds were obtained from PLLA, PHD and two different blend ratios of PLLA/PHD, 90/10 and 50/50 wt/wt, corresponding to outer and inner layer, respectively (Montini
Ballarin et al., 2014).
A standard electrospinning setup was used, consisting of a programmable syringe pump (Activa A22 ADOX S.A., Argen-tina), a high-voltage power source (ES30P, Gamma High Voltage Research Inc., USA), and a grounding aluminum collecting plate. All experiments were carried out at room temperature in a chamber having a ventilation system. A 10% wt/v solution concentration (C) in DMF/DCM at 40/60 mixed ratio, a voltage (V) of 13 kV, a needle-collector distance (d) of 15 cm and aflow rate (f) of 0.5 ml/h were used for the PLLA scaffolds. PHD solution in TFE at C¼25% wt/v, f¼1 ml/h, d¼13 cm andV¼13 kV was employed. A totalCof 20% wt/v in TFE was used for the inner layer and 15% wt/v in TFE for the outer layer. The electrospinning parameters used were f¼1 ml/h, d¼15 cm and V¼13 kV for the inner layer; and f¼0.5 ml/h,d¼15 cm andV¼13 kV for the outer layer.
2.2.2. Vascular grafts fabrication
Bilayered vascular grafts were produced by sequential elec-trospinning, with the inner layer on the lumen side and the outer layer on the external side. A small-diameter rotating mandrel was used as collector. The electrospinning para-meters were set according to previously reported conditions
(Montini Ballarin et al., 2014). A mandrel with a rotation
velocity (r) of 1000 rpm,d¼15 cm andV¼13 kV were used for both layers, while flow rates of 1 ml/h and 0.5 ml/h, were used for the inner and outer layers, respectively. Vascular grafts of three different thicknesses (0.1170.03 mm, 0.1770.03 mm, 0.2370.04 mm) were produced by different processing times (t), t¼1.5 h, 3 h and 4.5 h. Grafts internal diameter was 5 mm approximately.
2.2.3. Uniaxial tensile test
Uniaxial tensile tests were carried out in a universal testing machine (Instron 5866, Norwood, USA) equipped with a setup specially designed forin vitrotests. This setup consists of a poly(methylmethacrylate) (PMMA) transparent chamberfilled with normal saline solution (9 g/L Sodium Chloride Solution) kept at 37711C by means of a thermostatic bath (Unitronic 6320200, Selecta, Spain). The axial force was measured by means of a 5 N load cell (Instron 2519, accuracy better than 0.5%) and the axial displacement was recorded by video-extensometry, by placing two marks at both ends of the sample and recording their position with a digital camera (uEye 1545LE, IDS Imaging Development System, Germany). Image J software (National Institutes of Health, USA) was used for post-processing. The extension rate was 0.03 mm/s. Dog-bone shaped specimens with a central zone 10 mm long2 mm wide were used. At least 5 samples were tested for each scaffold group (PLLA, PHD, PLLA/PHD 90/10, and PLLA/PHD 50/50). To evaluate the anisotropy, two sets with at least 5 samples each were obtained in both, longitudinal and circumferential, directions from the bilayered vascular grafts. Rectangular samples were cut of 10 mm long3 mm wide. Specimen thickness was measured on each sample by means of a thickness gauge (Mitutoyo 7301) with 10mm accuracy.
Engineering stress versus engineering strain relationships for all the tests were derived from experimental load– dis-placement curves by dividing the applied load by the initial cross-sectional area and the displacement by the initial length of the specimen. Initial Young's modulus, ultimate tensile strength and ultimate strain were obtained from the experimental data.
2.2.4. Suture strength test
Suture retention strength tests were performed in 3 cm long segments of bilayered vascular grafts of different thicknesses (n¼6 each). Tests were carried out in accordance with the standard for cardiovascular implants and vascular prosthesis ISO 7198 (ANSI/AAMI/ISO, 2010). A universal testing machine (Instron 5866, Norwood, USA) equipped with an in vitro test setup was used. Tests were performed in normal saline solution (9 g/L Sodium Chloride Solution) at 37711C. A prolenes5-0 suture (Ethicon, Inc., Johnson & Johnson) was inserted 2 mm from the end of the stretched prosthesis. A load cell of 5 N (Instron 2519, accuracy better than 0.5%) and an extension rate of 150 mm/min were used. The force required to pull the suture through the prosthesis or cause the wall of the prosthesis to fail was recorded.
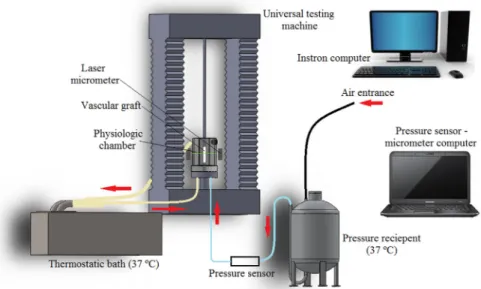
2.2.5. Pressure vs. diameter tests at different axial extensions
(Fig. 1). This consists of a PMMA transparent chamberfilled with physiologic serum (9 g/L Sodium Chloride Solution). The chamber temperature was kept at 37711C by a thermostatic bath (Unitronic 6320200, Selecta, Spain). The setup is placed on a universal testing machine (Instron 4411, Norwood, USA), which applies a constant axial elongation. The internal pressure was applied with an auxiliary line of physiologic serum, also at 37711C, operated by compressed air. The pressure was measured at the entrance of the chamber with a high pressure transducer (Honeywell, Columbus, USA, reso-lution 0.15 mmHg). Pressure and diameter signals were sent to the data acquisition system, programmed in LabVIEW (National Instruments Corporation, USA).
Al least 4 samples of 5 cm length from each bilayer vascular graft thickness group were tested at three different axial elongations (L/L0¼1, 1.05 and 1.1).
Vascular grafts compliance (%C) was calculated from the experimental data, according to the standard ISO 7198 (ANSI/
AAMI/ISO, 2010), at three pressure ranges (50–90, 80–120 and
110–150 mmHg):
%C¼ðRS–RDÞ=RD104=ðPSPDÞ ð1Þ where PS is the maximum pressure value (systole, mmHg) andPDis the minimum pressure value (diastole, mmHg).RS andRDare the corresponding internal radii (mm).
The corresponding circumferential mean stress (sM) was approximated according to:
sM¼PM RM=h
ð2Þ
where PM is the internal applied pressure, RM is the corre-sponding mean radius andhis the wall thickness.
2.2.6. Burst pressure test
The same equipment of Section 2.2.5.was used to test the vascular grafts until failure. The burst pressure was obtained for the three different graft thicknesses and two axial elonga-tions ofL/L0¼1 and 1.1 (n45).
2.2.7. Mechanical modeling
Vacular grafts were simulated using an isotropic linear-elastic mechanical model (El-Kurdi et al., 2008; Vorp et al., 1995). Some simplifications were taken as described
else-where: the vascular graft geometry was idealized as two/ three concentric incompressible, homogeneous, isotropic, linear-elastic layers with perfect adherence (Fig. 2). Infi nite-simal strains and a state of plane stress were also assumed
(Vorp et al., 1995;McClure et al., 2010).
The value of the pressure at the inter layer boundary,P2, for the two-layer model is (El-Kurdi et al., 2008):
Fig. 1–Schematic representation of the setup used for the pressure-diameter characterization. Air (black line), internal physiologic serum line (light blue line), and chamber physiologic serum line (yellow line). (For interpretation of the references to color in thisfigure legend, the reader is referred to the web version of this article.)
Outer
Medium
Inner
P0 =0
P3
P2
P1
r = a
r = b
r = c
r = d
Fig. 2–Scheme of the model parameters for a trilayered tubular structure. The inner layer (internal diameterr¼a) is subjected to an internal pressureP1. The interface between
the inner and medium layers (atr¼b) is subjected toP2,
while the interface between medium and outer layers at
r¼c, suffers a pressureP3. External pressure atr¼dis
P2¼ha2P1ð1–υÞ c2–b2EEXTbþð1þυÞ EEXT c2–b2ba2P1i=hb2ð1–υÞ EEXTbc2–b2
þð1–υÞ a3E
INT b2–a2
þð1þυÞ EEXT c2–b2ba2þc2E
INTb b2–a2
i
ð3Þ
whereEINT, andEEXTare the elastic moduli of the inner and outer layers, respectively; νINT¼νEXT¼½ are the Poisson's coefficient for the inner and outer layers to account for the incompressibility condition;aandbare the internal radii for the inner and outer layers, andcis the external radius for the outer layer.
The pressures at the interfaces,P2andP3, for the three-layer model are (Vorp et al., 1995):
P2¼P1 ð2a2bÞ= b2–a2
EINT
h i
n o
f c2–b22EMED2k2
= c2–b22EMED2k2
k1–4b3c3
ð4Þ
P3¼P1 2a2b= b2–a2
EINT
h i
n o
f 2c2–b22EMEDb2c= c2–b22EMED2
k2k1–4b3c3
ð5Þ
wherek1andk2are given by:
k1¼ b3ð1υINTÞ þa2bð1þυINTÞ
h i
=b2a2E INT
h i
þ b3ð1υMEDÞ þb2c h
ð1þυMEDÞ i
=c2b2E MED
h i
ð6Þ
k2¼ c3 1–υ MED
ð Þ þb2cð1þυMEDÞ
h i
=hc2–b2EMEDi þ c3ð1–υEXTÞ þd2c
h
ð1þυEXTÞ i
=hd2–c2EEXTi ð7Þ
EINT, EMEDand EEXT are the elastic moduli for the inner, medium and outer layers, respectively; νINT, νMED, νEXT the Poisson's coefficients for the inner, medium and outer layers, taken equal to 0.5 for incompresibility; a, b and c are the
internal radii for the inner, medium and outer layers; anddis the external radius for the outer layer.
According to the model, the circumferential wall stress (CWS) within a given layer at a radius (r) is given by: CWS¼ ðri2Pire2PeÞ=re2–ri2
þðPiPeÞ ri2re2
= re2r i2
r2
forrirrrre ð8Þ whereriandreare the internal and external radii of the layer, and PiandPethe corresponding internal and external pres-sures. Application of Eq.(8)with the corresponding interfacial pressures (Eq. (3) for the two-layer and Eqs. (4–7) for the three-layer) permit the computation of the circumferential stress at any layer of the model.
3.
Results and discussion
3.1. Vascular grafts fabrication
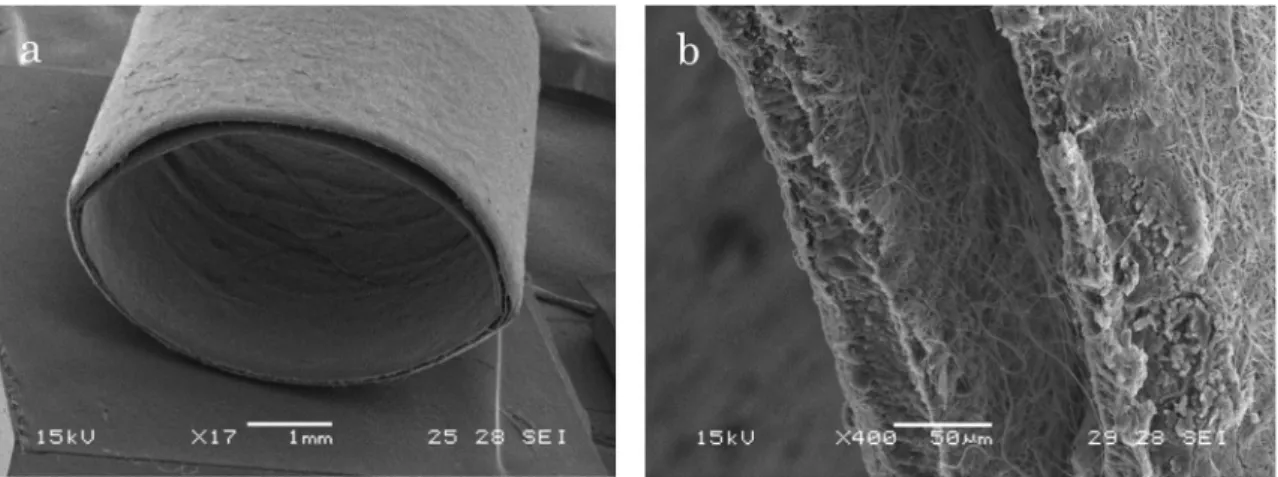
The electrospinning process was carried out according to previously optimized conditions for PLLA, PHD, and their blends (Montini Ballarin et al., 2014). Uniform and bead-free nanofibrousflat and tubular scaffolds were obtained.Fig. 3
shows SEM micrographs of a bilayered vascular graft pro-duced by sequential electrospinning. Both layers displayed a bead-free nanofibrous morphology. The vascular graft pre-sented a separation between layers of about 100–200mm, which contributed to the graft biomimetic mechanical response, as it will be discussed inSection 3.4.
3.2. Uniaxial tensile tests
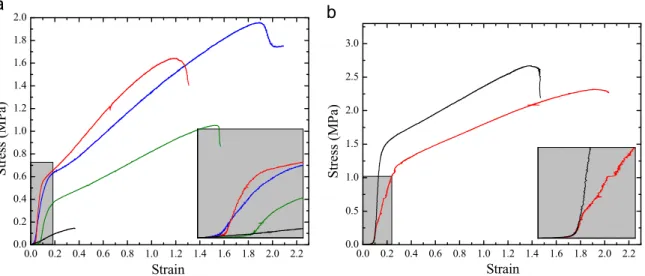
Fig. 4(a) shows some representative engineering stress–strain
curves for PLLA, PHD, and their blends PLLA/PHD50/50 (inner layer) and PLLA/PHD90/10 (outer layer).
Two different behaviors emerged from the curve shape analysis. PHD curve resemble the response of elastin, with an elastic behavior until rupture and lack of yielding zone. PLLA showed a more rigid response, with a steeper slope similar to the one presented by collagen. Depending on the blend their mechanical properties change continuously from the strong and stiff behvoiur of pure PLLA (100/0 blend) to the compliant and weak PHD (0/100).
The PHD scaffold displayed an initial Young's modulus value very close to the one observed for the elastin present in natural arteries (Table 1). PLLA Young's modulus was one order of magnitude smaller than the one presented by collagen, and falls in the range observed for natural arteries at high blood pressures (5–17 MPa), which is associated to collagenfibers activation (Salvucci et al., 2009). Thisfinding corroborates our hypothesis that, electrospun PHD has a mechanical behavior similar to elastin and PLLA scaffold to collagen.
In what respects to the blends, the PLLA/PHD 90/10 modulus was higher than the corresponding to 50/50 blend, although it did not follow a mixture rule (Table 1). This same tendency was observed in literature (McClure et al., 2010), which could be due to the nanofibrous and random nature of the tested scaffolds. The influence of the scaffolds and its material parameters (fiber diameter, curvature and orienta-tion; materialflexibility and rigidity, etc.) and how they affect the mechanical response, was investigated before (Rizvi et al.,
2012; Pai et al., 2011). As in random nanofibrous materials,
not all the fibers are in the load-bearing direction, the response would depend on how many fibers are recruited and aligned during the tensile test. The resultant modulus, thus, is a function of the number offibers effectively support-ing the load and it differs from the one observed in a solid sample.
Tensile curves for samples obtained from bilayered vas-cular grafts showed a clear anisotropy between the circum-ferential and axial directions. The Young's modulus resulted lower in the circumferential direction (Fig. 4(b)) and did not present significant differences with the obtained values for the inner and outer layers (po0.05) (Table 2).
Interestingly, the axial initial Young's modulus was higher than the stiffer component (PLLA). This is a consequence of nanofibrous scaffolds properties being dependent on the amount of fibers recruited during the tensile test, even though related to the material properties. In this way, it can be considered that morefibers are aligned and support the load during axial loading than during the circumferential test, and even more, than the pure material scaffolds tested. PLLA Young's modulus ranging from 45 to 90 MPa were reported depending on the amount of fibers aligned in the load direction (Pu and Komvopoulos, 2014).
Vessel anisotropy was also reported for natural arteries and veins (Claes, 2010; Donovan et al., 1990). Claes et al. analyzed the mechanical behavior of coronary arteries, and arteries and veins used for coronary bypass free of any vascular condition (Claes, 2010). The comparison of both data sets (natural vessels and bilayered vascular grafts) throws in similar behavior, being the axial testing direction stiffer than the cirfumferential one. However, the arteries anisotropy was higher than vascular grafts, and was more evident in the
0.0 0.2 0.4 0.6 0.8 1.0 1.2 1.4 1.6 1.8 2.0 2.2 0.0
0.2 0.4 0.6 0.8 1.0 1.2 1.4 1.6 1.8 2.0
Stress (MPa)
Strain
0.0 0.2 0.4 0.6 0.8 1.0 1.2 1.4 1.6 1.8 2.0 2.2 0.0
0.5 1.0 1.5 2.0 2.5 3.0
Strain
S
tress (M
Pa)
Fig. 4–Representative engineering stress–strain curves; a) Electrospun scaffolds (PLLA: red, PHD: black, PLLA/PHD 50/50: green, PLLA/PHD 90/10: blue); b) samples from bilayered vascular grafts tested in axial (black) and circumferential direction (red). (For interpretation of the references to color in thisfigure legend, the reader is referred to the web version of this article.)
Table 1–Initial Young's modulus.
Young'sModulus (MPa)
PLLA 13.8573.82
PLLA/PHD 90/10 6.3070.75 PLLA/PHD 50/50 5.3570.98#
PHD 0.5670.27
Elastin 0.4970.18 (Armentano et al., 1991); 0.1–0.15 (Salvucci et al., 2009) Collagen 131764 (Armentano et al., 1991)
shape of the tensile stress–strain curves than in the values of the elastic modulus (Ecircumferential¼1–2 MPa,Eaxial¼4–6 MPa). Natural blood vessels lack the initial lineal zone present in synthetic materials, therefore a convention is used to mea-sure the Young's modulus at a determined strain (Claes,
2010).
At strains larger than 10% (0.1), tensile curves from electrospun grafts resemble that of a typical synthetic poly-mer, not showing the J-type behavior of natural arteries. However, at strains below 10% a J-shaped behavior can be noticed (Fig. 4, inset), this one being the result of thefibers recruiting in the load direction and the testing configuration
(Rizvi et al., 2012). This is more appreciable in the
pressure-diameter test configuration as it will be shown later. For the materials characterization the toe correction was performed and taken into account in their tensile properties.
The elastic modulus values obtained for bilayered vascular grafts, although within the same range, were also higher than the ones reported by Claeset al.Claes (2010) for mammary and radial arteries and saphenous veins (Ecircumperential¼2.5– 7.5 MPa andEaxial¼12–16 MPa). Nevertheless, due to the dis-persity in natural blood vessels properties and convention used to measure the Young's modulus, some higher elastic modulus for human saphenous veins (Ecirc¼43 MPa and Eaxial¼130 MPa, (Donovan et al., 1990)) were also reported.
Samples from electrospun bilayered vascular grafts showed ultimate tensile strengths and strain values in the range of natural blood vessels (0.5–3 MPa for coronary arteries, 1.5–4 MPa for radial and mammary arteries, and saphenous veins (Claes, 2010)). The ultimate tensile strain values for all natural vessels were similar, with these in the range of 40–100% (Claes, 2010).
The mechanical results obtained for bilayer vascular grafts showed that their mechanical properties lies in parallel to the natural vessels and are significant apart from much more stiff substitutes like Dacronsand Goretexs. Dacronselastic modulus is 14,000 MPa and its ultimate tensile strength is between 170 and 180 MPa. Goretexs has a stiffness of 500 MPa and a tensile strength of 14 MPa (Kannan et al., 2005).
3.3. Suture retention strength
Two types of suture knots were made: simple (overhand knot) and through loop. It was observed that, in most cases, the simple loop was pulled through the prosthesis. Therefore, the
obtained strength value represented a lower limit to the vascular graft suture retention strength. Suture through loops caused the failure of graft wall, giving thus an upper limit to the vascular graft suture retention strength.
Measured values for the three different graft thicknesses are presented in Table 3. As expected, the suture retention strength increased for the thicker graft (po0.05). Interest-ingly, there was not found significant difference between the results for small and medium thickness (#2 and #3).
Porcine aortic and carotid arteries presented suture reten-tion strength values within 2.5–3.3 N (Drilling et al., 2009), whereas murine aortic artery showed a value of 1.770.7 N
(Bergmeister et al., 2013), both in the same range than our
bilayered grafts. It was reported that human mammary artery suture retention strength was 1.470.01 N, and saphenous vein presented a value of 1.8170.02 N (Konig et al., 2009). In the same work, the authors established that vessels with suture retention strengths as low as 0.74 N have been suc-cessfully implanted with no complications. The measured strength values for the bilayered grafts were higher than this lower limit.
Table 2–Initial Young's modulus, ultimate tensile strength and strain in the vascular graft circumferential and axial testing directions.
Young's Modulus (MPa)
Ultimate tensile strength (MPa)
Ultimate tensile strain (%)
Circumferential 6.2471.69# 2.0770.17 233.17734.62 Axial 29.5475.85 2.5670.28 142.14723.87
#No statistical significance (po0.05) with both PLLA/PHD 90/10 and
PLLA/PHD 50/50 (outer and inner layers).
Table 3–Suture retention strength for bilayered vascular grafts.
Thickness Suture retention strength/simple loop (N)
Suture retention strength/ through loop (N)
#1 0.9870.25a,b 1.6370.24a,b #2 1.4670.35b 2.2870.23b #3 1.5570.42a 2.4570.27a
a,bstatistical difference (po0.05) for grafts of thickness #1 with
thicknesses #2 and #3, respectively.
0.99 1.00 1.01 1.02 1.03 1.04
40 60 80 100 120 140 160 180 200 220
Pressure (mmHg)
D/D0
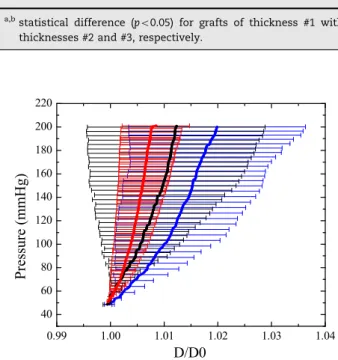
Fig. 5–Pressure vsD/D0curves for bilayered vascular grafts
These results demonstrate that the electrospun bilayered grafts could be sutured at the anastomosis site without suffering damage.
3.4. Pressure vs. diameter test
Fig. 5 presents the average normalized pressure-diameter
curves for the three groups of bilayered vascular grafts with different thickness and not subjected to axial stretch (L/L0¼1). The diameter variation was represented as the ratio D/D0, where D0 is the graft diameter at a 50 mmHg transmural pressure. Mean values and standard deviations are shown.
As seen infigure, bilayered vascular grafts mimicked the J-shaped response seen in natural arteries in the extended physiologic pressure range.
It is hypothesized that this response was the consequence of a combination of the graft random nanofibrous topography with the layers gap in-between, and the small strains reached in the physiological pressure range (below 3%). The recruit-ment of nanofibers with increasing pressure induced a no-linear response, where stiffness increased as more fibers
supported the load, as seen in uniaxial tensile tests (Section 3.2) for deformations under 10%. Besides, in the same way as the design presented by Sonodaet al., the internal layer is the responsible for supporting the internal pressure at low pressure ranges, and after a certain deformation is achieved, the internal and external layers support the pressure together
(Sonoda et al., 2001;Sonoda et al., 2003).
When compared with natural coronary arteries and other arteries and veins used for bypass surgery (Figs. 6 and 7)
(Claes, 2010), vascular grafts showed a more rigid response
than young coronary arteries and closer to old arteries. In all cases, curves were within the scatter band of natural vessels. As shown in thefigures, the grafts presented a behavior close to saphenous veins, which is one of the conduits of choice with a high rate of success (Canver, 1995). These results highlight the J-shaped response obtained, since it is in the order of small-diameter natural vessels.
The three grafts with different thickness were also tested at a constant axial elongation of L/L0¼1.05 and L/L0¼1.1. When an axial elongation of 1.1 was applied the grafts suffered plastic deformation. Therefore,L/L0¼1.05 was taken
0.98 1.00 1.02 1.04 1.06 1.08 1.10 40
60 80 100 120 140 160 180 200 220
Pressure
(m
mHg)
D/D0
0.98 1.00 1.02 1.04 1.06 1.08 1.10 40
60 80 100 120 140 160 180 200 220
Pressure (m
mHg)
D/D0
0.98 1.00 1.02 1.04 1.06 1.08 1.10
40 60 80 100 120 140 160 180 200 220
Pressure (mmHg
)
D/D0
Fig. 6–Pressure vsD/D0curves for bilayered vascular grafts (black) of a) thickness #1, b) thickness #2 and c) thickness #3,
as the maximum elongation allowed during the managing, suturing and surgical procedure. However, the J-response was not altered by the plastic deformation suffered (Fig. 8). On the other hand, a higher axial elongation led to a more pro-nounced J-response, which was evidenced through a higher compliance than atL/L0¼1, especially for grafts with thick-ness #3 (Table 5). The same tendency was seen for natural arteries. However, due to the high deviation observed in both electrospun grafts and natural vessels it is hard to differenti-ate the more compliant behavior. Therefore it can not be assume as a fact.
The grafts mechanical response to internal pressure when an axial elongation was applied was also compared with coronary arteries behavior. Due to the lack of assays for coronary arteries at L/L0¼1.05, data atL/L0¼1.1 were used. It could be appreciated that vascular grafts of thickness #3 presented a more similar response to coronary arteries
(Fig. 9). Although the grafts presented a less compliant
behavior, part of the old coronary arteries curve (physiologic range 80–120 mmHg) was included within the error bars of thickness #3 vascular grafts. Even more, vascular grafts
deviation and the ones for both coronary arteries overlapped through the pressure range studied.
The compliance was calculated at three different pressure ranges according to the cardiovascular implants-tubular vas-cular prostheses standard (ANSI/AAMI/ISO, 2010) and Eq. (1)(
Tables 4and5).
As observed in the error bars of the pressure-diameter curves, the compliance values for both vascular grafts and natural blood vessels presented high deviations.The obtained values for L/L0¼1 only presented significant differences (po0.05) at low (50–90 mmHg) and high pressure (110–
150 mmHg) ranges, especially for thickness #1 grafts
(Table 4). At the close physiologic range (80–120 mmHg), the
compliance values for all bilayered vascular grafts were statistically similar to the ones of the analized blood vessels (po0.05). However, the mean value was closer to saphenous veins, which presented a less compliant behavior.
Compliance values were also obtained for grafts tested at an axial elongationL/L0¼1.05 (Table 5) and coronary arteries at L/L0¼1.1. The grafts values were in the order of coronary arteries. In general, the bilayered vascular grafts of thickness
0.98 1.00 1.02 1.04 1.06 1.08 1.10 40
60 80 100 120 140 160 180 200 220
Pressure (mmHg)
D/D0
0.98 1.00 1.02 1.04 1.06 1.08 1.10 40
60 80 100 120 140 160 180 200 220
Press
u
re
(m
mHg)
D/D0
0.98 1.00 1.02 1.04 1.06 1.08 1.10
40 60 80 100 120 140 160 180 200 220
Pre
ssur
e (mm
H
g)
D/D0
Fig. 7–Pressure vsD/D0curves for bilayered vascular grafts (black) of a) thickness #1, b) thickness #2 and c) thickness #3,
#2 and #3 presented compliance values similar to coronary and radial arteries, and saphenous veins at the different applied axial elongations (Fig. 10). These results convert the bilayered vascular grafts in good potential candidates for long implantation times, being the compliance mismatch at the anastomosis the main cause of the present synthetic vascular grafts failure (Weston et al., 1996;Salacinski et al., 2001).
Results obtained for the bilayered vascular grafts corrobo-rated that PLLA and PHD display similar properties to collagen and elastin, respectively. Natural arteries layered structure was mimicked as well as their biomimetic behavior by electro-spinning of the selected blends. Even more, the bilayered vascular grafts compliance was superior to the one presented by ePTFE commercial graft (0.1%/100 mmHg) (Yin et al., 2013).
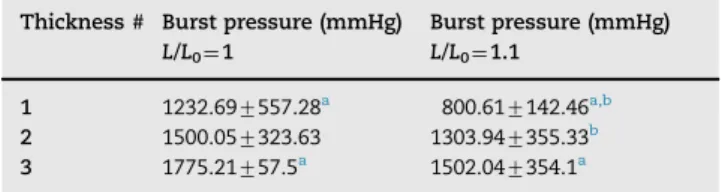
3.5. Burst pressure test
The burst pressure was measured for the different thickness vascular grafts at two different constantL/L0axial elongations
(Table 6). Even though the obtained values increased with the
grafts thickness, they only presented significant statistical differences (po0.05) between the values of thickness #1 and #3. ForL/L0¼1.1, there were also statistical differences between the values for thickness #1 and #2. On the other hand, a lower
1.00 1.02 1.04 1.06
40 60 80 100 120 140 160 180 200 220
Pressure (mm
H
g)
D/D0
1.00 1.02 1.04 1.06
40 60 80 100 120 140 160 180 200 220
Pre
ss
u
re
(mmHg)
D/D0
Fig. 8–Pressure vsD/D0curves for bilayered vascular grafts
of thickness #1 (red), thickness #2 (blue) and thickness #3 (black) atL/L0¼1.05 (a) andL/L0¼1.1 (b). (For interpretation of
the references to color in thisfigure legend, the reader is referred to the web version of this article.)
0.98 1.00 1.02 1.04 1.06 1.08 1.10
40 60 80 100 120 140 160 180 200 220
Pressu
re (mmHg
)
D/D0
Fig. 9–Pressure vsD/D0curves for bilayered vascular grafts
of thickness #1 (red), thickness #2 (blue) and thickness #3 (black) atL/L0¼1.05, compared with young (light blue) and
old coronary arteries (green) atL/L0¼1.1 (Claes, 2010). (For
interpretation of the references to color in thisfigure legend, the reader is referred to the web version of this article.)
Table 4–Vascular grafts, coronary, radial, and mammary arteries, and saphenous veins compliance (%C) (102 mmHg) at different pressure ranges. No axial elongation.
Pressure range (mmHg) 50–90 80–120 110–150
Vascular graft #1 1.0470.95 0.5770.40 0.4470.33 Vascular graft #2 2.2072.08 1.4571.39 1.0270.67 Vascular graft #3 1.3571.80 1.1271.74 0.9671.47 Young coronary 8.9277.67 3.3976.03 2.6970.89a,b Old coronary 4.0172.08a 4.0673.16 3.4271.72a Mammary 21.05726.04 5.2275.13 1.7971.96 Radial 5.6672.12a,c 2.0573.68 1.0674.73 Saphenous 2.6071.72 1.7771.20 0.6771.89
a,b,cstatistical difference (po0.05) compared with bilayered
vascu-lar grafts of thickness #1, #2 and #3, respectively.
Table 5–Vascular grafts (atL/L0¼1.05) and coronary arteries (atL/L0¼1.1) %C (102mmHg) at different pres-sure ranges.
Pressure range (mmHg)
50–90 80–120 110–150
Vascular graft #1 2.3070.97 1.6070.64 1.2470.62 Vascular graft #2 3.4472.58 1.7270.96 1.5071.15 Vascular graft #3 2.4272.78 1.5971.85 1.1371.23 Young coronary 10.3278.24 3.5272.73 2.6970.89a Old coronary 6.7371.46a,c 5.7171.83a,b,c 3.9371.39a,b,c
a,b,cstatistical difference (po0.05) compared with bilayered
burst pressure was observed when a higher axial deformation was applied. However, when comparing the values for the same thickness they did not present statistical differences (po0.05). This result indicated that the grafts burst pressure would not be altered by the application of an axial elongation when suturing at the anastomosis site.
Bilayered vascular grafts displayed values consistent with human mammary arteries and saphenous veins, which have burst pressure between 2031–4225 mmHg (Yin et al., 2013), and 12507500 mmHg (Soletti et al., 2010), respectively. Coronary arteries burst pressure is also in the order, about 2000 mmHg
(L'Heureux et al., 2006). Even more, the bilayered vascular
grafts burst pressure values are highly superior to the physio-logic pressures at which the grafts would be subjectedin vivo.
3.6. Mechanical modeling
First, the selected model was validated for the bilayered vascular graft of thickness #3, where the estimated CWS (Eqs. (3) and (8)) was compared with the media circumfer-ential strength (sm) calculated from the experimental pressure-diameter tests (Eq. (2)). The initial Young's modulus values obtained from the tensile test were used in the model, as well as the grafts thickness and radius. CWS values ranged from 135 to 220 kPa, which were in accordance with the
experimentalsm(162.97715.01 kPa) for the physiologic pres-sure range (80–120 mmHg).
The effect of the graft thickness on CWS value was modeled, due to the increase seen experimentally in the grafts compliance when their thickness was increased.
It was observed that the increase in the graft thickness resulted in a decrease of CWS towards values nearer to natural arteries (Fig. 11(a)) (McClure et al., 2010;Claes, 2010). The difference between the CWS values of each layer was also reduced as the thickness increased.
The effect of the grafts internal diameter was also studied taking into account the existence of smaller coronary arteries. A similar effect as the one observed with the increase in the grafts thickness was found as the internal diameter decreased (Fig. 11(b)). This result predicted that the selected grafts composition would also result in a biomimetic response for smaller-diameter applications.
The response of a bilayered vascular graft with 2 mm inner diameter and twice its thickness was modeled
(Fig. 12). The combination of a higher thickness and a smaller
internal diameter resulted in closer CWS values to natural arteries values.
Even though it is known that only media and adventitia layers are responsible for the mechanical response of the arterial wall (Holzapfel et al., 2000), the present tendency is heading towards the development of trilayered vascular grafts. By using the trilayered model, the addition of a third layer to the grafts and its effect on CWS values was modeled. The addition of a layer of PLLA or PHD on the inside or outside of the grafts was modeled. The best results were obtained for the addition of an outer PLLA layer, where closer CWS values to natural arteries were obtained for the inner and medium layers, without abrupt differences in between these values. A trilayered graft with smaller inner diameter and this layered configuration was modeled to predict the CWS values when smaller coronary arteries need to be replaced.
The CWS values predicted were in the order of the ones observed for natural arteries (Fig. 13) (McClure et al., 2010; vg #1 vg #2 vg #3 y-cor o-cor mam rad saf
0 2 4 6 8 10 12 14 16 18 20
% C
graft-vessel
vg #1 vg #2 vg #3 y-cor o-cor
0 2 4 6 8 10 12 14 16 18 20
% C
graft-vessel
Fig. 10–Compliance values (102mmHg) (pressure range: 80–120 mmHg) for a) bilayered vascular grafts of thickness #1, #2
and #3 compared with coronary, mammary and radial arteries atL/L0¼1, and b) bilayered vascular grafts of thickness #1, #2
and #3 atL/L0¼1.05 compared with coronary arteries atL/L0¼1.1 (Claes, 2010).
Table 6–Bilayered vascular grafts burst pressure at differentL/L0.
Thickness # Burst pressure (mmHg)
L/L0¼1
Burst pressure (mmHg)
L/L0¼1.1 1 1232.697557.28a 800.617142.46a,b 2 1500.057323.63 1303.947355.33b 3 1775.21757.5a 1502.047354.1a
a,bstatistical difference (po0.05) for thickness #1 vascular grafts
Claes, 2010). The addition of a third layer is considered as a potential modification to the graft structure in order to obtain a more biomimetic mechanical response.
4.
Conclusions
The pure polymers mechanical results corroborated the hypothesis that nanofibrous PLLA presents a mechanical behavior similar to collagen, while nanofibrous PHD has a
more elastic response like elastin. The contribution of these bioresorbable synthetic polymers to the whole grafts mechanical behavior, together with the nanofibrous layered structure, resulted in J-shaped response with biomimetic characteristics when subjected to internal pressure. Even more, the grafts compliance values were in the order of natural coronary arteries and very close to the bypass gold standard, saphenous vein. The suture retention strength and
2.5
2.6
2.7
2.8
2.9
3.0
3.1
3.2
0
50
100
150
200
2.5
2.6
2.7
2.8
0
50
100
150
200
0
50
100
150
200
2.5
2.6
2.7
radius (mm)
Circum
fere
n
tia
l w
all strength (kPa
)
1.0
1.1
1.2
0
50
100
150
200
1.5
1.6
1.7
0
50
100
150
200
0
50
100
150
200
2.5
2.6
2.7
radius (mm)
Circum
fere
n
tia
l w
all strength (kPa
)
Fig. 11–CWS values for the bilayered vascular graft of thickness #3 obtained by mechanical modeling: a) as a function of thickness, where original thickness (black), 50% higher thickness (red) and double thickness (green); b) as a function of internal diameter, where 5 mm (original) (black), 3 mm (red) and 2 mm (green). (For interpretation of the references to color in thisfigure legend, the reader is referred to the web version of this article.)
1.0 1.1 1.2 1.3
0 10 20 30 40 50 60
Circumf
er
ential wa
ll strength (kPa)
radius (mm)
Fig. 12–CWS curve for a bilayered vascular graft of 2 mm inner diameter and twice thickness #3.
1.0 1.1 1.2 1.3 1.4 1.5
0 5 10 15 20 25 30 35 40 45 50 55 60
Circumferential wall strength (kPa)
radius (mm)
burst pressure values were also in the range of the ones presented by natural vessels. The mechanical modeling also predicts that with an increase in the grafts thickness and the addition of a third layer, a more biomimetic response could be achieved.
These results are very promising towards the use of these nanofibrous vascular grafts as small-diameter vessel repla-cements.
Acknowledgment
F. Montini-Ballarin thanks to CONICET for the postdoctoral scholarship. This work was supported by the Argentinean National Agency of Scientific and Technological Promotion (PICT 224), and CONICET (PIP 0089).
D. Calvo, F. J. Rojo, G. V. Guinea gratefully acknowledge financial support provided by Ministerio de Economía y Competitividad in Spain through projects MAT2012-36096 and MAT2012-38412, by the Comunidad de Madrid (Grant S2011/BMD-2460) and by Fundación Botín and Banco Santan-der through its SantanSantan-der Universities Global Division (Grant SE14005001).
r e f e r e n c e s
Abbott, W.M., et al., 1987. Effect of compliance mismatch on vascular graft patency. J. Vasc. Surg.5(2), 376–382.
Agarwal, S., Wendorff, J.H., Greiner, A., 2008. Use of electrospin-ning technique for biomedical applications. Polymer49(26), 5603–5621.
ANSI/AAMI/ISO, ANSI/AAMI/ISO7198:1998/2001/(R)2010 Cardio-vascular implants-Tubular Cardio-vascular prostheses, 2010, Asso-ciation for the Advancement of Medical Instrumentation: Arlington, VA.
Armentano, R.L., et al., 1995. Arterial wall mechanics in conscious dogs: assessment of viscous, inertial, and elastic moduli to characterize aortic wall behavior. Circ. Res.76(3), 468–478. Armentano, R.L., et al., 1991. Assessment of elastin and collagen
contribution to aortic elasticity in conscious dogs. Am. J. Physiol. 260 (6 Pt 2), H1870–H1877.
Barra, J.G., et al., 1993. Assessment of smooth muscle contribu-tion to descending thoracic aortic elastic mechanics in con-scious dogs. Circ. Res.73(6), 1040–1050.
Bergel, D.H., 1961. The static elastic properties of the arterial wall. J. Physiol.156(3), 445–457.
Bergel, D.H., 1961. The dynamic elastic properties of the arterial wall. J. Physiol.156(3), 458–469.
Bergmeister, H., et al., 2013. Healing characteristics of electrospun polyurethane grafts with various porosities. Acta Biomater.9 (4), 6032–6040.
Canver, C.C., 1995. Conduit options in coronary artery bypass surgery. Chest108(4), 1150–1155.
Caracciolo, P.C., Buffa, F., Abraham, G.A., 2009. Effect of the hard segment chemistry and structure on the thermal and mechanical properties of novel biomedical segmented poly (esterurethanes). J. Mater. Sci.: Mater. Med.20(1), 145–155. Catto, V., et al., 2015. Small diameter electrospun silk fibroin
vascular grafts: mechanical properties, in vitro biodegradability, and in vivo biocompatibility. Mater. Sci. Eng.: C54(0), 101–111. Claes, E., 2010. Estudio meca´nico de las arterias coronarias
humanas y sus sustitutos vasculares, tesis doctoral, in Escuela te´cnica superior de ingenieros de caminos, canales y puertos. Universidad Polite´cnica de Madrid, Madrid, Spain310.
Dahlin, R.L., Kasper, F.K., Mikos, A.G., 2011. Polymeric nanofibers in tissue engineering. Tissue Eng. Part B: Rev.17(5), 349–364. Donovan, D.L., et al., 1990. Material and structural characteriza-tion of human saphenous vein. J. Vasc. Surg.12(5), 531–537. Drilling, S., Gaumer, J., Lannutti, J., 2009. Fabrication of burst
pressure competent vascular grafts via electrospinning: effects of microstructure. J. Biomed. Mater. Res. Part A88A(4), 923–934.
El-Kurdi, M.S., et al., 2008. Transient elastic support for vein grafts using a constricting microfibrillar polymer wrap. Biomaterials 29(22), 3213–3220.
Fung, Y.-C., 1993. Biomechanics: Mechanical Properties of Living Tissues, 2 ed. Springer-Verlag, New York568.
Han, F., et al., 2013. Performance of a multilayered small-diameter vascular scaffold dual-loaded with VEGF and PDGF. Bioma-terials34(30), 7302–7313.
Hasan, A., et al., 2014. Electrospun scaffolds for tissue engineer-ing of vascular grafts. Acta Biomater.10(1), 11–25.
Holzapfel, G., Gasser, T., Ogden, R., 2000. A new constitutive framework for arterial wall mechanics and a comparative study of material models. J. Elast. Phys. Sci. Solids61(1-3), 1–48.
Kannan, R.Y., et al., 2005. Current status of prosthetic bypass grafts: a review. J. Biomed. Mater. Res. Part B: Appl. Biomater. 74B(1), 570–581.
Konig, G., et al., 2009. Mechanical properties of completely autologous human tissue engineered blood vessels compared to human saphenous vein and mammary artery. Biomaterials 30(8), 1542–1550.
Kurobe, H., et al., 2012. Concise review: tissue-engineered vas-cular grafts for cardiac surgery: past, present, and future. Stem Cells Transl. Med.1(7), 566–571.
L’Heureux, N., et al., 2006. Human tissue-engineered blood ves-sels for adult arterial revascularization. Nat. Med.12(3), 361–365.
Lee, S.J., et al., 2008. Development of a composite vascular scaffolding system that withstands physiological vascular conditions. Biomaterials29(19), 2891–2898.
McClure, M.J., et al., 2010. A three-layered electrospun matrix to mimic native arterial architecture using polycaprolactone, elastin, and collagen: a preliminary study. Acta Biomater.6(7), 2422–2433.
McClure, M.J., et al., 2011. Bioengineered vascular grafts: improving vascular tissue engineering through scaffold design. J. Drug Deliv. Sci. Technol.21(3), 211–227. McClure, M.J., Simpson, D.G., Bowlin, G.L., 2012. Tri-layered
vascular grafts composed of polycaprolactone, elastin, col-lagen, and silk: Optimization of graft properties. J. Mech. Behav. Biomed. Mater.10(0), 48–61.
McMahon, R.E., et al., 2010. Hydrogel–electrospun mesh compo-sites for coronary artery bypass grafts. Tissue Eng. Part C: Methods17(4), 451–461.
Montini Ballarin, F., et al., 2014. Optimization of poly(l-lactic acid)/ segmented polyurethane electrospinning process for the pro-duction of bilayered small-diameter nanofibrous tubular structures. Mater. Sci. Eng.: C42(0), 489–499.
Nerem, R.M., 2003. Role of mechanics in vascular tissue engi-neering. Biorheology40(1-3), 281–287.
O’Rourke, M.F., 1982. Arterial Function in Health and Disease. Churchill Livingstone, Edinburgh.
Pai, C.-L., Boyce, M.C., Rutledge, G.C., 2011. On the importance of fiber curvature to the elastic moduli of electrospun nonwoven fiber meshes. Polymer52(26), 6126–6133.
Pu, J., Komvopoulos, K., 2014. Mechanical properties of electro-spun bilayer fibrous membranes as potential scaffolds for tissue engineering. Acta Biomater.10(6), 2718–2726.
electrospinning technique. Tissue Eng. Part C: Methods18(8), 567–574.
Ravi, S., Chaikof, E.L., 2009. Biomaterials for vascular tissue engineering. Regen. Med.5(1), 107–120.
Rizvi, M.S., et al., 2012.Mathematical model of mechanical behavior of micro/nanofibrous materials designed for extracellular matrix sub-stitutes. Acta Biomater.8(11), 4111–4122.
Roach, M.R., Burton, A.C., 1957. The reason for the shape of the distensibility curves of arteries. Can. J. Biochem. Physiol.35 (8), 681–690.
Salacinski, H.J., et al., 2001. The mechanical behavior of vascular grafts: a review. J. Biomater. Appl.15(3), 241–278.
Salvucci, F.P., et al., 2009. Association between mechanics and structure in arteries and veins: theoretical approach to vas-cular graft confection. Conf. Proc. IEEE Eng. Med. Biol. Soc. 2009, 4258–4261.
Seifu, D.G., et al., 2013. Small-diameter vascular tissue engineer-ing. Nat. Rev Cardiol10(7), 410–421.
Sell, S.A., et al., 2009. Electrospinning of collagen/biopolymers for regenerative medicine and cardiovascular tissue engineering. Adv. Drug Deliv. Rev.61(12), 1007–1019.
Shadwick, R.E., 1999. Mechanical design in arteries. J. Exp. Biol. 202(Pt 23), 3305–3313.
Sill, T.J., von Recum, H.A., 2008. Electrospinning: applications in drug delivery and tissue engineering. Biomaterials29(13), 1989–2006.
Soletti, L., et al., 2010. A bilayered elastomeric scaffold for tissue engineering of small diameter vascular grafts. Acta Biomater. 6(1), 110–122.
Sonoda, H., et al., 2001. Small-diameter compliant arterial graft prosthesis: Design concept of coaxial double tubular graft and its fabrication. J. Biomed. Mater. Res.55(3), 266–276. Sonoda, H., et al., 2003. Coaxial double-tubular compliant arterial
graft prosthesis: time-dependent morphogenesis and com-pliance changes after implantation. J. Biomed. Mater. Res. Part A65A(2), 170–181.
Vorp, D., et al., 1995. Modeling the transmural stress distribution during healing of bioresorbable vascular prostheses. Ann. Biomed. Eng.23(2), 178–188.
Weston, M.W., Rhee, K., Tarbell, J.M., 1996. Compliance and diameter mismatch affect the wall shear rate distribution near an end-to-end anastomosis. J. Biomech.29(2), 187–198. Yin, A., et al., 2013. Electrospinning
collagen/chitosan/poly(L-lactic acid-co-ϵ-caprolactone) to form a vascular graft: Mechanical and biological characterization. J. Biomed. Mater. Res. Part A101A(5), 1292–1301.