MEASUREMENTS PROCEDURES FOR AN
ADAPTIVE ANTENNA SYSTEM: APPLICATION
TO WCDMA
M. Sierra-Pérez, M. Calvo, L. de Haro, R. Martínez, M. Sierra-Castañer, L. García, A. Martínez, F. J. García-Madrid, J.L. Masa, J.M. Serna
Grupo de Radiación. Dept. de Señales, Sistemas y Radiocomunicaciones. Univ. Politécnica de Madrid. E.T.S.I. de Telecomunicación. Ciudad Universitaria. 28040 Madrid.
Tel. +34 913367360. Fax. +34 915432002. e-mail: [email protected]
Abstract— Adaptive type smart antennas have not been implemented yet on the deployed UMTS systems, although UTRA-UMTS preview their operation and they also could improve capacity especially in a multiservice environment. This paper describes a set of novel measurement techniques that must be performed to evaluate the correct operation of a smart antenna system. The paper also describes the measurements carried out on a UMTS smart antenna prototype.
Keywords-component; smart antenna, adaptive antenna measurement procedure, UMTS.
I. INTRODUCTION
Actual antenna measurements standards do not cover procedures to asses the performances of smart antennas and their associated adaptive algorithms. Those adaptive or reconfigurable algorithms are actually evaluated as a subsystem and the antenna array patterns are measured independently. Algorithm developers provide performances, usually based on simulations, intending to include radio channel impairments but usually forgetting important antenna features. On the other side, antenna engineers compute and measure classical parameters (gain, beam width, band width, SLL, etc.) forgetting adaptive algorithms considerations. However, operators and terminal manufacturers need to know the full smart antenna system performance. Antenna pattern should be statistically measured implementing not only the real adaptive or reconfigurable algorithm but also, and what is more important, including the real modem signal.
Measurements should be made not only in anechoic chambers but also in a real deployment scenario to include the radio channel impairments along with the adaptive antenna system. Besides those facts, measurements of different smart antennas should be compared so that standard measurements are to be proposed.
In this contribution, we explain a set of novel measurement procedures that have been applied to characterize an adaptive antenna prototype (namely the ADAM system[1]) in different conditions. ADAM system operates in WCDMA scenarios, and according to the performance results, adaptive system [2] ADAM will contribute to enhance system capacity with respect to a conventional sectored antenna especially in mixed services scenarios.
II. ADAM PROTOTYPE
ADAM stands for ADaptive Antenna for Multioperator scenarios, a smart antenna prototype developed for UMTS. Unlike currently existing adaptive antenna systems, ADAM can be easily connected to any standard Node B site even shared by several operators using equipment from different manufacturers. Those unique characteristics allow a straightforward deployment of ADAM over any existing UMTS [3,4] cellular network.
Figure 1 shows the architecture of ADAM implementation. To allow the “plug and play” functionality ADAM antenna is connected to Node B using the 3GPP standard Uu interface [5]. There is a direct connection between the smart antenna RF outputs and the base station RF inputs. Therefore demodulated UMTS signals, used to determine antenna weights, must be remodulated again and upconverted before being sent to the base station in the uplink.
TRX Proceso adaptativo Proceso adaptativo TRX Node B Link MODEM Adaptive process. TRX Radio-link BEAM FORMER Transmitter Receiver Transmitter Receiver Dig ital MODEM Dig ital MODEM BEAM FORMER Transmitter Receiver Transmitter Receiver NO DE B Uu TRX Proceso adaptativo Proceso adaptativo TRX Node B Link MODEM Adaptive process. TRX Radio-link BEAM FORMER Transmitter Receiver Transmitter Receiver Dig ital MODEM Dig ital MODEM BEAM FORMER Transmitter Receiver Transmitter Receiver TRX Proceso adaptativo Proceso adaptativo TRX Node B Link MODEM Adaptive process. TRX Radio-link BEAM FORMER Transmitter Receiver Transmitter Receiver Dig ital MODEM Dig ital MODEM BEAM FORMER Transmitter Receiver Transmitter Receiver NO DE B NO DE B Uu Uu
Figure 1: ADAM system architecture to be deployed on a standard node B
ADAM has been implemented using a Software Defined Radio (SDR) architecture, so that it can be easily reconfigured and updated with more advanced versions. ADAM prototype is formed by four independent subsystems:
Antenna array: it uses four conventional UMTS sectored antennas to produce a 120º cellular coverage.
RF-IF sections: this stage performs the up- and down-conversion stages, using analog signals at 44 MHz IF. Wideband ADCs and DACs are used at IF instead of at baseband
MODEM: its main tasks include the set-up procedure, synchronization stages and modulation/demodulation of the DPCCH for each user in order to obtain the reference signal needed for the beamforming section.
Adaptive beamfomer: its main task is the calculation of the adaptive set of beamforming weights for each user. For this computation, the NLMS algorithm has been used.
Figure 2 shows the antenna array subsystem (left) and the rack with boards of the other subsystems connected to the measurement equipment (right).
Figure 2: ADAM prototype a) Antenna array b) RF-IF and SDR modules
III. INTEGRATION TESTS
Before carrying out performance measurements with the complete system in different deployment scenarios, several preliminary integration tests were done. The aim of these tests is to prove that all the subsystems perform their functions properly and can be interconnected.
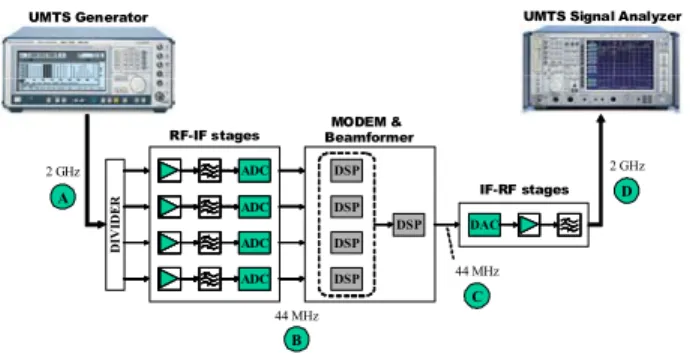
We focus now on the integration tests between the RF-IF and MODEM sections. The testbed used in the integration tests for the uplink is shown in Figure 3. The test procedure consists in the injection of a real UMTS signal into the ADAM RF-IF section (test point A). This signal is passed through a 1-to-4 divider, producing a signal vector that emulates the reception in the antenna array from the broadside direction (point B).
Figure 3: Uplink integration tests set-up.
Once the signals received in the array have been downconverted and digitized, the DSP boards of the MODEM section demodulate the DPCCH for every user, and then the beamformer calculates the array weights. The signal in the array output (point C) is finally upconverted and sent to a UMTS signal analyzer (point D).
In order to prove the connectivity of the system, the signal analyzer has to demodulate correctly the signals. This implies that the RF-IF sections do not degrade the quality of the signal and also that the MODEM processing is capable of tracking the received signals.
Different tests must be done changing the characteristics of the UMTS signals, such as the SNR or the number and power of the users, in order to evaluate the limits for the correct operation of the ADAM prototype.
Other tests have been done to evaluate the correct performance of each individual subsystem. For example, the gain, intermodulation products, dynamic range, bandwidth and ACLR must be measured in each RF-IF stage in order to calibrate the system. Also the software routines calculating the BER or the synthesized antenna array factor must be tested. All the test follows the 3GPP standard proposed for Node Bs [6], and have been automated using the LabVIEW software.
The measured magnitudes are maximum output power, frequency error, error vector magnitude, power dynamic range, adjacent channel leakage power ratio, occupied bandwidth, emitted spectral mask, spurious emissions and peak code
ADC ADC ADC ADC ADC ADC ADC ADC ADC ADC ADC ADC DI VI DE R DSP DSP DSP DSP DAC DAC DSP RF-IF stages BeamformerMODEM &
IF-RF stages
2 GHz 2 GHz
44 MHz
44 MHz
UMTS Generator UMTS Signal Analyzer
A
B
C
domain error in transmission. In reception the measured parameters are reference sensitivity level, dynamic range, adjacent channel selectivity and spurious emissions.
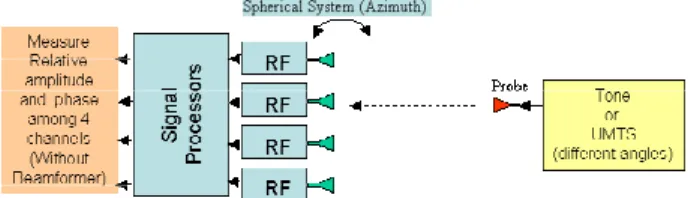
IV. SMART ANTENNA CALIBRATION Once the integration tests have been checked and passed, the next step consists in calibrating the smart antenna, in uplink and downlink. Calibration is required because uplink adaptive weights are used to calculate downlink adaptive weights, so a good characterization of different antenna channels and coupling among these circuits is required. Calibration process provides the uplink and downlink coupling matrixes.
Uplink calibration procedure (Figure 4) is carried out in a far field anechoic system, measuring relative amplitude and phase among the received signals in the four antennas (without the beamformer), transmitting a UMTS signal (a tone can be also used as transmitted signal) from different angular positions. The measured data allows us to solve an over determined linear system of equations, and calculate the elements of the uplink calibration matrix.
Figure 4: Uplink calibration set up.
Downlink calibration procedure (Figure 5) is slightly different. A tone is used as transmitting signal, and different orthogonal combinations of weights are chosen for the four channels. The receiver (Vector network analyser) compares the signal in the probe with one sample obtained from transmitting antenna 1 input through a directional coupler. Different data can be obtained in different angular positions of the probe respect the AUT, and an over determined linear system is solved to obtain the downlink calibration matrix.
Figure 5: Downlink calibration set up.
The inverse matrixes of the previous ones are calculated to compensate the errors in the smart antenna algorithm.
V. SMART ANTENNA CHARACTERIZATION Once the calibration is carried out, the final step consists in measuring the complete system in normal operation conditions. Two scenarios have been considered to make the final measurements: an anechoic chamber to measure some radiation patterns and a more realistic environment to estimate 'G and 'C/I.
The first one deals with the measurement of ADAM performance in a controlled scenario, that is, inside an anechoic chamber. Measurements are carried out in a far-field condition is satisfied (d>2R2/O~5.2 m). A set of positioning devices is
used to roll the smart antenna over the azimuth domain [7]. The procedure to evaluate the smart antenna patterns is as follows:
1. Some situations of desired user signal and interference signals are chosen. (1 or none interferences are chosen)
2. Smart antenna begins its adaptive process and adaptive weights are extracted for downlink and uplink. (Figure 6)
3. These weights are fixed in the smart antenna system and the main pattern of the array is measured for uplink (receiving) and downlink (transmitting) situations. (Figure 7)
ANTENNA ARRAY
INTERFERING USER
DESIRED USER
ADAM PROTOTYPE
ADAPTIVE WEIGHTS wr,wi
MEASUREMENT EQUIPMENTS ANECHOIC CHAMBER
ANTENNA ARRAY
DESIRED USER
ADAM PROTOTYPE
ADAPTIVE WEIGHTS wr,wi
MEASUREMENT EQUIPMENTS ANECHOIC CHAMBER
Figure 7: Radiation pattern measurement
Figure 8 shows one of the measurement carried out, for a desired signal from 0 deg and an interference signal from 15 deg.
Figure 8: Uplink radiation pattern for 0deg desired signal and 15deg interference signal
The last set of measurements is carried out in a more realistic environment, trying to characterize the performance of the antenna with the actual propagation channel. The objective is the estimation of 'G (working only with the desired user) and 'C/I (working with one desired user and one interfering user). The antenna is set in a sub-urban site and two users are located in different positions around this site (Figure 9).
Once one location of interference, desired signal and smart antenna is chosen, the procedure is as follows:
For'G measurement:
1. Desired signal transmits, and smart antenna begins the adaptive process, obtaining the adaptive weights in uplink and downlink.
2. The system is fixed and received signals in uplink and downlink are measured with a spectrum analyzer (Ca).
3. Smart antenna is replaced by a conventional sector antenna and received signals in uplink and downlink are measured (Cc).
4. 'G is obtained: 'G (dB) =Ca (dBm) – Cc (dBm)
Uplink Interference
... .. ... ....
... .. ... .... Downlink
PC
UMTS generat
or Spectrum
analyser
... .. ... ....
... .. ... ....
ADAM prototype Array
UMTS generat
or Spectrum analyser UMTS generat or Spectrum
analyser
Signal Uplink Interference
... .. ... ....
... .. ... .... Downlink
PC
UMTS generat
or Spectrum
analyser
... .. ... ....
... .. ... ....
ADAM prototype Array
UMTS generat
or Spectrum analyser UMTS generat or Spectrum
analyser
Signal
Figure 9: Measurements in “real” environment set up
For'C/I measurement:
1. Desired and interference signal transmit, and smart antenna begins the adaptive process, obtaining the adaptive weights in uplink and downlink.
2. The system is fixed and received signals in uplink, transmitting only first the desired signal Ca, and secondly the interference signal Ia, are measured with a spectrum analyzer, in the smart antenna output. The same can be done in downlink, transmitting from the smart antenna and measuring in both desired and interfering signals. C/I is obtained: (C/I)a (dB) = Ca (dBm) – Ia (dBm)
3. Smart antenna is replaced by a conventional sector antenna and received signals in uplink and downlink are measured; comparing the values between smart antenna and conventional sector antenna. (C/I)c is obtained.
Table I shows the results obtained with a first measurement following this procedure, comparing with the theoretical or simulated results and the results estimated through the measurement of the radiation pattern. More measurements are being carried out, and a study of them will presented in the conference.
'G 'C/I
Theoretical / Simulated 6.2 dB 14.4 dB
Measured 6 dB 12.5 dB
Calculated from Radiation pattern - 14.5 dB
Table I: Measured and Calculated values of 'G and 'C/I
Further measurements must be carried out in a real environment, that is through “drive-test” in a cellular network, comparing the performance of a sector antenna and the smart antenna in coverage and quality (BER).
VI. CONCLUSIONS
The work presented here has shown the procedures for performing the integration tests, calibration and measurements to adjust and evaluate the correct operation of a smart antenna. These techniques have been applied to ADAM prototype. Measurement results in an anechoic chamber show the feasibility of a realistic implementation of an adaptive smart antenna for UMTS W-CDMA.
Also, measurement in anechoic chamber with interfering sources, in both uplink and downlink, have been presented. As well, the performance of the smart antenna in a multipath propagation scenario has been evaluated. These results will provide information about the actual performance of the
system, in terms of radiation pattern and improvement of 'G
and'C/I respect a conventional sector antenna.
Further work will focus on the connection with a node B (using Spanish Vodafone network) and the measurements of other parameters (like improvement of coverage and quality) inside the cellular network.
ACKNOWLEDGMENT
The authors wish to thank the companies SICE and S.R.F. Moyano (from Dragados Industrial corporation), VODAFONE-AIRTEL (Spain) and MCYT (Spanish government), through the project TIC2002-01569 for the support in the development of ADAM project.
REFERENCES
[1] M. Pérez, M. Calvo, L. de Haro, J.L. Fernández, M. Sierra-Castañer, B. Galocha, R. Martínez, L.E. García, “Modular Smart Antenna Multi-Standard for Multi-Operator Cellular Communications Scenarios”, Patent no. P200102780, Spain and European Union, 2001. [2] L.C. Godara, “Applications of Antenna Arrays to Mobile
Communications, Part I: Performance, Improvement, Feasibility and System Considerations”, Proc. of the IEEE, vol. 85, no. 7, pp. 1031-1060, July 1997.
[3] M. Calvo, V. Burillo, L. de Haro, J. M Hernando y Fundación Airtel Vodafone. “Sistemas de Comunicaciones Móviles de 3ª Generación (UMTS)”. Fundación Airtel Vodafone. 2002.
[4] Harri Holma , Antii Toskala. “WCDMA for UMTS”. John Wiley and Sons Ltd. 2001.
[5] Physical layer–General Description (FDD). 3GPP TS 25.201 v5.2.0 (2002-09).
[6] Base station conformance testing (FDD) 3GPP TS 25.141 v5.4.0 (2002-09).