1 2 3 4 5 6 7 8 9 10 11 12 13 14 15 16 Código Fecha dPontif
Design a
architect
Diseño y
en la arq
AbstractBuildings Indoo
Humidity param
relative humidi difficult to con
dehumidifying
dehumidifying p Laboratory tests air moister regu coatings. There
two consecutiv
characterization out; in a second Finally, both typ as an air moistu
Keywords: Calc Humidity; Passiv
Dehumidificat the first air c
more related
need an energ
basic to ensu
architecture i
building const
the European
2020 (Direct
temperature
mechanisms.
strategies” ar
passive archit
comfort are th
construction.
o del artículo: 24 del primer envío
and evalu
ture integ
y evaluac
quitectura
or Air Quality meter. In passi ty is even more ntrol. Therefore, systems. The p panel composed o
s are carried out ulator integrated are two types o e empirical pha n of the Calcium d phase, the dehu pes of empirical t
re passive contro
cium Chloride; Pl ve Architecture.
tion processes h
conditioners. M
with engineeri
gy source. Indo ure comfort in
is becoming m
truction; for ins
Commission of
tive 2010/31/
and air moist
That is why
re a priority t
ecture and low
he main aims fo In the last ye
40
o: MAYO 2014
uation of
gration.
ción de u
a pasiva.
requires a cont ve architecture e important for
nowadays, the
resent article s of a plaster and C t to establish its v d in common pla of tests that have ses: in the first m Chloride as a d umidifying panel tests show the ef ol system.
aster Panel; Mo
1.
have been used
Mainly, there a ng than archite oor air hygrothe
buildings. Fur
more relevant
stance, the tar f Nearly Zero En
/EU). In pass
ture is regula
these “no‐en
to reach comf
w consume me
or the future an
ears, more res
a dehum
n panel d
trol in the Rela in humid clim
human comfort
re is a research
hows an innova
Calcium Chloride viability as an ind ster building inte e been carried ou phase, the test desiccant are car as a whole is tes fficiency and viab
ister Buffer; Rela
Introducti
d in buildings s are active systeecture field, w
ermal regulatio
rthermore, pas
in the worldw
rget established
nergy Buildings
sive architect
ted by no ac
nergy‐consump
fort. Research
chanisms to re nd present build
search groups
idifying p
deshumec
Sofía Melero
Departamento Politécnica deAvda. Juan de
Soledad
Garc
Departamento Politécnica deF.
Javier
Neil
Departamento Politécnica de
Fecha de Recepc Fecha de Acepta
ative
mates
and h on ative salt. door erior ut in ts of rried sted. bility
Res
El c Hum hum difí de eva yes esta recu dos se Clo com ens reg
ative Pala
higr
ion
ince
ems
hich
on is
ssive
wide
d by
s for ure,
ctive
tion on
each ding and org 47 inst 48 pas 49 Effi 50 rec 51 (Ha 52 Res 73 mo 74 has 75 yea 76 est 77 bui 78 ana 79 (Ce 80
In a 81
and 82
plaster pa
ctador de
o
‐
Tur
(AP) (AOC o de Construcció
Madrid, Españ
Herrera, 4. 280
cía
‐
Morales
o de Construc
Madrid, Españ
a
‐
González
o de Construc
Madrid, Españ
ción: por favor N
ación: por favor N
sumen
confort interior medad Relativa. medad relativa e cil de controlar; deshumidificació aluación de un in o y de sal de C ablecer su viabil ubrimientos inte s tipos, realizados
realizan los ensa ruro Cálcico com
mportamiento d
sayos demuestra
ulador de humed
abras Clave: C
rométrico; Hume
ganizations wor
tance, the PH
ssive evaporativ
iciency and Gr
cently appeared
att, 2012).
search on pas
ore studied (Giv s been always
ars, with the N tablished a Moi
ilding materials
alyze the moi
erolini, 2009), (O addition, it has
d numerical ap
anel for p
e yeso pa
)
ón y Tecnología a / sofia.mtur@ 040, Madrid (Es
ción y Tecnol
a / soledad.gar
ción y Tecnol
a / fjavier.neila
O llenar este cam NO llenar este ca
en los edificios En la arquitectur s aún más impo por lo que, actu ón. El presente nnovador panel Cloruro Cálcico. idad como regu riores comunes c s en dos fases co ayos de caracter o desecante; y, e el panel en su an la eficacia y dad.
Cloruro Cálcico
edad Relativa; Arq
rking on this fra
HDC project (S
ve cooling syste reen Building C d; as LEED, BR
ssive regulation
voni, 1994), bu more difficult
Nordtest projec
isture Buffer Va s. This standar
sture perform
Olivier, 2009), ( s been used to
pproaches (Jans
passive
ara su inte
a Arquitectónic
@upm.es / +34
spaña).
logía Arquitect
logía Arquitect
mpo.
mpo.
s requiere de u ra pasiva en clima
rtante para el co ualmente, se inv
artículo presen deshumidificado
Se llevan a cab lador de humed como el yeso. Los onsecutivas: en u
rización del com en una segunda f u conjunto. Fina y viabilidad del
; Panel de y quitectura Pasiva
ame have been
Sánchez, 2012
ems. In the sam
Certifications p
REAM or Passiv
n of temperat
t passive moist to attempt. In
ct (Rode, 2005
alue, MBV, for
rdized test has
mance of diffe
(Collet, 2012), (
determine new
ssen, 2009), (Y
egración
cas, Universidad
913364246 /
tónicas, Unive
tónicas, Unive
n control de la as húmedos esta onfort humano y vestigan sistemas nta el diseño y or compuesto de bo ensayos para ad integrado en s ensayos son de una primera fase,
portamiento del
fase, se ensaya el
almente, ambos
conjunto como
yeso; Regulador
a.
n appeared; for
), focused on
me way, Energy
programs have
vHaus standard
ture has been
ture regulation
n the past few 5), it has been
more common
been used to
rent materials
(Dubois, 2014).
w test methods
Yoshino, 2009),
(Fazio, 2012), (Zhang, 2012). However, when air moisture 33
content is considerably high, moisture buffering capacity of 34
building materials is insufficient for an appropriate moisture 35
control and, consequently, there is indoor discomfort. In
36
humid climates this is very common, temperature data are
37
near comfort but humidity figures are always out of comfort 38
ranges. ASHRAE Standard, international reference,
39
establishes comfort humidity ratio (w) limit at 12 g WATER/kg 40
DRY AIR (ASHRAE Standard 55‐2010). In Europe the Relative 41
Humidity (RH) comfort range is from 20% to 70% for existing 42
buildings and 25% to 60% for new buildings (UNE‐EN
43
15251:2007).
44
The research in passive dehumidification drives us to test the 45
viability of integration of passive desiccants in building
46
construction materials. The challenge is to find the right 47
combination of materials commonly used in architecture or in 48
a domestic environment; not only because it is easier to 49
acquire them but also it would be easier to integrate them in 50
present building construction. On one hand, the plaster is one 51
of the most used indoor finish building construction
52
materials. It has a good moisture buffer capacity; its MBV is 53
0.61 g/m2%RH (Rode, 2005). There are materials with better 54
MBV but in building construction there are not as common as 55
plaster. On the other hand, the Calcium Chloride is a very 56
common domestic desiccant used for wet rooms. There are
57
several solid passive desiccants commonly used according to 58
its purpose or destination, Calcium Chloride (CaCl2) is one of 59
the most efficient air moisture controllers. To trap air
60
humidity, the salt (CaCl2) changes its phase from solid to 61
liquid, an exothermic phase change. In its liquid phase the 62
dehumidifying capacity is even higher than in solid phase, but 63
in this case it has been chosen the solid state, considered 64
easier to handle with the use of plaster panels. The
65
performance of the Calcium Chloride through a plaster panel 66
has not been tested before. 67
The main aim of this research is to validate the viability and 68
efficiency of the dehumidifying plaster panel. To reach this 69
aim, the first stage consists on the characterization test for 70
the Calcium Chloride dessicant as an air moisture trap; the 71
second stage is the construction and monitoring of two
72
prototypes of the dehumidifying plaster panel. 73
2.
Desiccant
Properties
74
Excess of indoor air moisture can promote the growth of 75
allergenic or pathologic organisms that can cause different 76
sort of human diseases (Berenguer, 1998). In dehumidifying
77
processes water vapour is taken from the air by mainly four 78
ways. The first one is through indoor ventilation with outside 79
air, with lower humidity ratio (w); in the Spanish Building 80
Construction Rules and Regulations (CTE‐HS3, 2009) it is
81
defined the ventilation flow rate according to different
82
aspects of each location. The second one is condensing
83
humidity ratio by cooling, commonly by means of cooled
84
surfaces. The third one is condensing humidity by increasing 85
air pressure, is the mechanism used by vapour pressure
86
machines. The fourth one is using desiccants; they trap air 87
moisture by vapour pressure differences. Some of these ones 88
can be reused after a regeneration process. The present
89
research is focused in the fourth way of dehumidification. 90
Desiccants are materials with great water vapour affinity and 91
hygroscopic, comparatively with their weight and volume.
92
Desiccants can be classified in liquid or solid and according to 93
its adsorbent or absorbent properties. On one hand, the
94
adsorbent desiccants are materials that attract and trap 95
humidity without suffering chemical changes. They attract
96
water molecules and retain them in their surface. Generally 97
are solids as silica gel, zeolites, synthetic zeolites, alumina, 98
activated carbon and synthetic polymers. On the other hand, 99
the absorbent desiccants are materials that attract and retain 100
air moisture suffering a chemical change. The water
101
molecules become part of the composition of the material. 102
There are generally liquids; for instance, liquid solutions of 103
lithium bromide, lithium chloride, Calcium Chloride, mixtures 104
of these solutions and glycols. 105
Table 1 shows a classification of the most common used
106
desiccants (Garg, 2000). In this table there are two types of 107
liquid desiccants: hygroscopic salt solutions (inorganic) and 108
glycols (organic). The dehumidifying efficiency is higher in an 109
absorption process than in an adsorption one, due to the 110
chemical change of state occurred in the first one. In
111
addition, vapor pressures of liquid desiccants are lower than 112
water at the same temperature; therefore, when they get in 113
contact they can slurp the air water vapor more easily than 114
the solids. The absorption process is exothermic, generates 115
heat due to the chemical reaction in the change of state. This 116
includes water latent heat absorbed by the desiccant and an 117
additional absorbent heat that varies from 5 to 25% of the 118
latent heat (ASHRAE, 1995). 119
Table 1. Desiccants more commonly used (author compilation, 2014). 120
Common desiccants
Solid Desiccants
Silica gel Molecular sieve
Zeolites Alumina gel Activated alumina
Activated carbon
Solid Absorbents
Calcium Chloride
Lithium Chloride
Phosphorus pentoxide
Inorganic Liquid Absorbents
Calcium Chloride Lithium Chloride
Calcium Chloride
Potassium hydroxide
Sulfuric acid
Organic Liquid Absorbent
Ethylene glycol Diethylene glycol Triethylene glycol
Glycerol
121
However, from the desiccants listed on table 1, the more 122
available and common in the market are silica gel, zeolites, 123
sepiolites and Calcium Chloride. Calcium Chloride can be
124
found as liquid or solid in table 1. The solid one is commonly 125
commercialized as a passive domestic dehumidifier. Liquid
126
Calcium Chloride is commonly used with hybrid
127
dehumidifying systems, withvapor compression systems. Its
128
applications in engineering field are varied, from wheels to 129
2.1.
Properties
of
the
Calcium
Chloride
131
Calcium Chloride is a hygroscopic salt formed by two chlorine 132
atoms and one of calcium. Thus the formula is CaCl2 in its 133
anhydrous form. Is a white substance, deliquescent and may 134
be in solid or liquid form. The water vapor absorption
135
capacity of the Calcium Chloride depends on Temperature
136
(T), Relative Humidity (RH) and on the amount of water the 137
Calcium Chloride contains; that is to say, the type of hydrate. 138
In figure 1, in the section 4, it is represented the phase of 139
Calcium Chloride according to the following hydrates
140
CaCl2∙6H2O, CaCl2∙4H2O, CaCl2∙2H2O, CaCl2∙H2O, the properties 141
of each one varies, these properties are detailed explained in 142
the Calcium Chloride Handbook (Calcium Chloride handbook,
143
2003). Furthermore, according to the data obtained from
144
manufactures, the desiccant maintains Relative Humidity
145
range between 40% and 60% and removes excessive air
146
moisture of rooms up to 35 m3 per each 450 g (quantity of a 147
single package). These data have been confirmed with the
148
figures of the empirical results of the present research. 149
In a psychrometric chart the desiccant behavior, according to 150
temperature and humidity ratio variations, follows the
151
Relative Humidity lines; that is to say, it is an iso‐relative 152
humidity behavior. The air moisture performance is defined
153
by the humidity ratio (ωe) and Relative Humidity (RH)
154
following formulas, where Po stands for atmospheric
155
pressure; Pv is vapor pressure; and Pvsat is saturated vapor 156
pressure (Bedoya, 1997). 157
ω 0,622 p p p
RH 100 p
p
Calcium Chloride is, in conclusion, one of the most available 158
desiccants with good results as a domestic dehumidifier,
159
commercialized in most of the countries and no toxic. In 160
addition, because of its low vapor pressure as desiccant, is a 161
good candidate for regeneration techniques; and with good
162
properties of mass and heat transfer and low viscosity.
163
Furthermore, the Calcium Chloride solutions do not crystallize 164
within the operating limits, this can be considered as a 165
positive data for the purpose of building integration and 166
possible regeneration of the liquid obtained after the process, 167
the CaCl2 contained in the solution can be regenerated. 168
3.
Plaster
panel
properties
169
In the panel configuration, the gypsum has been elected as 170
the second main material. On one hand, it is a very common 171
building construction material; on the other hand,
172
comparatively to other covering building construction
173
materials, gypsum has a good moisture buffer behavior
174
(Rode, 2005). Gypsum has not only a Moisture Buffer Value 175
(MBV) appropriate for the purpose of the present research 176
but also its hygroscopic inertia adds an important feature to 177
consider in the dehumidifying panel. Hygroscopic inertia of 178
building construction materials is quite well defined, Rode, 179
2005. However, the most important problem of these
180
materials is their hysteric behaviour. Ramos and de Freitas 181
(2010) studied numerically and experimentally the
182
hygroscopic inertia of some covering materials and proposed 183
the use of inertia classes for characterization of materials. 184
They define the hygroscopic inertia as a relationship between 185
the Relative Humidity variations of a room and the covering 186
materials hygroscopicity.
187
What is most relevant for this research is that in the Moisture 188
Buffering Capacity Evaluation results shown in Ramos and de 189
Freitas research, the gypsum plaster has the highest moisture 190
buffering capacity for a daily cycle and the highest moisture 191
flux density coefficient. These two parameters are the most 192
important for the plaster panel function in the dehumidifying 193
process. The plaster panel works as a membrane that allows 194
water vapor pass through it so it can be easily trapped by the 195
desiccant enclosed behind the plaster panel. A material, as 196
gypsum, that has a high moisture buffer capacity and a high 197
moisture flux density is going to easily let the air moisture 198
pass through it and regulates indoor air moisture content. In 199
the prototypes designed for the present research, the
200
gypsum panels have been manufactured in laboratory with
201
two different hygroscopic properties, varying densities and
202
porosities, to evaluate the influence of the described values 203
on the whole dehumidifying process. 204
4.
Desiccant
Characterization
205
The characterization of the behavior of the desiccant in a 206
controlled air moisture environment is relevant to determine, 207
in a second stage, the dehumidifying efficiency through the 208
plaster panel of the prototype. Two complementary
209
laboratory tests have been performed. The first one consists 210
in finding the equilibrium moisture of the desiccant and the 211
second one aims to determine the rate of hydration. 212
4.1.
Equilibrium
moisture
content
of
the
CaCl
2213
This test consists on hydrating the desiccant till it reaches a 214
humidity ratio where the environment Relative Humidity
215
remains constant. Equilibrium moisture content is defined as 216
the amount of moisture of a substance that remains in
217
equilibrium with the environment at a given partial vapor 218
pressure. The scientific reference of the equilibrium moisture 219
content for Calcium Chloride in its liquid stage is nearby 32% 220
at 20ºC (Hamdan, 2007). The test procedure consists on
221
monitoring temperature and relative humidity inside a closed 222
container during 21 days (container inner volume: 0.015 m3). 223
Inside the container there are two trays with identical
224
quantity of CaCl2 salt and water (total exposed surface: 0.075 225
m2). The water dissolves the salt while temperature inside the 226
container rises up, consequence of the exothermic reaction
227
of the change of phase from solid to liquid. 228
After 21 days, stage A of the experiment, in both trays the 229
salt has crystallized in a homogeneous layer in the lower part 230
of the trays and in top of it there is a Calcium Chloride and 231
water solution. According to figure 1 where is represented 232
the crystallization limit of different dissolutions of CaCl2 by a 233
dark line, these results were predictable (Calcium Chloride 234
handbook, 2003). Laboratory temperature was 20ºC and
235
stage B of the experiment, the crystallized Calcium Chloride is 237
mixed with more water, lowering the dissolution
238
concentration to 61.3% by weight. 239
Figure 1. Phase Diagram for CaCl2 and water solutions (author)
240
241
Results
and
interpretation:
242
Hydratation % Wf W
W 100
To calculate the hydration percentages the formula used is 243
the previous one (García, 1996). In which Wfinal stands for the 244
final weight, Winitial stands for the weight in the beginning 245
(when it is dry). In the collected data, not only the total 246
weight in the trays has been registered but also the weight of 247
crystallized Calcium Chloride and the quantity still in
248
dissolution. Results obtained can be found in the following 249
table 2. In addition, from these results it can be interpreted 250
that when there is a high quantity of CaCl2 in the dissolution it 251
crystallizes and hydrates, stage A. In the second stage, stage 252
B; the Calcium Chloride suffers a dehydration lowering the 253
weight percentage. However the most interesting data for
254
the main aim of the research are Temperature and Relative 255
Humidity measures of the monitoring tests. There were
256
obtained during the Stage A of the experiment, 21 days. Table 257
3 resumes the collected data where the desiccant behavior 258
can be analyzed. 259
Table 2. Hydration results (author, 2014). 260
RESULTS (STAGE A) HYDRATION Thickness (solid)
TRAY 1 22.07 % 6.9 mm
TRAY 2 21.62 % 10.05 mm
AVERAGE 21.85 % 8.48 mm
RESULTS (STAGE B) HYDRATION Thickness (solid)
TRAY 1 ‐47.49 % 5.11 mm
TRAY 2 ‐55.45 % 7.07 mm
AVERAGE ‐51.47 % 6.09 mm
261
Table 3. Hydration monitoring data (Font: personal compilation). 262
Data Logger (averages) Container Laboratory
Relative Humidity 36.00% 43.60%
Temperature 17.40 ºC 16.70 ºC
Specific humidity (*) 4.48 g/kg 5.18 g/kg
Vapour pressure (*) 0.72 kPa 0.83 kPa
(*) calculated by given data
263
During the tests the desiccant has maintained Relative
264
Humidity between 37.9% and 33.3%, see graph of figure 2. 265
There is a symmetric behavior between Temperature and
266
Relative Humidity, but it is difficult to analyze the air moisture 267
variation during the test. In figure 3, the graph of
268
temperature and humidity ratio (We) shows better this
269
variation. The desiccant behavior can be adjusted to a
270
mathematical linear regression model with the following
271
formula: We = 0.805639 + 0.199253*Tinside (g/kg). The
272
desiccant is dehumidifying the environment maintaining a
273
vapor pressure always below than the indoor air one, this 274
certifies the effectiveness of the dehumidifying process.
275
Analyzing these data in a psychrometric chart, the Relative 276
Humidity range is between 30% and 40%. 277
Figure 2. Graph of behaviour of salt Calcium Chloride during Equilibrium moisture test (author, 2014). 278
280 281
282
283
284 285 286 287 288 289 290 291 292 293 294 295 296 297 298 299
300
301
302 326
327
Figure 3. Behav relating Temper
4.2.
Hydrati
This test cons salt Calcium C
(García, 1997)
have been m
volume: 0.015
Inside the co
exposed surfa
quantity of Ca
has been ove
experiment. A
(exposed surf
located in the salt solution w
Humidity bet
temperature
12571:2000).
Figure 4. Schem
Figure 6. Graph
iour of the desicc rature and Specif
ion
rate
of
the
ists on determChloride under
). Temperature
monitored ins
5 m3) during 3 s
ontainer there
ace: 0.075 m2)
alcium chloride
n‐dried to con A third tray wit face: 0.059 m2) e lower part of
will contribute
tween 75.3%
between 25
me of the test “Hy
of dehumidifying
cant during the H fic Humidity varia
e
CaCl
2ining the rate o a humid contr
and Relative H ide a closed
stages of 21 day
are two ide
on top of a g e salt, see figur
nstant weight b
th the humidify ), Sodium Chlo f the containe e to the enviro
and 75.6%
5ºC and 20º
ydration Rate” (au
g behaviour of sa
Hydration test, ations (author, 20
of hydration of
rolled environm
Humidity variat
container (in
ys, 64 days in to ntical trays (t grid with ident re 4. The CaCl2 before starting
ying saline solu
oride and wate
r. The humidify
onment a Rela
for a range
ºC (UNE‐EN
uthor, 2014).
alt Calcium Chlori 014).
f the
ment
ions
nner
otal.
total
tical
salt
the
tion
r, is
ying
ative
of
ISO
Re
308The 349
calc 350
foll 351
for 352
sam 353
giv 354
diss 355
figu 356
cro 357
Figu
318
319
Tab 370
firs 371
con 372
Ann 373
the 374
con 375
the 376
16. 377
con 378
75. 379
reg 380
de during the Hy
sults
and
inte
e collected d
culation was
lowing results s mula used for t me as in the pr
es the hydrati
solution of the ure 5 can be se oss at 42 days.
ure 5. Hydration
ble 4 shows the st stage (21 d ntribution of th nex A in UNE‐E
e contribution
nsequently, the
e salt Calcium C
9ºC (average)
ntribution of R 67% inside the
gulates 25.17%
ydration Rate test
erpretation
ata of weigh
done at 21, 4 shown in the gr
the percentage
revious section
ion rate of th
e Calcium Chlo
enhow the hy
rate (author, 201
e averages of th
days). With th
he humidifying
EN ISO 12571:2
of the hum
e air moisture r Chloride. That is
) and Relative
elative Humidi
e container and of this Relative
t (author, 2014).
hts for the h
42 and 64 da
raph and data o es of the hydrat n 4.1. Data coll he salt but als oride salt. From
dration and de
14).
he monitored d
ese data, and
salt solution ac 000, it is possib
midifying salt s
regulation is be s to say, for a T
e Humidity o
ty by the NaC
d, consequently
e Humidity.
hydration rate
ays giving the
of figure 5. The tion data is the ected not only so the rate of m the graph in
hydration lines
data during the
d knowing the
ccording to the ble to calculate
solution. And,
eing carried by
Temperature of
of 50.5%, the
l solution is of y the salt CaCl2 e
e
e
e
y
f
n
s
e
e
e
e
,
y
f
e
f
Table 4. Hydration rate monitoring data (author, 2014). 328
Data Logger (averages) Container Laboratory
Relative Humidity 50.50% 43.40%
Temperature 16.90 ºC 16.60 ºC
Specific humidity (*) 6.08 g/kg 5.12 g/kg
Vapour pressure (*) 0.97 kPa 0.82 kPa
(*) calculated by given data
329
Comparing the graphs of figures 2 and 6, the dehumidifying 330
capacity of the salt of Calcium Chloride is less than in 331
dissolution (liquid phase). This can also be seen in the graph 332
of figure 7, which represents the data in a graph of
333
Temperature and humidity ratio (We). As in the same case as 334
in the previous section, the desiccant behavior can be
335
adjusted to a mathematical linear regression model with the 336
following formula: We = 0.53457 + 0.315234*Tinside (g/kg).
337
According to figure 6, Relative Humidity range is between 338
46% and 54.5%, these values are inside comfort ranges as 339
explained in the introduction of the present article. This RH 340
range is more easily understood in a psychrometric chart, see 341
figure 7, relating humidity ratio and temperature. 342
343
Figure 7. Behaviour of the desiccant during the Hydration rate test,
344
relating temperature and specific humidity variations (author, 2014). 345
346
5.
Desiccant
plaster
panel
performance
347
After the characterization of the desiccant behavior in a 348
controlled air moisture environment, a new test analyzes the 349
dehumidifying efficiency of a plaster panel and Calcium
350
Chloride combined together. For this purpose it is analyzed 351
the CaCl2 moisture performance enclosed behind a plaster
352
panel. In these experiments, the desiccant capacity of the 353
Calcium Chloride salt through the plaster panel is tested, but 354
also the influence of the plaster panel properties in the whole 355
of the dehumidifying process. That is why two plaster panels 356
with different properties have been specifically manufactured 357
in laboratory for this new test. 358
The test consists on monitoring two box‐prototypes with a 359
controlled air moisture environment inside. Each box has one 360
side with a different porosity plaster panel (exposed surface: 361
0.23 m2) and same amount of Calcium Chloride salt enclosed 362
behind the panel, separated of the plaster panel by a
363
polyethylene mesh (figure 8). Both boxes are identical in size, 364
inner volume of each one is 0.125m3, and identical materials, 365
except for the plaster panel properties (characteristics of 366
both plaster panels are registered in table 5). In both of them 367
the same humidifying saline dissolution (Sodium Chloride and 368
water) has been used. From the collected data, water vapor 369
content in the panel can be calculated according to the 370
quantity of water the panel can retain, knowing gypsum
371
hygroscopicity is 1% (García, 1997). This calculated data is 372
also registered in the following table 5. 373
Table 5. Plaster panels characteristics (author, 2014). 374
Plaster panel prototype 1 Plaster panel prototype 2
ratio water/plaster 0,54 ratio water/plaster 0,89
density 1,39 g/cm3 density 0,79 g/cm3
hygroscopicity 1% (*) hygroscopicity 1% (*)
Water vapor 57,76 g Water vapor 34,58 g
375
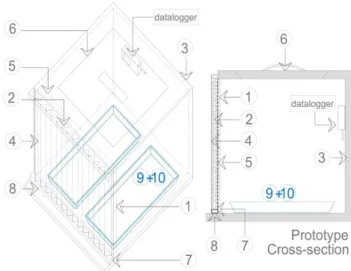
Figure 8 represents a sketch of the testing prototypes, the 376
different numbers stands for: 1. plaster panel; 2. desiccant; 3. 377
extruded polystyrene (walls); 4. plastic film; 5. polyethylene 378
mesh; 6. top (for register); 7. metallic grid; 8. collection 379
channel. Inside, in the bottom part there are two trays with 380
the saline solution (humidifiers) and in one of the walls is the 381
datalogger that registers Temperature (T, ºC) and Relative
382
Humidity (R.H., %). 383
Figure 8. Sketch of the prototype (author, 2014).
384
385
Results
and
interpretation
386
The whole of the test lasted 105 days, collecting data every 387
21 days and controlling the amount of saline dissolution to 388
guarantee the air moisture inside the prototype between 75% 389
and 76% according to standards (UNE EN ISO 12571:2000).
390
The test results of the dehydration of the saline solution 391
(moisture provided to the environment); and the data of
392
water vapor quantities in the plaster panel, evaporated by 393
the humidifier and trapped by the desiccant are registered in 394
table 6. These results show that the prototype with the 395
plaster panel of lower density (P1) is more permeable to 396
water vapor than the one of higher one (P2). 397
Table 6. Plaster panels characteristics (author, 2014). 398
Dehydration
(saline sol.)
H2O vapour (evaporated)
H2O vapor (panel)
H2O vapour absorbed (CaCl2)
P.1 13,26% 388,66 g 57,76 g 330,90 g
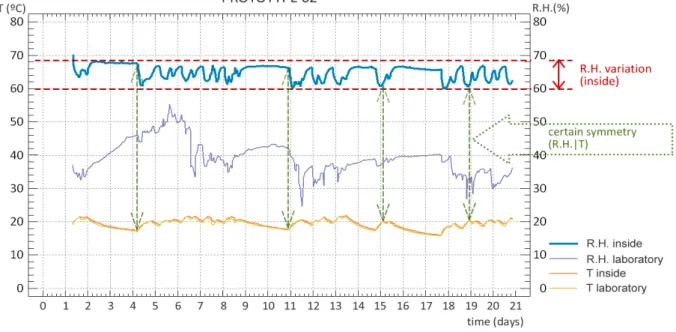
Figure 9. Graph of dehumidifying performance of salt Calcium Chloride through plaster panel –Prototype 2‐ (author, 2014). 399
400
As it has been shown in table 6, the dehydration capacity of 401
the Calcium Chloride salt through a plaster panel is effective. 402
There is a direct relationship between the amount of water 403
vapor absorbed by the desiccant and the density of the
404
plaster panel; and, consequently its porosity. The density of 405
plaster panel in prototype 2 is about half of prototype 1 and 406
the amount of water vapor absorbed is about double.
407
Comparing these data with the data obtained of Temperature 408
and Relative Humidity from the dataloggers inside the
409
prototypes, the Relative Humidity is regulated by the
410
desiccant by lowering it about a 10% in prototype 1 and 411
about a 15% in prototype 2. Again, there is a direct
412
relationship between the RH regulation capacity of the
413
desiccant and the porosity of the plaster panel; in prototype 2 414
is 50% higher than in 1. 415
Figure 10. Dehumidifying performance of CaCl2 through a plaster
416
panel (author, 2014).
417
418
The dehumidifying behavior of prototype 2 is shown in figure 419
10. The symmetric behavior between Temperature and
420
Relative Humidity although is not as clear as in previous tests 421
of characterization, there is certain symmetry. In figure 10 422
the data is represented in a graph of Temperature and
423
humidity ratio (We), the performance can be adjusted to a 424
linear regression formula as in previous tests. The equation is: 425
We = 0.213689 + 0.544227*Tinternal. This behavior is according 426
to a range of constant Relative Humidity lines. Furthermore, 427
with the test of this two prototypes, it has been proved that 428
the low vapor pressure the desiccant provides is enough to 429
trap air moisture through the plaster panel. In other words, 430
the Calcium Chloride salt can suck the inside air moisture 431
through the plaster panel. 432
6.
Final
conclusions
433
The main aim of the research was to test the efficiency of a 434
dehumidifying plaster panel prototype, according to the air 435
moisture control capacity of the Calcium Chloride salt. The 436
research has two phases. In the first phase, the challenge was 437
to demonstrate the CaCl2 salt capability of controlling indoor 438
air moisture through a porous building construction material, 439
a plaster panel, and how this porosity affects its moisture 440
control efficiency. After proving the viability of the prototypes 441
tested in this first phase, the second phase will consist in 442
evaluating the performance of the deshumidifying plaster
443
panel under humidification and dehumidification daily cycles. 444
For this purpose it is being designed a specific test, similar to 445
the standarized MBV test for building construction materials 446
(Rode, 2007). 447
Results presented in this article demonstrate the viability of 448
the proposal. Moreover, there are some detailed conclusions 449
of the laboratory experiments that complement the main
450
objective of the research. Firstly, the Calcium Chloride has a 451
better air moisture regulation as liquid solution than as solid 452
salt; but, on the contrary, it presents more difficulties to be 453
integrated in architecture as a liquid than as a salt. Secondly, 454
the salt Calcium Chloride changes phase from solid to liquid in 455
a quite low speed, in the case of study of this research it is 456
the order of 24g per day in the prototype 2 tested; this fact 457
gives the possibility of collecting this solution in an easy way 458
to try to re‐use it after. Thirdly, there is a direct relationship 459
between the plaster panel density and air moisture flow
460
through the pores of the panel; what is more, there is a direct 461
relationship between the plaster density and the air moisture 462
regulation. Finally, the present research represents the first 463
step for a passive desiccant plaster panel integrated in
464
conventional building construction coverings.
Acknowledgments
466
To Professors David Sanz‐Arauz and Alfonso García‐Santos for 467
their support on this research. And to the Research Group 468
ABIO‐UPM, Technical University of Madrid, that has
469
economically supported the laboratory tests. 470
References
471
472
ANSI/ASHRAE Standard 55‐2010. Thermal Environmental Conditions
473
for Human Occupancy. (2010). Atlanta: American Society of
474
Heating, Refrigerating and Air‐Conditioning Engineers, Inc.
475
ASHRAE. (1995). Desiccant and absorption cooling. ASHRAE Technical
476
data bulletin 11, No.2. Atlanta: American Society of Heating,
477
Refrigerating and Air‐Conditioning Engineers, Inc.
478
Bedoya, C, Neila, F.J. (1997). Técnicas arquitectónicas y constructivas
479
de acondicionamiento ambiental. Madrid: Munilla‐Lería.
480
Berenguer, M.J. (1998). Chapter 44, Calidad del aire interior. In
481
Stellman, J.M. (Eds.), Enciclopedia de Salud y Seguridad en el
482
Trabajo, 3rd spanish edition (pp. 28‐44). Madrid: Ministerio de
483
trabajo y asuntos sociales. Subdirección General de
484
Publicaciones.
485
Calcium Chloride handbook. A guide to properties, forms, storage and
486
handling (n.d.). (2003). Michigan: The Dow Chemical Company.
487
Cerolini, S., D’Orazio, M., Di Perna, C., Stazi, A. (2009). Moisture
488
buffering capacity of highly absorbing materials. Energy and
489
Buildings 41, 164‐168.
490
Collet, F., Pretot, S. (2012). Experimental investigation of moisture
491
buffering capacity of sprayed hemp concrete. Construction and
492
Building Materials 36, 58‐65.
493
CTE DB‐HS3 (2009). Código Técnico de la Edificación. Documento
494
Básico HS3: Calidad del aire interior. Ministerio de Fomento del
495
gobierno de España: Madrid, España.
496
Directive 2010/31/EU(2010). Directive on the Energy performance of
497
buildings (recast). European Parliament and the Council of the
498
European Union: The Member States.
499
Dubois, S., McGregor, F., Evrard, A., Heath, A., Lebeau, F. (2014). An
500
inverse modelling approach to estimate the hygric parameters
501
of clay‐based masonry during a Moisture Buffer Value test.
502
Building and Environment 81, 192‐203.
503
Fazio, P. Li, Y., Rao, J. (2012). An investigation of moisture buffering
504
performance of wood paneling at room level and its buffering
505
effect on a test room. Building and Environment 42, 205‐216.
506
García, S. (1996) “Metodología de diagnóstico de humedades de
507
capilaridad ascendente y condensación higroscópica en edificios
508
históricos”, PhD thesis. Escuela Técnica Superior de
509
Arquitectura, Universidad Politécnica de Madrid [Thesis in
510
Spanish]
511
Garg, H.P., Prakash, J. (2000). Solar Energy fundamentals and
512
applications. New Delhi: Tata McGraw‐Hill.
513
Givoni, B. (1994). Passive and low energy cooling of buildings. New
514
York: Van Nostrand Reinhold.
515
Hamdan, H., Hill, C. A. S., Zaidon, A., Anwar, U. M. K., Latif, M. A.
516
(2007). Equilibrium moisture content and volumetric changes of
517
Gigantochloa Scortechinii. Malasia. Journal of Tropical Forest
518
Science 19 (1), 18‐24.
519
Hatt, T., Saelzer, G., Hempel, R., Gerber, A. (2012, July 7). High indoor
520
comfort and very low energy consumption through the
521
implementation of the Passive House standard in Chile. Revista
522
de la Construcción 12 (22), 123‐134.
523
Janssen, H., Roels, S. (2009). Qualitative and quantitative assessment
524
of interior moisture buffering by enclosures. Energy and
525
Buildings 41, 382‐394.
526
McGregor, F., Heath, A., Shea, A., Lawrence, M. (2014). The moisture
527
buffering capacity of unfired clay masonry. Building and
528
Environment (doi: 10.1016/j.buildenv.2014.09.027).
529
Olivier, M., Cordeiro, K. (2009). Moisture performance of building
530
materials: From material characterization to building simulation
531
using the Moisture Buffer Value concept. Building and
532
Environment 44, 388‐401.
533
Ramos, N.M.M., Delgado, J.M.P.Q., de Freitas, V.P. (2010, July 2).
534
Influence of finishing coatings on hygroscopic moisture
535
buffering in building elements. Construction and Building
536
Materials 24 (2010), 2590‐2597.
537
Rode, C., Peuhkuri, R., Time, B., Svennberg, K., & Ojanen, T. (2007).
538
Moisture Buffer Value of Building Materials. Journal of ASTM
539
International, 4(5), Paper ID JAI100369 (33‐44).
540
10.1520/STP45403S
541
Sánchez, J., Salmerón, J.M., Molina, J.L., Sánchez, F.J., Álvarez, S.
542
(2012, July 7). PHDC: hybrid and passive evaporative cooling
543
system for building – predesign software. Revista de la
544
Construcción 12 (22), 73‐91.
545
UNE‐EN 15251 (2007). Parámetros del ambiente interior a considerar
546
para el diseño y la evaluación de la eficiencia energética de
547
edificios incluyendo la calidad del aire interior, condiciones
548
térmicas, iluminación y ruido. Asociación Española de
549
Normalización y Certificación (AENOR): Madrid, España.
550
UNE‐EN ISO 12571 (2000). Prestaciones higrotérmicas de los
551
productos y materiales para edificios. Determinación de las
552
propiedades de sorción higroscópica. Asociación Española de
553
Normalización y Certificación (AENOR): Madrid, España.
554
Yoshino, H., Mitamura, T., Hasegawa, K. (2009). Moisture buffering
555
and effect of ventilation rate and volume rate of hygrothermal
556
materials in a single room under steady state exterior
557
conditions. Building and Environment 44, 1418‐1425.
558
Zhang, H., Yoshino, H., Hasegawa, K. (2012). Assessing the moisture
559
buffering performance of hygroscopic material by using
560
experimental method. Building and Environment 48, 27‐34.