Antennas' Correlation Influence on the GMD-assisted MIMO Channels
Performance
Cesar Benavente-Peces , Andreas Ahrens , Francisco Javier Ortega-Gonzalez and Jose Manuel Pardo-Martin
Keywords: Multipe-Input Multile-Output (MIMO), Geometric Mean Decompositioin, Trasnmission Mode, Bit Alloca-tion, Power Allocation.
Abstract: The use of multiple antennas in MIMO (multiple-input multiple-output) systems at both the transmit and re-ceive sides produces the effect known as antennas correlation which impact the overall channel performance, throughput and bit-error rate (BER). The geometric mean decomposition (GMD) is a signal processing tech-nique which can be used to process transmit and receive signals in MIMO channels. The GMD pre- and post-procesing in conjunction with dirty-paper precoding shows some advantages over the popular singular value decomposition (SVD) technique which provides GMD-assisted MIMO systems a superior performance particularly when the channel is affected by antennas correlation. This paper analyses the impact of antennas correlation on the performance of GMD-assisted wireless MIMO channels highlighting the advantages over SVD-assisted ones.
1 INTRODUCTION
In the last decades researchers and engineers are fac-ing the uphill to obtain higher transmission data rates and wider bandwidths required for the current and future high-speed services demanded by the indus-try and society, as video streaming, video-conference, massive data transference, multi-user services, etc. In this context multiple-input multiple-output (MIMO) systems are playing a key role due to their capability to increase the channel throughput and performance compared with single-input single-output (SISO) sys-tems (Foschini and Gans, 1998), (Ozgur et al., 2013). Due to their potential capabilities MIMO wireless communication systems have attracted a lot of atten-tion from the research community. The use of spatial diversity in MIMO systems can considerably increase data rate and significantly improve the system robust-ness, reliability and coverage (Yang et al., 2011).
The use of multiple transmit and receive antennas causes effects which affect the channel performance. First, due to the multi-antenna configuration and the multi-path transmission inter-antennas interferences disturb the channel behaviour. MIMO systems benefit
from multipath by using additional signal processing in order to improve the channel performance. Sec-ond, due to physical limitations the antennas at each side are really close compared to the wavelength and the correlation effect appears negatively impacting the MIMO channel performance (Janaswamy, 2002).
As stated above, in order to benefit the MIMO channels capabilities additional signal processing is required. The SVD is a popular technique widely used to improve MIMO channels performance (Haykin, 2002). Given perfect channel state infor-mation (PCSI) is available at both the transmit and receive link sides, the SVD is used to perform pre-and post-processing on the transmit pre-and receive sig-nals (respectively) to completely eliminate the ex-isting inter-antennas interferences. As a result the MIMO channel is transformed into several parallel, independent and non-interfering input single-output (SISO) unequally weighted channels.
remaining inter-antennas interferences which must be eliminated by using additional signal processing (e.g., Tomlinson-Harashima pre-coding) to obtain the best channel performance. Along the investigation the Tomlinson-Harashima pre-coding is used in a fre-quency non-selective GMD-assisted MIMO system to perfectly cancel the inter-antenna interferences (Kinjo and Ohno, 2013).
In order to improve the SVD-assisted MIMO sys-tem performance, where the resulting SISO channels have different particular layer gains, bit and power al-location techniques based on the varying channel con-dition can be used (Zhou et al., 2005), which is syn-onymous of adaptive modulation. One of the main advantages of using the GMD is that the resulting in-dependent layers have the same particular SISO chan-nel gain coefficient (the geometric mean of the sin-gular values), assuming that the antenna inter-ferences are perfectly eliminated by dirty-paper pre-coding. Hence, power allocation doesn’t make sense in GMD-assisted MIMO systems (a priori) avoiding the required computational overhead.
Antennas correlation is characterized by the an-tennas’ correlation coefficients which affect the chan-nel matrix and hence its behaviour (Lee, 1973). The higher the antennas’ correlation the lower the chan-nel scatter richness condition (required by MIMO sys-tems to get a better behaviour) and the lower the over-all performance. The correlation effect affects the ge-ometric mean PDF which impacts the channel perfor-mance. The geometric mean PDF and the CCDF can be used to predict and optimize the MIMO channel performance by activating a proper number of layers which define different transmission modes configura-tions.
In (Benavente-Peces et al., 2013) the authors fo-cused the investigation on the analysis of the singular values CCDF to evaluate the receiver-side antennas correlation effect on the channel performance and the outcomes of the appropriate antennas usage in a SVD-assisted MIMO system.
The novelty of this contribution is that a frequency non-selective MIMO link is studied independently of the antennas electrical properties to analyse the im-pact of antennas’ correlation on the performance of GMD-assisted MIMO systems. The effects on the channel matrix are highlighted and the resulting ge-ometric mean PDF and CCDF are studied.
Additionally the benefits of having equal values of layer-specific weighting factors (i.e. gain coefficients) in GMD-based MIMO systems are remarked against the SVD-assisted ones using different number of ac-tive layers, highlighting the effect of correlation com-pared to classical uncorrelated channels. The
geomet-ric mean CCDF curves are used to analyse and pre-dict the behaviour of the MIMO channel. The BER is computed for various active layers and the effect of antennas’ correlation is remarked to find the best transmission mode. A 4×4 MIMO system transmit-ting QAM signals along the active layers is consid-ered as an example.
The remaining part of this paper is structured as follows. Section 1 shows the computation of the geometric mean of the channel matrix singular val-ues. Section 3 describes the channel model for the GMD-assisted MIMO system, including the anten-nas’ correlation model. The analysed transmission modes are introduced in Section 4. Section 5 com-pares the GMD-assisted MIMO system versus the SVD-assisted one. In Section 6 the main results of the investigation are introduced including the geometric mean PDF and CCDF analysis, the antennas’ corre-lation effects and the considered transmission modes. Finally, Section 7 summarizes and highlights the main outcomes.
2 THE GEOMETRIC MEAN
The GMD with remaining interference elimination decomposes the MIMO channel into several indepen-dent SISO channels with equal performance. The main advantage that GMD-assisted MIMO systems present over the SVD-assisted ones is that those inde-pendent layers have the same gain coefficient which is the geometric mean of the singular values of the chan-nel matrix. Hence, the additional computational load required to perform bit and power allocation to im-prove and optimize the MIMO channel performance is reduced. The geometric mean can be computed from the channel matrix singular values as:
C
LX Si
1=1
\ 1/i
(1)
where L is the number of activated layers (with L <
min(«T, WR), UT and HR are the number of transmit and
receive antennas respectively) and \/%i (singular
val-ues) states for the positive square roots of the
eigen-values t,t of H • HH, where H is the channel matrix
and (-)H is thehermitian operator.
3 CHANNEL MODEL
The MIMO channel can be described in general terms as
y = H-c + n (2)
where c is the (nT × 1) transmit data vector, H is the
( nR× nT) channel matrix, n is the ( nR× 1 ) noise vector at the receive antennas and y is the (nR × 1) receive
data vector (with nT the number of transmit antennas and nR the number of receive antennas). By using the G M D the channel matrix can be decomposed as:
H = Q R P (3)
where R is an upper triangular matrix and Q and P are unitary matrices whose rows are orthonormal. As-suming the PCSI condition at both the transmit and receive sides, pre (P) and post (QH) processing can be performed at the transmit and receive sides result-ing in
y ˜ = R c + n ˜ , (4) where R is an upper triangular matrix whose elements
in the main diagonal equal the geometric mean of the singular values and the upper non-zero elements de-scribe the remaining inter-antenna interferences, n˜ is the post-processed noise vector and y˜ is the resulting receive data vector. By using perfect interference can-cellation (e.g. Tomlinson-Harshima pre-coding) the remaining interference can be removed and the chan-nel can be finally described as
y ˜ = R˜ c + n ˜ (5) where R˜ is a diagonal matrix whose non-zero
ele-ments equal the geometric mean of the singular val-ues. In order to improve the channel performance it is possible to select the appropriate number of active layers obtaining an extra gain in the geometric mean computation as only the largest singular values are considered (Jiang et al., 2005).
3.1 Singular Values vs. Geometric Mean
The SVD decomposes the channel matrix as H = S V DH, where V is a diagonal matrix containing the singular values of H in descending order, and S and D are unitary matrices. After pre- and post-processing the transmit and receive data vectors with matrices D and SH respectively, the resulting receive data vector
is given by y˜ = V c+n˜, where n˜ is the post-processed noise vector, described a system composed of several independent layers (SISO channels).
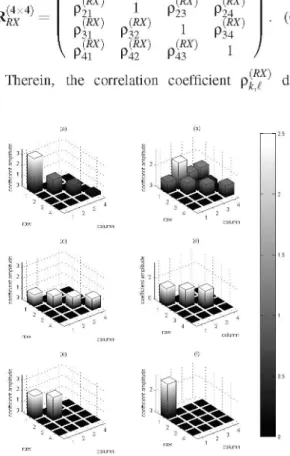
Figure 1 represents and compares the matrices V (containing the singular values), R (containing the ge-ometric mean and remaining inter-antenna interfer-ences) and R˜ (containing the geometric mean) for an exemplary ( 4 × 4) MIMO channel. Independently of the number of active layers the value of the singular values doesn’t change. On the other hand the value of the geometric mean depends on the number of active
layers as shown in Fig. 1(b)-(f). For one active layer ((a) and (f)) the systems behave in the same way as the layer coefficient is the same in both cases. For four active layers the SVD-assisted MIMO system shows a weak layer which drops the overall system perfor-mance and the GMD-assisted one shows a higher per-formance. The cases concerning two and three active layers requires a more detailed analysis as different transmission modes can be considered and the final results depend on the real channel status.
3.2 Antennas’ Correlation
Antennas correlation is characterized by the correla-tion matrix which is composed of the correlacorrela-tion coef-ficients describing the dependencies of the multipath transmission. The correlation between antennas k and is denoted as ρk . Given a set of nN antennas, the correlation matrix is a (nN ×nN) one. As an example, the receiver side correlation matrix for a four receive antennas is given by
R K(4X x4)
1 P12 P1310 P1 4}
p21 ) 1 P23 P24
j,m («*) JW)
P31 P32 1 P34
41
°
p42 p43 1(6)
(RX) Therein, the correlation coefficient ρ(k, )
scribes the receiver side correlation between the trans mit antenna k and . It can be demonstrated that ρ( R, kX) = ρ k ,( R X) and the matrix in (6) can be simplified.
The transmit correlation matrix RTX can be described
in a similar way. In the case of uncorrelated antennas, the off-diagonal elements are zero.
According to (Ahrens et al., 2013) the (nT ×nR)
channel matrix Hc which models a MIMO system
af-fected by antennas’ correlation can be obtained from the channel matrix of an uncorrelated MIMO system and the matrix modelling the antennas’ correlation as:
vec (Hc) = RH H • vec (H) (7)
where H is a (ttT x «R) uncorrelated channel matrix
with independent, identically distributed complex
val-ued Rayleigh elements, vec(-) is the vector operator
which stacks the matrix H into a vector column-wise and RHH is the correlation matrix which includes both the transmit and receive antennas’ correlation. Taking into consideration the common assumption that the correlation between the various antennas composing the transmitter side array is independent from the cor-relation between the different antennas composing the receiver side array, the correlation matrix RHH can be described by the Kronecker product of the transmit-ter side correlation matrix RTX and the receiver side correlation matrix RRX as:
4 TRANSMISSION MODES
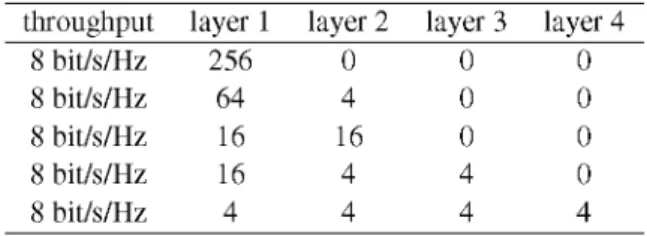
In this investigation a 4 × 4 MIMO system with QAM modulation and a constant data rate with an over-all throughput of 8 bits/s/Hz is considered. Hence, the possible transmission modes defined by the active layers are those shown in Table 1.
Table 1: Investigated QAM transmission modes.
throughput layer 1 layer 2 layer 3 layer 4
8 bit/s/Hz 256 0 0 0
8 bit/s/Hz 64 4 0 0
8 bit/s/Hz 16 16 0 0
8 bit/s/Hz 16 4 4 0
8 bit/s/Hz 4 4 4 4
The different transmission modes are defined by the transmission of distinct QAM constellation sizes along the available (active) layers.
5 GEOMETRIC MEAN VS.
SINGULAR VALUES
In order to improve the SVD-assisted MIMO systems performance bit and power allocation strategies can be used by selecting the appropriate number of active layers, the modulation order and the transmit power per layer in order to obtain the best performance, re-quiring additional computational load and transmis-sion overhead. In GMD-assisted MIMO systems all the active layers have the same gain coefficient (the geometric mean) performing with the same quality, and hence power allocation is not required to improve the overall MIMO channel performance.
A concrete number of active layers can be selected to compute the geometric mean using (1) resulting in different MIMO channel performances. By se-lecting just one layer the geometric mean coincides with the singular value of that layer (the one with the largest value). Activating more layers with dif-ferent singular values results in a geometric mean whose value is lower than the largest singular value. Even so the GMD-assisted MIMO performance is not lower than the SVD-assisted one given there are lay-ers with low valued singular values. In fact GMD-assisted MIMO systems are (in general) more robust than SVD-assisted without requiring power allocation techniques. Nonetheless, the appropriate selection of the number of active layers (which is synonymous of bit allocation) can lead to the best performance, par-ticularly under antennas’ correlation effect.
Fig. 2 represents the geometric mean PDF for un-correlated (solid lines) and un-correlated (dashed lines) 4×4 GMD-assisted MIMO channels for a different number of active layers. The analysis reveals that the geometric mean decreases with the number of ac-tive layers, which is event more evident under an-tennas’ correlation effect. As the considered number
Geometric mean PDF for 1 to 4 layers
ff
ff —s—v uncorrelated, 2 layers uncorrelated, 1 layer
A — H —- e - uncorrelated, 4 layers correlated, 1 layer
•4
- w - correlated, 2 layers
- < - correlated, 3 layers
- a - correlated, 4 layers / l \ l f i ~
? \U W 1 T L 1 i
P ' ][* *
'A %
\
JJ
j A\4i
0
layer gain coefficient
Figure 2: Geometric mean PDF representation for uncorre-lated (solid line) and correuncorre-lated (dashed line) 4x4 MIMO channels activating 1-4 layers.
0.35
0.3
0.25
0.2
0.15
0.1
2 layers MIMO: singular values vs. geometric mean
-0— layer #2 singular value (uncorrelated)
-v— layer #1 singular value (uncorrelated)
-«— 2 layers geometric mean (uncorrelated)
4 J
V\
4 < /
A-V
/V
fvA
\/ r -a^
f \ / *
. \
i
LAn
VgDHB-nS^B1 l.c i d psB1 ^Niaa3«— V HSMB^
layer gain coefficient
Figure 3: Singular values vs. geometric mean PDF for a two active layers MIMO channel.
of active layers increases lower valued singular val ues (weak layers) are used to compute the geomet ric mean through equation (1) obtaining a lower layer gain coefficient (geometric mean). In conclusion, due to antennas’ correlation weak layers results in lower singular values and the geometric mean drops and wider spreads when various layers are activated.
A key different between SVD-assisted and GMD-assisted MIMO systems is that in the first ones re ducing the number of active layers doesn’t change the singular values and the individual layer gain isn’t al tered. In contrast, in the second ones (i.e. GMD) se lecting a lower number of active layers results in a larger geometric mean, which is the layer coefficient gain.
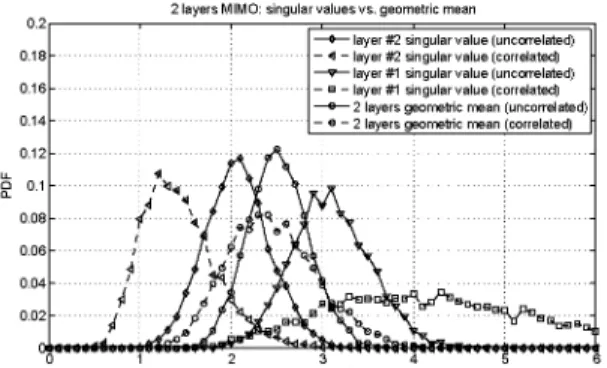
Fig. 3 depicts the PDF of the gain coefficients for a two active layers SVD-assisted MIMO sys
tem (with singular values ξi) and GMD-assisted
√
one (geometric mean μ) for uncorrelated (solid lines) and correlated (dashed lines) cases. In the SVD-assisted MIMO channel the antennas’ correlation ef fect favours the existence of strong (layer # 1) and weak (layer #2) layers as the active layers singu lar values PDF curves become more spaced and smoothed. Hence power and bit allocation is required to optimize the performance. Conversely, in the GMD-assisted MIMO channel the geometric mean wider spreads with correlation but the mean value doesn’t significantly change (it slightly diminishes its value). In consequence it can be concluded that the
GMD-assisted MIMO system behaves more robustly than the SVD-assisted one under the effect of the an tennas’ correlation. SVD-assisted MIMO systems
are more sensitive to antennas’ correlation. In these systems, as the correlation increases the strongest
layer becomes indeed stronger (larger ξi) and the
√
weakest gets a lower singular value. Therein the over all MIMO channel performance drops due to the ex istence of low quality layers. In the GMD-assisted one, as the correlation increases the geometric mean
decreases but in a reduced percentage and the overall performance slightly drops.
6 RESULTS
This section analysis the results of the simulation of the GMD-assisted MIMO channel under different conditions. The goal is determining how the anten nas’ correlation affects the geometric mean of the singular values (layer gain coefficient) for different transmission modes and correlation indexes as well how the channel performance is affected. For conve nience the correlation coefficients have been chosen to be the same for all the pairs of antennas.
6.1 Geometric Mean PDF and CCDF
Analysis
In GMD-assisted MIMO systems (with pre-coding) bit- and power allocation make no sense as all the ac tive layers perform with the same quality (BER) given the layers coefficients gain are the same. Neverthe less the selection of the appropriate number of active layers leads to different overall performances as the geometric mean differs. The larger the number of se lected layers the lower the geometric mean and the lower the transmit QAM constellation size per layer at a given quality.
Fig. 4 shows the CCDF of the two largest singular values and the geometric mean of a 4×4 MIMO chan-nel when the two best layers are selected (two active layers). Under antennas’ correlation effect the sin-gular value CCDF curve of the strongest layer shifts right while the weak layer one shifts left. In conse-quence the overall SVD-assisted MIMO system per-formance diminishes. In the GMD-assisted one the geometric mean CCDF doesn’t significantly vary with antennas’ correlation and the overall channel perfor-mance is approximately the same. Then, the conclu-sion is drawn that the GMD-assisted MIMO system is more robust against the antennas’ correlation effect than the SVD-assisted one.
2 layers MIMO: singular values vs. geometric mean CCDF
H.
r*
— 0 — layer #2 singula value CCDF (uncorrelated)Y
x
—v— layer #1 singula value CCDF (uncorrelated)\ \ «\ —©— 2 layers geometric mean CCDF (uncorrelated)
« \ « \ <? \
\ 1 «\ \
• ^ V 2 ;V s
< H
< \ \ : \ t i H
*
WvV
SS <- V v»„ V
layer gain coefficient
Figure 4: Singular values and geometric mean CCDF for a two active layers MIMO channel: uncorrelated (solid lines) and correlated (dashed lines) cases.
appropriate. This effect is event larger in systems with antennas’ correlation.
Figures 5 to 8 depict the geometric mean PDF for a different number of active layers and distinct correlation indexes. For simplicity, in the investiga tion the same correlation coefficient is considered for each pair of antennas. Figure 5 represents the PDF when just one active layer is active for uncorrelated and correlated conditions, considering different cor
relation degrees (ρ={0.0, 0.2, 0.4, 0.6}). In this case
the geometric mean takes the value of the largest sin gular value (the stronger layer) of the resulting chan nel matrix. Increasing the correlation index augments the probability of having larger values, i.e., antennas’ correlation causes the strongest layer become even stronger because the singular value increases (and in this case the geometric mean).
The analysis of figures 6 to 8 gives different con clusions. Comparing the geometric mean PDF when 2, 3 and 4 layers are active for uncorrelated and corre
lated cases with a correlation index ρ=0.2 (weak cor
relation) it can be observed that the geometric mean PDF doesn’t significantly change. As outcome, it can be concluded that GMD-assisted MIMO systems
Geometric mean PDF for 1 layer and various correlation indexes (ρ )
^ - uncorrelated - correlated, p=0.2
- correlated, p=0.4
- correlated, p=0.6
M
sAk
iftfcjl 1 l t 8 |
gn
layer gain coefficient (geometric mean)
seem to be robust against antennas’ correlation. When two active layers are active the GMD-assisted MIMO seems to robustly behave under the antennas’ corre lation effect. For the correlation indexes considered in our analysis the geometric mean PDF curves ap proximately centre in the same value. As the two weakest values are discarded the impact of the cor relation index on the geometric mean is not quite re markable and the system performance doesn’t notice ably change, except for the highest correlation index.
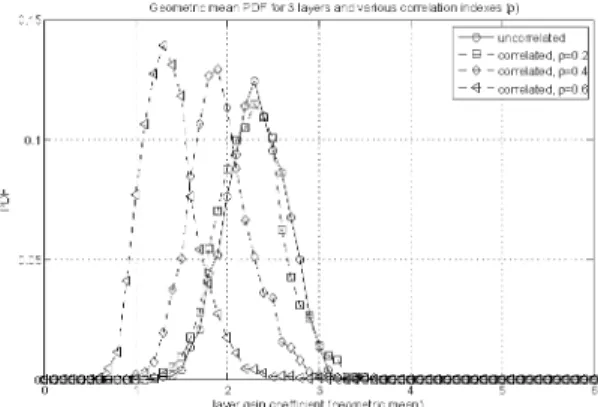
Figures 7 and 8 show the results when activating three and four layers respectively. Now the geometric mean value is more sensitive to correlation. This is due to the activation of the weakest layers (three and four) with low valued singular values which tend to take lower values as the correlation index increases. The first case shows to be more robust for low cor relation indexes while the second one is more sensi tive to correlation because the weakest layer (with the lowest singular value) is much more sensitive to the correlation effect, i.e., the singular value remarkably decreases with the increment of the correlation index.
Geometric mean PDF for 2 layers and various correlation indexes (ρ)
— e — uncorrelated
- B - correlated, p=0.2
- correlated, p=0.4
- correlated, p=0.6
layer gain coefficient (geometric mean)
Figure 6: Geometric mean PDF for 2 active layers MIMO and various correlation indexes (ρ=0, 0.2, 0.4, 0.6).
Geometric mean PDF for 3 layers and various correlation indexes (ρ)
— e — uncorrelated
- B - correlated, p=0.2
- 0 - correlated, p=0.4
- <r - correlated, p=0.6
layer gain coefficient (geometric mean)
Figure 5: Geometric mean PDF for 1 active layer MIMO and various correlation indexes (ρ=0, 0.2, 0.4, 0.6).
Figure 7: Geometric mean PDF for 3 active layers MIMO and various correlation indexes (ρ=0, 0.2, 0.4, 0.6).
0.9 0.8 0.7 0.6 0.5 0.4 0.3 0.2 0.1
0 2
4 6
0.15
0 . 1
0.05
0.15
0 . 1
0.
0.05
0.05
0
Geometric mean PDF for 4 layers and various correlation indexes (ρ)
—9— uncorrelatec — B - correlated, p=01 — ^ - correlated, p=0i . — <r - correlated, p=0.(
l 6 4
ayer gain coefficient (geometric mean;
Figure 8: Geometric mean PDF for 4 active layers MIMO and various correlation indexes (ρ=0, 0.2, 0.4, 0.6).
6.2 The Effect of Correlation on the
System Performance
Figures 9 to 13 show the effect of the antennas’ cor relation on the performance of GMD-assisted MIMO systems for the transmission modes considered in Ta ble 1. As reference, the BER for the equivalent SVD-assisted MIMO transmission mode is depicted. In the case in which just one active layer is active the GMD- and SVD-assisted MIMO systems show the same behaviour. The analysis of figures 8 to 12, where a reduced number of available layers are ac tivated, reveals that the GMD-assisted MIMO system performance increases with correlation (for low val ues). The reduction of the number of active layers dis cards weak layers in the computation of the geomet ric mean. Hence, the geometric mean is higher with a lower number of active layers. Under the anten nas’ correlation effect, weak layers take indeed lower singular values and strong layers become stronger (higher singular values). As a result, the geometric mean takes higher values in correlated systems with a reduced number of active layers. This behaviour re verses when all layers are active. The increase in the correlation coefficient changes the described perfor mance behaviour for an intermediate number of active layers.
6.3 Transmission Modes Comparison
Figures 14 to 16 represent the GMD-assisted MIMO channel performance (BER) for the analysed trans mission modes described in Table 1 for different an tennas’ correlation degrees. Power allocation is not considered in the different transmission modes and the same power is transmitted along the active lay ers. Figure 14 compares the performances obtained by the GMD-assisted MIMO system for the different transmission modes when affected by antennas’
cor-mc
BER f o r G M D-a s s i s t e d M I M O with 1 active layer ( 2 5 6-0-0-0 )
mc
10"1 :: :" § 7 7:| ^ S ^iH-s-m,. *~~®—f
10"1 :: :" § 7 7:| ^ S ^iH-s-m,.
.... .
10_i M ^ i ? >u sS^Ky !~
"
10"c
;..>.„....;
-10"" '
" :
10~£ : 1
- £
; ;
0 2 4 6 8 10 12 14 16 18 20 SNR (dB)
Figure 9: BER for a GMD-assisted MIMO system with 1 active layer (TM 256-0-0-0): uncorrelated (solid line) vs. correlated with p=0.2 (dashed line).
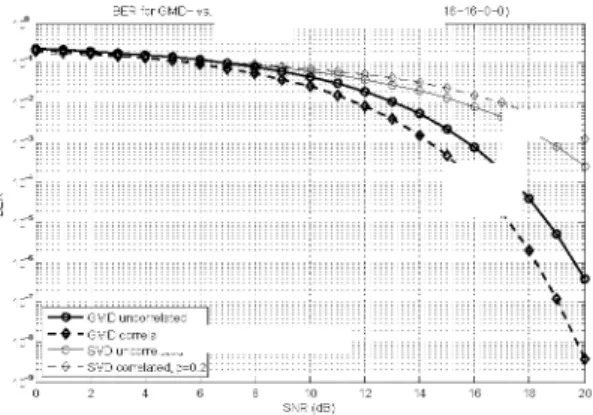
BER for GMD-vs. SVD-assisted MIMO with 2 active layers (16-16-0-0)
' " • " • " • - • - • • • c t - - — V
•=ras3
••^JSs .>3s,
\ i «
\ \ >
*>
—©— GMD uncorrelated | : : : : : : : i \ z J ~ • " GMD correlated, p=D.3
1 — 9 — SVD uncorrelated !•••••••• i l l i l l l l i j
] - 0* - SVD correlated, p=0.2
Figure 10: BER for a GMD- vs. SVD-assisted MIMO system with 2 active layers (TM 16-16-0-0): uncorrelated (solid line) vs. correlated with p=0.2 (dashed line).
BER for GMD-vs SVD-assisted MIMO with 2 active layers (64-4-0-0;
^ f H
^ ~-o- -_ ^ f ^ ^t3 hrft—<
^ f H
^ ~-o- -_ ^ f ^ ^t3 hrft—<
"a v
v<^
" ^
\
\
—8— uncorrelatec - 4 -correlated,p=0.2
—S— SVD uncorrelatec
- 01 - SVD correlated, p=0 * * 1C
SNR (dB)
Figure 11: BER for a GMD- vs. SVD-assisted MIMO sys tem with 2 active layers (TM 64-4-0-0): uncorrelated (solid line) vs. correlated with ρ=0.2 (dashed line).
relation with a factor ρ = 0.2 (weak correlation). The
results reveal that the transmission mode 16-16-0-0 (with two active layers) is the one showing the best performance.
The increase in the correlation coefficient affects the MIMO performance as described above. Figure 15 represents the performance for the various trans-J.'
10 10 10 10 10 10 10 10 10
MR (dB;
C
11
11
C
C
C
10°
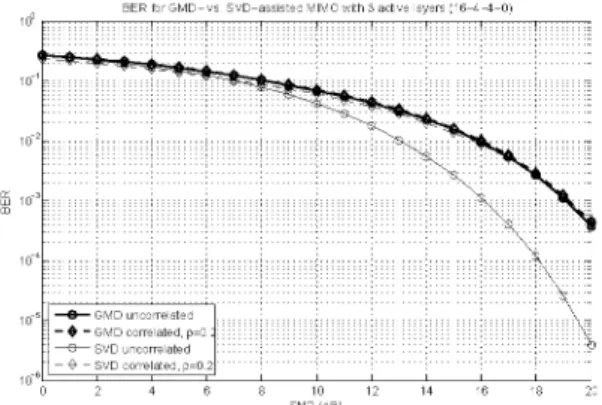
3ER for G M D-v s . S V D-ssisted IV MO with active la ers (16-4 -4-0;
10"'
Nfe*<
^1^*^::.::::
10"2 ^ « ^
N k.
10"3 ^
s
10"4
10"5 J — 8 — GMD uncorrelated
— e — SVD uncorrelated
n-6
3 10 12
3NR (dB;
Figure 12: BER for a GMD- vs. SVD-assisted MIMO sys tem with 3 active layers (TM 16-4-4-0): uncorrelated (solid line) vs. correlated with ρ=0.2 (dashed line).
10°
3ER for G M D-v s . S V D-assisted Iv IMO with 4 active \e yers (4-4 4-4;
::::::::^
N = # ! r i#&^ f e is^ ^ ^ 10"'
: ^ ^ ^ H * ^
^ N ^ |^T%T-T
:::«S«
•c*
10"2
X"
>x10"3 V $ =
\ A
Y i
10"4 1 — G — GM uncorrelated ; 1111; 11
~ $ ~ GMD correlated, p -0 . 2: : : : : : : : -5 - ^ - SVD correlated, p=0.2
8 10 12 14 16 18 20 SNR (dB)
Figure 13: BER for a GMD- vs. SVD-assisted MIMO sys tem with 4 active layers (TM 4-4-4-4): uncorrelated (solid line) vs. correlated with ρ=0.2 (dashed line).
mission modes and a correlation factor ρ = 0.4 (mod
erate). Now the effect of the correlation is noticed. The best performance is obtained with the transmis sion mode 256-0-0-0, i.e., activating just one layer. Finally, figure 16 depicts the BER performance for a
correlation factor Figure ρ = 0.6 (strong). Now the an
tennas’ correlation effect is noticeable and the trans mission mode with the best performance is (TM 256-0-0-0), i.e., the case in which just one layer is active. The analysis of the three figures provides clear conclusions. The transmission mode 4-4-4-4 with four active layers shows the worst performance in all the cases. This is because in the computation of the geometric mean we are considering the layer fourth, the one with the lowest singular value. Moreover, the correlation effect favours the appearance of weak lay ers which negatively affects the resulting geometric mean of the singular values. Furthermore, the correla tion also favours the appearance of very strong layers. In this case, the lower the number of active layers the higher the resulting geometric mean. This is because the transmission mode 256-0-0-0 shows the best per formance for moderate and strong correlation.
A key point in this discussion is the comparison between transmission mode 16-4-4-0 (with three ac tive layers) and transmission modes 64-4-0-0 and 16-16-0-0 (with two active layers). For moderate correla tion transmission mode 16-4-4-0 performs better than 64-4-0-0. As correlation increases the third active layer shows a lower singular value and the geomet ric mean drops resulting in a worse performance (as
shown for ρ=0.4 and ρ=0.6). Furthermore, the trans
mission mode 16-16-0-0 show a better performance than 64-4-0-0 (in this example). The equal distribu tion of bits along the active layers seems to be better than the unequal distribution given by transmission mode 64-4-0-0. Nevertheless this is not a general rule and depends on the resulting geometric mean.
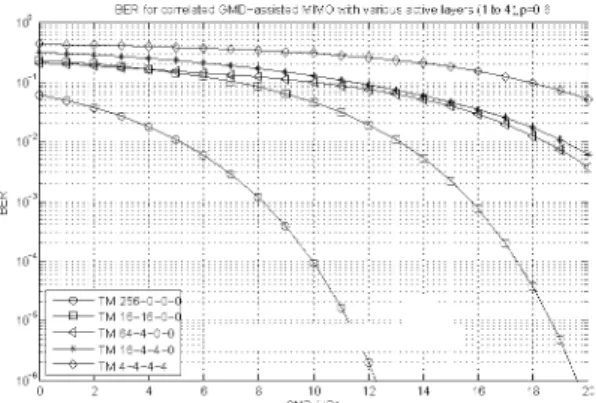
10°
3ER for correlated GMD-assisted MIMO with v arious active layers 1 to 4),p=0.2 10°
-^Y7^
fete ~T^
in ' fete W^?TT7^^^fe ~T^
m"2 ^ ^ ^*=SJK, ^
10"3 \ X . • "V—3
m"4
10"5 D \
10"5
TM 4-4-4-4
0 2 4 e 3 10 12 14 16 18 2C 3NR (dB;
Figure 14: BER comparison for a GMD-assisted MIMO system with various active layers and a Tx/Rx correlation factor p=0.2.
BER for correlated GMD-assisted MIMO with various active la vers (1 to 4),p=0.4
h^~^ >—<^(
^ a ^ \
\ S
D TM 16-16-0—C \ \
3 10 12 14
3NR (dB;
Figure 15: BER comparison for a GMD-assisted MIMO system with various active layers and a Tx/Rx correlation factor ρ=0.4.
7 CONCLUSIONS
This paper analyses the performance of exemplary 4×4 GMD-assisted MIMO systems affected by an-tennas’ correlation focussing on the geometric mean
14 I t I t 2L
I I
C
-7 C
-i
C
C
-E IL
C
3E R f o r c o r r e l a t e d G M D-a s s i s t e d M I M O w i t h v a r i o u s a c t i v e l a y e r s (1 to 4 ) , p= 0 6
s-4-* ^^7^TT~^-^
h ^ ^
T-r^>r^-^ ^ — € ^
^ ^ •< . . . .
TT^R::: S^L%^^
,
~^— TM 16—16—0—C
TM 4-4-4-4
"J 2 4 6 8 1 0 1 2 1 4 16 18 2C
3N R ( d B;
Figure 16: BER comparison for a GMD-assisted MIMO system with various active layers and a Tx/Rx correlation factor ρ=0.6.
PDF and CCDF of the singular values as well as the BER, comparing with the uncorrelated one. Several transmission modes have been defined by the acti vation of a different number of layers. The analy sis takes into consideration various antennas’ correla tion indexes to show the robustness of GMD-assisted MIMO systems against correlation.
The simulations outcomes demonstrate that an tennas’ correlation affects the SVD-assisted MIMO channel performance by decreasing its throughput and increasing the BER. This behaviour is caused by the existence of predominant weak and strong lay ers with corresponding small and large valued singu lar values respectively, which are the particular layer gain coefficient. In the case of GMD-assisted MIMO systems the number of active layers leads to differ ent conclusions. The PDF and CCDF of the singu lar values and their geometric mean seems to be a proper way to anticipate the SVD-assisted and GMD-assisted MIMO systems performance.
As shown, for a given number of active lay ers, antennas’ correlation significantly spreads the singular values CCDF curves dropping the overall channel performance. Nevertheless the geometric mean CCDF curves don’t significantly change with correlation. As the separation between the singu lar values CCDF curves increases, the overall SVD-assisted MIMO channel performance drops due to the poor performance of weak layers (with low val ued gain coefficients). Conversely, the geometric mean CCDF curve for a given number of active layers doesn’t remarkably change with correlation, conclud ing that GMD-assisted MIMO systems are more ro bust against antennas’ correlation than SVD–assisted ones. Then, in general terms GMD-assisted MIMO systems performs better than SVD-assisted ones, spe cially when weak layers exist (particularly in corre lated channels).
The activation a different number of layers results in distinct transmission modes which show different performances as shown in the results. In order to minimize the overall BER the same constellation size as well as the same transmit power per layer should be used. Although individual layers in GMD-assisted MIMO systems perform in the same way as the gain coefficient is the same, the appropriate usage of dif ferent constellations per layer can improve the overall MIMO channel performance.
Activating a larger number of layers takes into ac count weak layers. In consequence, due to the low valued singular values of weak layers the computed geometric mean diminishes and the GMD-assisted MIMO system performance drops. This outcome is much more remarkable as the antennas’ correlation increases. At the opposite side, activating just one layer leads to the largest geometric mean value. Nev ertheless the best performance is not reached because a high order constellation is transmitted. An interme diate number of active layers seems to be the most appropriate solution which depends on the particular correlation index.
REFERENCES
Ahrens, A., Cano-Broncano, F., and Benavente-Peces, C. (2013). Power distribution for svd-aided mimo trans mission with receiver-side antennas correlation. In
10th IASTED International Conference on Signal Pro cessing, Pattern Recognition, and Applications (SP-PRA), Innsbruck (Austria).
Benavente-Peces, C., Cano-Broncano, F., Ahrens, A., Ortega-Gonzalez, F., and Pardo-Martin, J. (2013). Analysis of singular values pdf and ccdf on receiver-side antennas correlated mimo channels. Electronics
Letters, 49(9):625–627.
Foschini, G. J. and Gans, M. J. (1998). On limits of wire less communications in a fading environment when using multiple antennas. Wireless Personal Commu
nications, 6:311–335.
Haykin, S. S. (2002). Adaptive Filter Theory. Prentice Hall, New Jersey.
Janaswamy, R. (2002). Effect of element mutual coupling on the capacity of fixed length linear arrays. Antennas
and Wireless Propagation Letters, IEEE, 1(1):157–
160.
Jiang, Y., Li, J., and Hager, W. W. (2005). Joint transceiver design for mimo communications using geometric mean decomposition. Signal Processing, IEEE Trans
actions on, 53(10):3791–3803.
Kinjo, S. and Ohno, S. (2013). A tomlinson-harashima pre-coding for correlated mimo channels. In Intelligent
Signal Processing and Communications Systems (IS-PACS), 2013 International Symposium on, pages 257–
Lee, W.-Y. (1973). Effects on correlation between two mo-bile radio base-station antennas. IEEE Transactions
on Vehicular Technology, 22(4):130140.
Ozgur, A., Leveque, O., and Tse, D. (2013). Spatial de-grees of freedom of large distributed mimo systems and wireless ad hoc networks. Selected Areas in
Com-munications, IEEE Journal on, 31(2):202–214.
Yang, P., Xiao, Y., Yu, Y., and Li, S. (2011). Adaptive spa-tial modulation for wireless mimo transmission sys-tems. IEEE Communications Letters, 15:602–604. Zhou, Z., Vucetic, B., Dohler, M., and Li, Y. (2005). Mimo
systems with adaptive modulation. IEEE Transactions
![Theinfluenceofmotivationalelementsatschool,thelearningstrategiesandtheacademic Theperceivedauto-e ffi ciency,whichisthejudgementabouttheself-capacitytoreachsuccess Inthismatter,Ifinedo[ ]mentionsthattheBandura’ssocialcognitivetheorystatesthatthelearningproces](data:image/gif;base64,R0lGODlhAQABAIAAAP///wAAACH5BAEAAAAALAAAAAABAAEAAAICRAEAOw==)