Universidad de Cantabria
CSIC - Universidad de Cantabria
Instituto de F´ısica de Cantabria
La emisi´on infrarroja de galaxias activas
Memoria presentada por la Licenciada
Judit Garc´ıa Gonz´alez
para optar al t´ıtulo de Doctora en Ciencias, Tecnolog´ıa y Computaci´on
Declaraci´on de Autor´ıa
Almudena Alonso Herrero, Doctora en Ciencias F´ısicas e Investigadora Cient´ıfica en el Centro de Astrobiolog´ıa, CSIC-INTA,
CERTIFICA que la presente memoria
La emisi´on infrarroja de galaxias activas
ha sido realizada por Judit Garc´ıa Gonz´alez bajo mi direcci´on.
Considero que esta memoria contiene aportaciones suficientes para construir la tesis Doctoral de la interesada.
En Santander, a 10 de Marzo de 2017
Almudena Alonso Herrero
A mi abuela. . .
Agradecimientos
Despu´es de estos a˜nos de doctorado me gustar´ıa expresar mi agradecimiento a todas las personas que han estado a mi lado y me han ayudado a finalizar esta tesis.
En primer lugar me gustar´ıa agradecer a mi directora de tesis, Almudena, el haberme permitido realizar esta tesis doctoral. Su ayuda y comentarios cient´ıficos han sido imprescindibles para que esta tesis salga adelante. Agradecerle tambi´en su dedicaci´on extra y accesibilidad a pesar de la distancia, y sus respuestas sin demora a todas mis dudas. Tambi´en quiero agradecer a Silvia Mateos que haya aceptado ser mi tutora de tesis y sus atinadas correcciones, as´ı como los buenos ratos pasados. Nunca olvidar´e todas las an´ecdotas del ´ultimo congreso en Canarias, y todo lo que nos pudimos re´ır.
Tambi´en quisiera agradecer a Pablo el haberme dirigido el TFM y haberme animado a venir a San-tander. ´El consigui´o que la asignatura de f´ısica extragal´actica fuera mi preferida entre todas las asig-naturas de la especialidad. Si no fuera por ´el, yo no estar´ıa aqu´ı.
Debo agradecer tambi´en a Sebastian su hospitalidad y ayuda durante mi estancia en Southampton. Tra-bajar dos meses all´ı fue una experiencia enriquecedora en todos los aspectos. Tambi´en a los estudiantes de doctorado de Southampton, por los divertidos desayunos de los viernes.
Tambi´en quiero dar las gracias a Antonio por estar siempre disponible, tanto en persona mientras estuvo en el IFCA como por correo electr´onico. No s´e c´omo aguant´o tantas dudas y preguntas sin echarme de su despacho.
Mi agradecimiento tambi´en a todo el grupo de Galaxias y AGN del IFCA, tanto a los que han llegado hace poco, como a los que ya se fueron y los que todav´ıa est´an, por hacerme sentir una m´as del grupo desde el primer d´ıa. ¡Voy a echar mucho de menos esos jueves gastron´omicos! Muchas gracias a todos: Raquel, Nuria, ´Angel, Maite, Ester, Pilar, Silvia Mart´ınez, Bea, Francisco, Xavier. Y en especial, a mis compa˜neros de despacho, Anuar y Nacho, que se han convertido en muy buenos amigos y espero no perder el contacto con ellos.
Gracias en general a toda la gente del IFCA por crear un ambiente tan sano. Echar´e de menos los mi´ercoles de cine y las partidas de rol. Ha sido un placer pasar estos a˜nos all´ı. En especial gracias a David, Diego, Rosa y Bel´en por todos los momentos vividos y por su inestimable amistad. Toda la gente que he conocido y los lugares que he podido visitar durante mi doctorado han hecho de este mucho m´as que una mera experiencia acad´emica.
Tambi´en quiero agradecer a todos mis amigos que me han apoyado durante estos a˜nos. Una menci´on especial merecen Iv´an y Esther, que a pesar de la distancia siempre est´an ah´ı (aunque sea por what-sapp). ¡Me parece incre´ıble que desde los 3 a˜nos no hayamos perdido la amistad! Adem´as, quiero agradecer su amistad y apoyo a Cris, que es la que mejor entiende todo mi estr´es de estos ´ultimos meses. ¡ ´Animo, ya nos queda poco para ser doctoras!
Durante mi estancia en Santander he conocido a mucha gente en clases de baile. Quiero agradecerles el buen ambiente creado y en especial dar las gracias a Estefan´ıa, a qui´en conoc´ı en clase de baile y se ha convertido en una buena amiga.
Por ´ultimo, pero no menos importante, quiero agradecer todo el apoyo que me ha dado mi familia y en especial mi madre. Sin ella, no hubiera podido dedicarme a esto. Me gustar´ıa dedicar un recuerdo a mi abuela Rufina, que por desgracia no me ha podido ver convertida en doctora. Tambi´en quiero dar gracias a Carlos por estar a mi lado y apoyarme, sobre todo en los ´ultimos meses de m´as estr´es.
Resumen de la tesis en castellano
Actualmente se cree que existen agujeros negros supermasivos (MSMBH>106M , SMBH del ingl´es
Super Massive Black Holes) en el centro de todas las galaxias con un bulbo prominente. Este SMBH juega un papel importante en la formaci´on de galaxias, compartiendo mecanismos de formaci´on y crecimiento con el bulbo de las galaxias. En algunas galaxias el SMBH est´a inactivo mientras que en otras el SMBH est´a acretando material y creciendo. Este ´ultimo fen´omeno se conoce como n´ucleo gal´actico activo (AGN, Active Galactic Nucleus) y es muy energ´etico; la luminosidad de la regi´on central puede llegar a ser miles de veces mayor que la de la galaxia anfitriona.
Seg´un la versi´on m´as simple del modelo unificado, todos los AGN tienen la misma estructura: SMBH, disco de acreci´on, corona, regi´on de emisi´on de l´ıneas anchas (BLR, del ingl´es Broad Line Region), toro, regi´on de emisi´on de l´ıneas estrechas (NLR, del ingl´es Narrow Line Region) y algunos tipos de AGN presentan un chorro de part´ıculas a velocidades relativistas. Los AGN emiten en todo el espectro electromagn´etico, desde radio a rayos γ, con una parte importante de su emisi´on en el infrarrojo (IR). Cada uno de los elementos del AGN tiene el pico de emisi´on en un rango diferente, por lo que el es-tudio de un rango en concreto del espectro electromagn´etico proporciona informaci´on de un elemento espec´ıfico (por ejemplo, el disco de acreci´on, gas en la regi´on de l´ıneas anchas, el toro, etc). Las dife-rencias observadas entre los distintos tipos de AGN se explican mediante efectos de orientaci´on, siendo el toro de polvo y gas el ingrediente clave para explicar esta dependencia. Como el toro reprocesa la radiaci´on ´optica y ultravioleta (UV) del disco de acreci´on y la reemite en el rango IR, es importante estudiar la emisi´on IR para entender las propiedades del toro de polvo que rodea al AGN.
La emisi´on IR de las galaxias activas no s´olo se debe al AGN sino tambi´en a la galaxia anfitriona. En el caso de las galaxias Seyfert (las m´as comunes en esta tesis) la emisi´on IR se puede entender como una combinaci´on de tres componentes espectrales principales: continuo y caracter´ısticas espectrales debidas al polvo calentado por el AGN y formaci´on estelar, as´ı como l´ıneas de emisi´on (at´omicas, i´onicas y moleculares) que pueden ser igualmente excitadas por el AGN y/o formaci´on estelar. Mien-tras que la emisi´on nuclear en el IR cercano (NIR, del ingl´es Near Infrared) y en el IR medio (MIR, del ingl´es Mid Infrared) de las galaxias Seyfert est´a dominada por el AGN, la emisi´on en el IR lejano (FIR, del ingl´es Far Infrared) est´a normalmente dominada por la galaxia anfitriona.
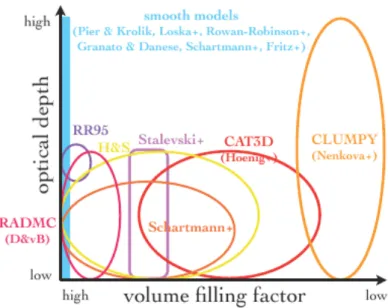
En los ´ultimos a˜nos se han presentado numerosos modelos de toro para reproducir las observaciones en el IR de los AGN. Estos modelos se pueden dividir en modelos hidrodin´amicos y modelos de transferencia radiativa. Estos ´ultimos han pasado en los ´ultimos 15 a˜nos de configuraciones en las que el polvo est´a distribuido uniformemente a configuraciones m´as f´ısicas donde el polvo se encuentra en nubes, tambi´en llamadas configuraciones de toro ”grumoso” (clumpy torus). Estudios din´amicos e interferometr´ıa en el MIR favorecen una estructura grumosa en vez de un toro uniforme. Para delimitar los par´ametros de los modelos de toro es necesario comparar predicciones de los modelos de toro grumoso con observaciones el el IR de los AGN hechas con alta resoluci´on angular.
Existen diferentes m´etodos para seleccionar AGN tanto en el Universo Local como a distancias cos-mol´ogicas. No es posible tener una t´ecnica de selecci´on de AGN eficiente, fiable y completa, ya que no todos los AGN muestran las mismas caracter´ısticas observacionales. Convencionalmente, el m´etodo m´as usado y directo para identificar AGN ha sido la espectroscop´ıa ´optica. Los AGN pueden ser identi-ficados por la presencia de l´ıneas de emisi´on anchas, por la detecci´on de l´ıneas estrechas caracter´ısticas de la ionizaci´on de los AGN, o por cocientes de intensidades de l´ıneas en diagramas de diagn´ostico como [Oiii]λ5007/Hβ vs [Nii]λ6583/Hα. Los AGN en campos cosmol´ogicos suelen ser identificados por su emisi´on en rayos X, su emisi´on IR, un exceso en la emisi´on en radio y por combinaciones de di-ferentes emisiones. Como la mayor´ıa de AGN var´ıa en escalas de tiempo de horas a millones de a˜nos, la variabilidad es otro m´etodo usado para seleccionar AGN. Este m´etodo selecciona preferentemente AGN de baja luminosidad porque se espera que muestren mayor variabilidad que los m´as luminosos. Todos estos m´etodos de selecci´on de AGN son complementarios y pueden detectar fuentes que otros m´etodos pueden perder.
Objetivos de la investigaci´on
Como se ha explicado anteriormente, al no haber una ´unica t´ecnica para identificar AGN es importante usar diferentes m´etodos ya que todos ellos presentan sesgos. Adem´as, la banda IR es el rango espectral clave para entender el toro de polvo del AGN. Como la galaxia anfitriona tambi´en emite en el IR, es importante separar ambas emisiones.
El principal objetivo de esta tesis es el estudio de la emisi´on IR tanto en AGN de galaxias cercanas como de galaxias en campos cosmol´ogicos. Esta tesis est´a dividida en dos partes diferentes. El prin-cipal prop´osito de la primera parte es la selecci´on de AGN en campos cosmol´ogicos por medio de la variabilidad en el IR, usando para ello datos de Spitzer/MIPS 24 µm (Cap´ıtulo 3). El objetivo de la segunda parte es el estudio del polvo calentado por el AGN en galaxias cercanas usando para ello datos de Herschel y de telescopios en tierra (Cap´ıtulos 4 y 5).
Seleccionar AGN por su variabilidad IR (24 µm) es un nuevo m´etodo que permite identificar AGN oscurecidos y de baja luminosidad que no son detectados por otros estudios. Adem´as permite comparar
los AGN variables seleccionados con cat´alogos de AGN seleccionados por otros m´etodos, y estimar la fracci´on que suponen estos AGN oscurecidos respecto a la poblaci´on general de AGN. Tambi´en es posible calcular la contribuci´on de estos AGN a la emisi´on en el MIR total para estas fuentes variables. Por otra parte, el estudio de galaxias Seyfert cercanas permite separar la emisi´on nuclear en el IR debida al polvo calentado por el AGN de la debida al polvo calentado por formaci´on estelar, y por tanto se pueden estudiar las propiedades en el IR de los AGN. Tambi´en permite comparar estad´ısticamente las propiedades en el MIR de las galaxias Seyfert con las predicciones de los modelos de toro grumoso. Los objetivos de la tesis se pueden resumir en los siguientes puntos:
1. Seleci´on de AGN por su variabilidad en 24 µm usando un m´etodo estad´ıstico χ2.
2. Caracterizaci´on de las propiedades de las fuentes variables en 24 µm, as´ı como su comparaci´on con otros estudios de variabilidad.
3. Mecanismos que dan lugar a la emisi´on nuclear e integrada en el FIR para galaxias Seyfert cercanas analizando para ello sus propiedades, como la emisi´on no resuelta en 70 µm, la dis-tribuci´on de colores en el FIR, las tasas de formaci´on estelar (SFR, del ingl´es Star Formation Rates) nuclear y extranuclear y resultados de ajustar las distribuciones espectrales de energ´ıa FIR a un cuerpo gris.
4. Identificaci´on de galaxias Seyfert cuya emisi´on en 70 µm es debida principalmente al polvo calentado por el AGN, usando para ello 4 criterios diferentes.
5. Estudio de la emisi´on en el MIR debida a polvo calentado por el AGN.
6. Comparaci´on estad´ıstica entre las propiedades en el MIR de AGN y las predicciones de modelos de toro grumos, permitiendo delimitar algunos de los par´ametros de los modelos.
Planteamiento y metodolog´ıa
Para lograr los objetivos enumerados anteriormente se han usado principalmente dos estrategias dife-rentes: im´agenes, usando para ello instrumentos en telescopios espaciales (como MIPS en Spitzer y PACS y SPIRE en Herchel) y espectroscop´ıa usando instrumentos en telescopios terrestres (como T-ReCS en el telescopio de 8.1 m Gemini-South, VISIR en el telescopio de 8.2 m VLT UT3, CanariCam en el Gran Telescopio de Canarias de 10.4 m y Michelle en el telescopio de 8.1 m Gemini-North). La estrategia adoptada para el primer estudio (selecci´on de AGN mediante variabilidad en 24 µm) consiste en recopilar todos los datos tomados por el instrumento MIPS alrededor de los campos cos-mol´ogicos GOODS. Estos datos corresponden a diferentes propuestas de observaci´on y pueden ser
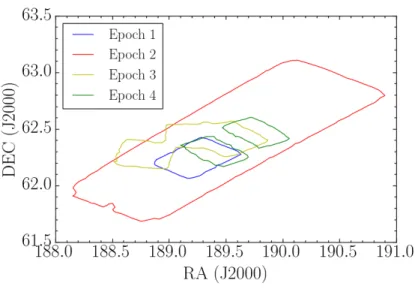
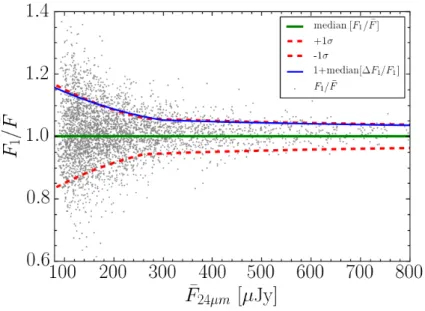
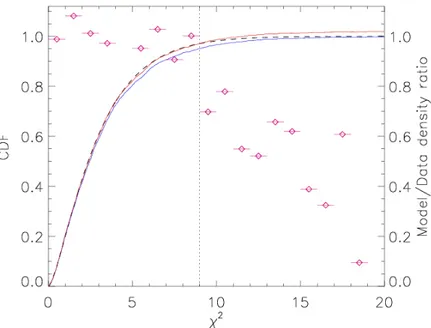
recopilados mediante el archivo de Spitzer (Spitzer Heritage Archive). Se dividen los datos en dife-rentes ´epocas y se obtienen los flujos a 24 µm de las fuentes en cada ´epoca. Cruzando los datos de las distintas ´epocas se obtiene un cat´alogo con las fuentes comunes a todas las ´epocas. Con los datos de este cat´alogo se usa un m´etodo estad´ıstico χ2 que tiene en cuenta los diferentes errores fotom´etricos para seleccionar las fuentes variables. Se estudian las propiedades de las fuentes seleccionadas por su variabilidad y se compara con otros cat´alogos de AGN y estudios de variabilidad en otras longitudes de onda.
Para el segundo trabajo (emisi´on nuclear e integrada en el FIR de galaxias Seyfert cercanas) la es-trategia utilizada ha sido diferente debido a que en este trabajo se estudian galaxias cercanas en lugar de galaxias en campos cosmol´ogicos. Para este trabajo se han seleccionado 33 galaxias Seyfert con im´agenes tomadas con PACS (70, 100 y 160 µm) y SPIRE (250, 350 y 500 µm) y con espectroscop´ıa en el MIR de gran resoluci´on espectral. Esto permite determinar si las galaxias poseen actividad de formaci´on estelar en escalas de 50 − 60 pc, lo cual es necesario para determinar si las galaxias tienen su emisi´on en el FIR dominada por el AGN. Se han realizado medidas fotom´etricas tanto para la zona nuclear como para la galaxia entera. Se definen 4 criterios diferentes para identificar las galaxias con una contribuci´on importante en la emisi´on en 70 µm debida polvo calentado por el AGN. Estos criterios son: (1) elevados cocientes fν(70 µm)/ fν(160 µm) respecto a los t´ıpicos colores para galaxias con for-maci´on estelar, (2) gradiente de temperatura del polvo mayor que los valores t´ıpicos para las galaxias con formaci´on estelar, (3) exceso de emisi´on en 70 µm respecto al ajuste de la emisi´on integrada a un cuerpo negro con valor de la emisividad del polvo de β= 2, y (4) exceso de la SFR nuclear obtenida a partir de la emisi´on en 70 µm respecto a la obtenida mediante indicadores en el MIR.
Para el tercer trabajo (investigaci´on estad´ıstica de las predicciones de los modelos de toro grumoso en el MIR) se utiliza espectroscop´ıa como estrategia principal, al contrario que en los anteriores trabajos en los que se usa la fotometr´ıa. Para ello se selecciona una muestra de 53 galaxias Seyfert cercanas con espectroscop´ıa de alta resoluci´on en el MIR (t´ıpicamente 7.5 − 13 µm) tomada con telescopios terrestres. Los espectros en el MIR de las galaxias se descomponen usando el programa deblendIRS para obtener las distintas componentes y poder estudiar la contribuci´on del AGN. Las propiedades obtenidas para las galaxias, en nuestro caso la fuerza de los silicatos en 9.7 µm y el ´ındice espectral medido entre 8.1 y 12.5 µm, se comparan estad´ısticamente con las predicciones de los modelos de toro grumoso CAT3D de H¨onig and Kishimoto (2010), as´ı como con una nueva versi´on de los modelos que incluye una mejor representaci´on f´ısica de las propiedades de sublimaci´on del polvo. Comparando las predicciones de los modelos con las propiedades obtenidas para las galaxias se pueden delimitar algunos de los par´ametros de los modelos de toro grumoso.
Aportaciones originales
La investigaci´on presentada en esta tesis ha contribuido significativamente al conocimiento de la emisi´on en el IR de los AGN. Se han introducido varias novedades en este trabajo respecto a trabajos publicados anteriormente.
En el caso de los AGN seleccionados mediante variabilidad en 24 µm, se trata del primer estudio realizado en esa longitud de onda. Existen diversos estudios sobre variabilidad en los campos cos-mol´ogicos GOODS tanto en el ´optico como en el rayos X y en radio. Pero no existe ning´un estudio de variabilidad usando el MIR. Por tanto este trabajo ofrece un m´etodo novedoso para seleccionar AGN poco luminosos y oscurecidos que no son identificados con otras t´ecnicas. Aparte de este trabajo, s´olo existe un estudio de variabilidad en el IR en otro campo cosmol´ogico. En ese trabajo usaron las bandas m´as sensibles de IRAC a 3.6 y 4.5 µm (NIR) para seleccionar fuentes variables.
En el caso de la emisi´on nuclear e integrada en el FIR de galaxias Seyfert cercanas, es el primer estudio estad´ıstico de la contribuci´on en el FIR del AGN. Existen diversos estudios de galaxias individuales para determinar la contribuci´on del polvo calentado por el AGN a la emisi´on total en el FIR, pero ninguno para grandes muestras de galaxias. Por ello es importante encontrar un m´etodo para poder de-terminar estad´ısticamente si el AGN domina en el FIR sin necesidad de hacer ajustes individuales para cada galaxia. Los 4 criterios definidos en este trabajo proporcionan una novedosa forma de seleccionar estad´ısticamente galaxias Seyfert con una contribuci´on significativa del AGN a 70 µm.
En el caso de la investigaci´on estad´ıstica de las predicciones de los modelos de toro grumoso en el MIR, la nueva versi´on de los modelos CAT3D de H¨onig and Kishimoto (2010) introducen un modelo diferencial de sublimaci´on del polvo novedoso que es ´unico y no est´a incluido en otros modelos de toro grumoso disponibles en la literatura. Los nuevos modelos producen distribuciones espectrales de energ´ıa m´as azules en el NIR y MIR y reproducen mejor las propiedades en el MIR de las galaxias Seyfert locales.
Los resultados obtenidos durante esta tesis han sido presentados en varios congresos y revistas interna-cionales (Garc´ıa-Gonz´alez et al. 2015, 2016). El ´ultimo trabajo ha sido enviado a la revista MNRAS.
Conclusiones
La investigaci´on realizada durante esta tesis est´a centrada en la emisi´on IR puesto que es la emisi´on clave para poder estudiar el toro de polvo que rodea el AGN.
El primer estudio realizado (Cap´ıtulo 3) ha permitido seleccionar AGN mediante su variabilidad en 24 µm (longitud de onda observada) en los campos cosmol´ogicos GOODS usando para ello un m´etodo
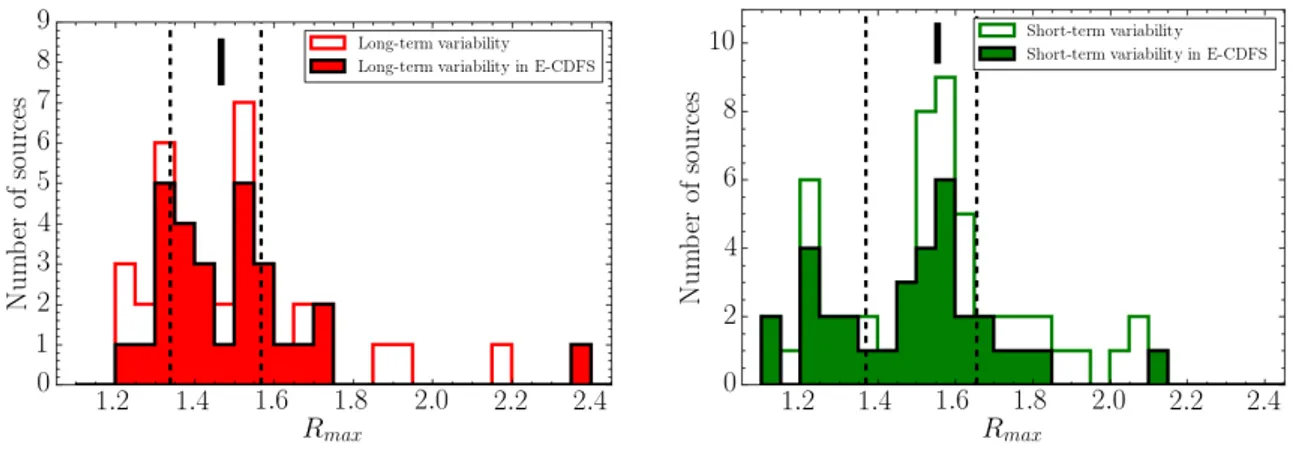
estad´ıstico χ2. El principal resultado obtenido en este trabajo es que solo el ∼50% de las fuentes varia-bles en 24 µm est´an identificadas como AGN por otros m´etodos. Adem´as, la contribuci´on estimada del AGN a la emisi´on en el MIR para las fuentes variables es peque˜na (t´ıpicamente de menos del 20%). Por lo tanto, se espera que estas fuentes variables en 24 µm contengan AGN poco luminosos, donde se espera que la variabilidad sea mayor. De todas formas, la contribuci´on de las fuentes variables en 24 µm a la poblaci´on general de AGN es peque˜na (∼13%).
El segundo trabajo (Cap´ıtulo 4) presenta un m´etodo basado en 4 criterios diferentes para seleccionar galaxias cuyo AGN tiene una contribuci´on significativa en la emisi´on en 70 µm. El principal resul-tado de este trabajo es que a pesar de que en la mayor´ıa de galaxias Seyfert la emisi´on en el FIR est´a dominada por la galaxia anfitriona, el 18% de la muestra inicial tiene una contribuci´on significativa (∼ 40 − 70% de su emisi´on nuclear) debida al polvo calentado por el AGN. Por lo tanto, los crite-rios definidos en este trabajo proporcionan un buen m´etodo para seleccionar estad´ısticamente galaxias Seyfert con emisi´on significativa en 70 µm debida al AGN.
El tercer trabajo (Cap´ıtulo 5) presenta una comparaci´on estad´ıstica de propiedades en el MIR de gala-xias Seyfert con las predicciones de modelos de toro grumoso CAT3D de H¨onig and Kishimoto (2010), as´ı como con los nuevos modelos. El principal resultado obtenido en este trabajo es que en general los nuevos modelos reproducen mejor las propiedades en el MIR de los AGN locales. Adem´as, aunque no es posible romper la degeneraci´on en todos los par´ametros de los modelos CAT3D (o de cualquier otro modelo de toro grumoso) usando ´unicamente espectroscop´ıa en el MIR, se pueden descubrir diferentes tendencias entre galaxias Seyfert 1 y Seyfert 2.
Futuras l´ıneas de investigaci´on
Los resultados presentados en esta tesis se podr´ıan extender a trav´es de las siguientes l´ıneas de ac-tuaci´on:
• Uso del m´etodo de variabilidad en 24 µm para seleccionar AGN de baja luminosidad en otros campos cosmol´ogicos. El mismo m´etodo presentado en el Cap´ıtulo 3 puede ser utilizado en otros campos cosmol´ogicos en los que haya observaciones en varias ´epocas tomadas con Spitzer. Adem´as, las conclusiones de este trabajo se pueden fortalecer estudiando espectrosc´opicamente las fuentes variables que no son seleccionadas como AGN con otros m´etodos. Se podr´ıa usar, por ejemplo, el instrumento x-shooter en el VLT que permite tomar espectros de media resoluci´on con longitudes de onda entre 300 − 2500 nm. Esto permitir´ıa probar si las fuentes variables no detectadas como AGN por otros m´etodos son realmente AGN.
• Estimaci´on del flujo debido al AGN en 70 µm mediante predicciones de modelo de toro grumoso. Para fortalecer los resultados obtenidos en el Cap´ıtulo 4 se puede estimar individualmente el flujo
en 70 µm debido al AGN, seg´un se hizo para IC 5063 y NGC 4151 (Alonso-Herrero et al. 2011; Ichikawa et al. 2015), para aquellas galaxias seleccionadas gracias a los 4 criterios definidos. Adicionalmente, se podr´ıa utilizar interferometr´ıa con ALMA para resolver el toro en el FIR (∼450 µm) en otros AGN adem´as de en NGC 1068 (Garc´ıa-Burillo et al. 2016).
• Introducci´on de emisi´on anis´otropa del AGN en los nuevos modelos CAT3D. Los resultados del Cap´ıtulo 5 pueden ser extendidos explorando los efectos en las propiedades del MIR producidos al introducir emisi´on anis´otropa del AGN. Esta emisi´on anis´otropa tiene en cuenta la depen-dencia angular esperada para la emisi´on UV del AGN. Esta dependepen-dencia puede ser introducida como cos(i) en la iluminaci´on de las nubes del toro por el AGN, como una aproximaci´on a la dependencia angular de la radiaci´on UV en un disco de acreci´on ∝ 1/3cos(i) ∗ (1+ 2cos(i)) (Netzer 1987), tambi´en adoptada en otros trabajos (por ejemplo H¨onig et al. 2006; Schartmann et al. 2005, 2008).
Universidad de Cantabria
Departamento de F´ısica Moderna
CSIC - Universidad de Cantabria
Instituto de F´ısica de Cantabria
Infrared emission of active galaxies
A dissertation submitted in partial fulfillment of the requirements for the degree of Doctor of Philosophy in Physics
by
Summary
Nowadays it is accepted that all galaxies with a significant bulge component contain a supermassive black hole (SMBH) in their centres. This SMBH plays an important role in the formation of galaxies, sharing formation and growing mechanisms with the bulges of the galaxies. In some galaxies the SMBH is quiet, but in others the SMBH is accreting material and growing. The latter phenomenon is referred to as an active galactic nucleus (AGN) and it is very energetic, with the central region being able to reach luminosities as high as a few thousands that of the host galaxy.
AGN emit in all the electromagnetic spectrum, from radio to γ-ray, with a significant emission in the infrared (IR). Each AGN component peaks at a different range, so studying a particular electromagnetic range gives information about a specific component of the AGN. All AGN have the same components according to the simplest version of the unified model. The observational differences observed between different types of AGN are explained by orientation effects, with the obscuring dusty torus being the key ingredient to explain this orientation dependence. Since the torus reprocesses the optical/UV radiation from the accretion disk and re-emits in the IR range, it is important to study this IR emission to understand the dusty torus of the AGN.
The IR emission of active galaxies is not only due to the AGN but also to the host galaxy. Their IR emission of radio quiet AGN can be understood as a combination of three main spectral components: the thermal radiation from the dusty torus of the AGN, the thermal dust continuum and features due to star formation and line emission emanating from molecular, atomic, and ionic species. Whereas the nuclear near-IR (NIR) and mid-IR (MIR) emission of Seyfert galaxies (the most common galaxies in our study) is dominated by the AGN, the far-IR (FIR) emission is often dominated by the host galaxy. To reproduce the IR observations of AGN, a large number of torus models have been developed in the last years. They can be divided into hydrodynamical models and radiative transfer models, with the latter moving from smooth to clumpy dust configurations. Dynamical studies and MIR interferometry tend to favour a clumpy structure rather than a uniform torus. To constrain the torus model param-eters it is necessary to compare predictions of clumpy torus models with high angular resolution IR observations of AGN.
There are different methods to select AGN both in the Local Universe and at cosmological distances. As not all AGN show the same observational features, having an efficient, reliable and complete AGN selection technique is not possible, all of the methods present their own bias. Conventionally, the most direct and used method to identify AGN has been optical spectroscopy. AGN can be identified through the presence of broad emission lines, the detection of narrow emission lines characteristic of AGN ionization, or by line intensity ratios in diagnostic diagrams, such as [Oiii]λ5007/Hβ vs [Nii]λ6583/Hα. AGN in cosmological fields are routinely identified by their X-ray emission, MIR emission, excess radio emission and combinations of different emissions. Since the majority of AGN vary on time-scales from hours to millions of years, variability is another method used to select AGN. It selects preferentially low-luminosity AGN because they are expected to show stronger variability than the luminous ones. All these methods of AGN selection are complementary and each one can detect sources that other methods may miss.
The main goal of this thesis is to study the IR emission of AGN in nearby galaxies as well as active galaxies in cosmological fields. This thesis is divided into two different parts. The main objective of the first part is to select AGN in cosmological fields by their IR variability using Spitzer/MIPS 24 µm data (Chapter 3) while the objective of the second part is to study the dust heated by the AGN in nearby Seyfert galaxies using data from Herschel and from ground-based telescopes (Chapters 4 and 5). This dissertation begins with an introduction to the AGN phenomenon (Chapter 1) and provides back-ground information about AGN, their classification, and the unified model. This chapter also gives background information about the AGN identification, the IR emission, and the clumpy torus models, to understand the motivation for the research presented in this thesis. The main instruments used to obtain the data analysed during this work are presented in Chapter 2.
Chapter 3 focuses on MIR variability as a method to select AGN in the GOODS cosmological fields, using MIPS 24 µm (observed wavelength) data and a χ2-statistics method. There are several studies of variability in other spectral ranges in these cosmological fields, such as optical, X-rays, and radio, but none of them has used MIR variability to select AGN. Therefore, this work provides a new way to select low-luminosity and obscured AGN. The main finding of this work is that only ∼50% if the MIPS 24 µm variable sources are identified as AGN by other methods. Moreover, the estimated AGN contribution to the MIR emission for the variable sources is low (typically less than 20%). Therefore, these 24 µm variable sources are likely to host low-luminosity AGN, where the variability is expected to be stronger. However, the contribution of the 24 µm variable sources to the entire AGN population is small (∼13%).
Chapter 4 presents a study of the nuclear and integrated FIR emission of Seyfert galaxies using images obtained with the Herschel telescope. Up until now there have been no statistical studies of the AGN contribution in the FIR using data obtained with the Herschel telescope. This works presents a method based on four different criteria to select galaxies whose nuclear 70 µm emission has a significant AGN contribution. The main finding of this work is that, although the majority of the FIR emission of Seyfert
galaxies is dominated by the host galaxy, 18% of the initial sample have a significant contribution (∼ 40 − 70% of their nuclear emission) from dust heated by the AGN. Therefore, the criteria defined in this chapter provide a good way to select statistically Seyfert galaxies with significant 70 µm emission due to the AGN.
Chapter 5 presents a statistical comparison of the MIR properties of Seyfert galaxies derived from high angular resolution spectroscopy and outputs from the CAT3D clumpy torus models (H¨onig and Kishimoto 2010). The latter include previously published models as well as new runs of the models with an improved dust sublimation physics. The main finding of this chapter is that the new models reproduce better the overall MIR properties of local AGN. Moreover, although it is not possible to break fully the degeneracy in all parameters of the CAT3D models (or any other clumpy torus models) by using MIR spectroscopy alone, some different trends between Seyfert 1 and Seyfert 2 galaxies can be uncovered.
Finally, Chapter 6 summarizes the results obtained during this thesis and presents how this work can be extended in the future.
Contents
Declaraci´on de Autor´ıa iii
Agradecimientos vii
Resumen en castellano ix
Summary xix
List of Figures xxvii
List of Tables xxxi
1 Introduction 1
1.1 Active Galactic Nuclei . . . 1 1.2 AGN classification . . . 4 1.3 The Unified Model . . . 7 1.4 AGN identification . . . 10 1.5 IR emission of active galaxies . . . 12 1.6 Torus models . . . 14 1.6.1 Radiative transfer models . . . 14 1.7 Aims of this thesis . . . 17
2 The instruments 19 2.1 Spitzer . . . 19 2.1.1 Spitzer/MIPS . . . 20 2.2 Herschel. . . 21 2.2.1 Herschel/PACS . . . 22 2.2.2 Herschel/SPIRE . . . 24 2.3 Ground MIR instruments . . . 24 2.3.1 T-ReCS . . . 25 2.3.2 VISIR . . . 25 2.3.3 CanariCam . . . 26 2.3.4 Michelle . . . 27
Contents xxiv
3 AGN candidates selected by 24µm variability 29
3.1 Motivation . . . 29 3.2 The data . . . 31 3.3 MIPS 24 µm photometry . . . 34 3.3.1 GOODS-South field . . . 34 3.3.2 GOODS-North field . . . 35 3.4 Selection of MIPS 24 µm variable sources . . . 35 3.5 Properties of the MIPS 24 µm variable sources . . . 40 3.5.1 MIPS 24 µm properties . . . 42 3.5.2 Variability Properties . . . 45 3.5.3 IRAC colours . . . 51 3.6 Candidates in the Extended Chandra Deep Field South . . . 54 3.6.1 Photometric redshifts and IRAC properties . . . 55 3.6.2 X-ray properties . . . 57 3.6.2.1 Fraction of 24 µm variable sources detected in X-rays . . . 57 3.6.2.2 Fraction of X-ray selected AGN found variable at 24 µm . . . 58 3.6.2.3 Candidates in the deepest X-ray region of the E-CDFS . . . 59 3.6.3 Monochromatic IR luminosities . . . 59 3.6.4 Radio properties . . . 60 3.6.5 Comparison with other variability studies . . . 62 3.7 Discussion and Summary . . . 62 4 The nuclear and integrated far-infrared emission of nearby Seyfert galaxies 65 4.1 Motivation . . . 65 4.2 The sample . . . 66 4.2.1 Sample comparison . . . 68 4.3 Herschelobservations . . . 73 4.3.1 Data reduction . . . 73 4.3.2 Aperture photometry . . . 73 4.4 Results . . . 80 4.4.1 Unresolved 70 µm emission . . . 80 4.4.2 FIR colours . . . 83 4.4.3 Grey-body fitting . . . 85 4.4.4 Star Formation Rates . . . 93 4.5 Identifying galaxies with significant 70 µm emission due to AGN heated dust . . . 95 4.5.1 Elevated fν(70 µm)/ fν(160 µm) flux ratios . . . 96 4.5.2 Dust temperature gradient higher than typical star forming galaxies . . . 97 4.5.3 Excess 70 µm emission with respect to the fit of the FIR SEDs with a grey body 97 4.5.4 Excess of nuclear SFR obtained from 70 µm over SFR from mid-infrared
in-dicators . . . 99 4.5.5 Comparison with other works . . . 99 4.5.6 Inspection of the candidates to significant nuclear 70 µm AGN emission . . . . 100 4.5.7 MIR and FIR emission of the candidates to significant nuclear 70 µm AGN
emission . . . 101 4.6 Summary and conclusions . . . 102 5 A statistical investigation of clumpy torus model predictions in the MIR 105
Contents xxv
5.1 Motivation . . . 105 5.2 Sample and MIR ground based observations . . . 106 5.3 DeblendIRS decomposition . . . 111 5.3.1 The method . . . 111 5.3.2 Comparison with direct measurements on the spectra . . . 117 5.4 MIR properties of AGN . . . 120 5.4.1 AGN MIR spectral index and strength of the silicate feature . . . 120 5.4.2 MIR AGN fractional contribution within the slit . . . 121 5.4.3 Relation with host galaxy properties . . . 122 5.4.4 AGN rest-frame 12 µm luminosities . . . 122 5.4.5 Statistical comparison for different Seyfert types and other AGN . . . 124 5.5 Statistical comparison with the CAT3D clumpy torus models . . . 127 5.5.1 Brief description of the models . . . 127 5.5.2 CAT3D predictions for the MIR emission . . . 131 5.5.3 Comparison between old and new model predictions and observations . . . 137 5.5.4 Constraining the CAT3D torus model parameters . . . 144 5.6 Summary and conclusions . . . 147
6 Conclusions and future work 151
6.1 AGN candidates selected by 24 µm variability . . . 151 6.2 The nuclear and integrated FIR emission of Seyfert galaxies . . . 152 6.3 A statistical investigation of clumpy torus model predictions in the MIR . . . 153
A Outputs of deblendIRS 155
List of Figures
1.1 Schematic representation of an AGN SED . . . 2 1.2 Schematic representation of the AGN unified model . . . 8 1.3 An example of a spectroscopic diagnostic diagram . . . 11 1.4 IR spectrum of the Circinus galaxy . . . 13 1.5 Schematic representation of the AGN torus models . . . 15 1.6 Volume filling factor vs. optical depth for clumpy torus models . . . 16 2.1 Spitzertelescope diagram . . . 20 2.2 Example of the MIPS 24 µm PSF . . . 21 2.3 Herscheltelescope diagram . . . 22 2.4 Example of the PACS PSF . . . 23 2.5 Photometer beams for SPIRE . . . 24 2.6 Atmospheric IR windows . . . 25 2.7 The VISIR instrument . . . 26 2.8 The CanariCam instrument . . . 27 3.1 Epochs in the GOODS-South field . . . 32 3.2 FoV of Epochs 1, 3, 6, and 7 . . . 33 3.3 FoV of Epochs 1, 2, 3, and 4 in the GOODS-North field . . . 33 3.4 Scatter of the fluxes of the sources in epoch 1 . . . 36 3.5 Observed χ2distributions . . . 37 3.6 KS-test for the long-term data . . . 38 3.7 KS-test for the short-term data . . . 38 3.8 Location of the MIPS 24 µm variable sources in GOODS-South . . . 40 3.9 MIPS 24 µm images of the long-term variable candidate ID:5109 . . . 41 3.10 MIPS 24 µm images of the long-term variable candidate ID:5086 . . . 41 3.11 MIPS 24 µm images of the short-term variable candidate ID:7513 . . . 41 3.12 MIPS 24 µm images of the short-term variable candidate ID:7921 . . . 42 3.13 Distribution of the 24 µm mean flux . . . 42 3.14 Light curves of MIPS 24 µm long-term variable sources . . . 46 3.15 Light curves of MIPS 24 µm short-term variable sources . . . 48 3.16 Distributions of the maximum to minimum flux ratio, Rmax . . . 51
3.17 Var= fmax− fmin
¯
f × 100 as a function of the MIPS 24 µm mean flux for variable sources . 52
3.18 IRAC colour-colour plot of MIPS 24 µm sources in GOODS-South . . . 53 3.19 IRAC colour-colour plot of MIPS 24 µm variable sources in the E-CDFS, plotted
ac-cording to their redshift . . . 56 3.20 Rest-frame monochromatic 24 µm luminosity as a function of the redshift for the
vari-able sources in the E-CDFS . . . 60 xxvii
List of Figures xxviii
3.21 The q= log( f24 µm/ f1.4 GHz) ratio versus the redshift . . . 62
4.1 Sample comparison . . . 68 4.2 Mosaics of the galaxies . . . 69 4.3 Distribution of the measured FWHM at 70 µm in kpc . . . 79 4.4 Distribution of the ratio between nuclear and total flux at 70 µm . . . 79 4.5 Distribution of the fν(70 µm)/ fν(160 µm) flux ratios . . . 82 4.6 Colour-colour diagrams . . . 84 4.7 Best fits to the FIR SEDs . . . 86 4.8 Distribution of the fitted dust emissivity indices β . . . 89 4.9 Dust temperature obtained through the grey body fitting . . . 90 4.10 Fits to the integrated galaxies SEDs with β= 2 . . . 91 4.11 Distribution of the 70 µm integrated flux excesses . . . 93 4.12 Nuclear SFR from the 70 µm luminosity versus the 11.3 µm PAH SFR . . . 94 4.13 Extranuclear 70 µm SFR versus extranuclear 24 µm SFR . . . 94 4.14 fν(70 µm)/ fν(160 µm) flux ratio versus the EW of the PAH . . . 96
4.15 70 µm excess versus the EW of the PAH . . . 99 4.16 Spitzer/IRS SL+LL spectra normalized at 30 µm of the six candidates to significant
nuclear 70 µm AGN emission . . . 102 5.1 Distribution of the luminosity distance . . . 110 5.2 Distribution of the slit width . . . 111 5.3 Spectra . . . 112 5.4 Examples of the output of deblendIRS . . . 116 5.5 Comparison of deblendIRS output for galaxies observed with two different instruments 117 5.6 deblendIRS results versus measurements from spectrum . . . 119 5.7 AGN MIR spectral index and strength of the silicate feature versus b/a . . . 122 5.8 AGN rest-frame 12 µm luminosities distribution . . . 123 5.9 Comparison of the 12 µm rest-frame luminosities . . . 124 5.10 Differences in the 12 µm rest-frame luminosities versus the strength of the silicate . . . 125 5.11 Combined probability distribution functions of the AGN MIR spectral index . . . 125 5.12 Combined probability distribution functions of the strength of the silicate feature . . . 126 5.13 Combined probability distribution functions of the AGN fractional contribution . . . . 127 5.14 Representation of the CAT3D clumpy torus parameters . . . 128 5.15 Representation of the dusty clumpy torus . . . 129 5.16 Example of old clumpy torus SEDs . . . 132 5.17 Example of new models SEDs showing ten random distributions of clouds . . . 133 5.18 Strength of the silicate feature against the MIR spectral index for the CAT3D models . 134 5.19 Strength of the silicate feature against the MIR spectral index for the CAT3D models
with the common parameters . . . 138 5.20 Strength of the silicate feature against the MIR spectral index for the CAT3D models,
colour coded in terms of the escape probability, and the Seyfert galaxies . . . 142 5.21 Inclination of host galaxy (b/a) for Seyfert 2 and 1.8/1.9 galaxies and the outliers . . . 143 5.22 Combined probability distributions of the AGN MIR spectral index and the strength of
the silicate feature . . . 143 5.23 Strength of the silicate feature against the MIR spectral index for the CAT3D models,
colour coded in terms of the escape probability, and the combined PDF of the Seyfert galaxies . . . 145
List of Figures xxix
5.24 As Fig. 5.23 but colour coded in terms of a, and the size proportional to N0 . . . 145
5.25 As Fig. 5.23 but colour coded in terms of θ0, and the size proportional to N0 . . . 146
List of Tables
1.1 Classification of AGN. . . 4 3.1 MIPS 24 µm observing programmes in GOODS cosmological fields. . . 31 3.2 MIPS 24 µm source counts for the different epochs. . . 34 3.3 Catalog of the long-term variable candidates. . . 43 3.4 Catalog of the short-term variable candidates. . . 44 3.5 Properties of the MIPS 24 µm variable sources. . . 51 3.6 Properties of MIPS 24 µm variable candidates in the E-CDFS. . . 55 3.7 MIPS 24 µm variable sources identified with other AGN criteria. . . 58 3.8 Summary of fractions in the deepest X-ray region within the CDFS (∼115 arcmin2). . . 59 3.9 Summary of fractions of MIPS 24 µm variable sources selected as AGN by other criteria. 61 4.1 Galaxy sample. . . 67 4.2 Summary of the statistical properties of our sample and comparison samples. . . 72 4.3 Herschel/PACS and SPIRE observing programs. . . 74 4.4 FWHMs measured in the six FIR bands. . . 77 4.5 Aperture photometry for r= 1 kpc. . . 78 4.6 Aperture photometry for r= 2 kpc. . . 80 4.7 Integrated photometry . . . 81 4.8 Contribution of the nuclear regions of r= 1 kpc and 2 kpc to the total flux at 70 µm in
RSA Seyferts . . . 82 4.9 Comparison of the observed fν(70 µm)/ fν(160 µm) flux ratios for different samples . . 83
4.10 Results from grey body fits. . . 88 4.11 Statistical information for the modified black body fits. . . 89 4.12 Summary of criteria to select galaxies with a significant AGN contribution at 70 µm. . 98 5.1 Summary of sample properties . . . 108 5.2 Summary of MIR spectroscopic observations . . . 109 5.3 Statistics for Figs. 5.1 and 5.2. . . 110 5.4 deblendIRS results for the galaxy sample. . . 115 5.5 Direct measurements on the spectra. . . 118 5.6 Statistics of the deblendIRS results. . . 121 5.7 Statistics of the combined probability distributions . . . 126 5.8 Parameters of the CAT3D clumpy torus models. . . 130
Chapter 1
Introduction
1.1
Active Galactic Nuclei
Supermassive black holes (SMBH, MSMBH>106M ) are believed to exist in the centre of all galaxies
containing a significant bulge component (Kormendy and Richstone 1995). Furthermore, the bulge properties, such as the stellar mass and the velocity dispersion, are correlated with the black hole mass (Magorrian et al. 1998; Marconi and Hunt 2003; H¨aring and Rix 2004). From these relations one may deduce that the bulges of the galaxies and the SMBH evolve together, probably mutually regulating each other, or at least, sharing formation and growing mechanisms (see Alexander and Hickox 2012 for a review).
The first piece of evidence that some galaxies host a strongly emitting component in their centre was found by Seyfert (1943). He studied spectra of six galaxies showing nuclear emission lines superposed on a normal star-like spectrum. He also noticed that some galaxies showed broad emission lines (Full Width at Half Maximum, FWHM & 1000 km s−1) while others only showed narrow emission lines (FWHM. 1000 km s−1). Since then, the study of active galaxies started.
In some galaxies, the SMBH is quiet, but in some of them the SMBH is growing. The latter phe-nomenon is revealed in a variety of ways and it is generally referred to as active galactic nucleus or AGN. It is a very energetic phenomenon that occurs in the central region of the galaxies and can-not be due to star formation. The luminosity in the central region can be thousands of times higher than the host galaxy, with the bolometric luminosity for the AGN ranging from 1041 to 1048erg s−1. The AGN luminosity is emitted in all the electromagnetic spectrum, often peaking in the ultravio-let, but with significant emission in X-rays and infrared (IR). For comparison, a normal galaxy has a bolometric luminosity of 6 1042erg s−1, with a large fraction of their luminosity being emitted in the visible and/or IR. The only exception are luminous and ultraluminous IR galaxies (LIRGs and ULIRGs, LIR = 1011− 1012L and 1012− 1013L ). The majority of these galaxies in the local
Uni-verse contains an AGN but at least in the case of LIRGs the AGN does not dominate the bolometric 1
Chapter 1. Introduction 2
Figure 1.1: Top: Average SED for three different types of AGN. Bottom: Schematic representation of the SED of a AGN with a possible source for each emission component. Credit: Koratkar and Blaes
(1999) and Manners PhD thesis (2002).
luminosity (Alonso-Herrero et al. 2012a). The focus of this thesis is the IR emission of AGN, which is discussed in more detail in Section 1.5. In this Section we only give a brief description of the contin-uum emission for every wavelength range, from radio to gamma rays. A schematic representation of the Spectral Energy Distribution (SED) of a AGN with a possible source for each emission component is shown in Fig. 1.1. The main wavelength ranges are:
1. Radio emission: Only about 10% of the AGN are radio loud (RL), i.e., the radio to optical flux ratio is high (>10). The radio quiet (RQ) AGN can have radio emission 100 to 1000 times weaker than the RL AGN (see top of Fig. 1.1). The radio emission is a small fraction of the bolometric luminosity for both, the RL and RQ AGN. The radio emission from AGN consists of compact
Chapter 1. Introduction 3
and extended components. For the RL AGN the radio emitting regions are relativistic jets and extended lobes with scales of kpc and Mpc. In the case of the RQ AGN the radio emission comes from the central radio cores with scales of pc. The radio emission can be well described with a power law coming from synchrotron radiation. The radio spectrum is flatter for the radio core emission than for the radio emission of jets.
2. IR emission: The integrated emission of all the IR range (1 − 1000 µm) is typically 30% of the bolometric luminosity. The IR continuum shows a broad IR bump (see top of Fig. 1.1) between ∼ 1 − 200 µm with the minimum around 1 µm. The IR emission can be thermal and/or non-thermal depending on the AGN type and the spectral range. In RL AGN, the same synchrotron emission process producing the radio continuum is the predominant source of IR emission. For the RQ AGN there are multiple thermal components, such as thermal radiation from the nuclear material obscuring the AGN central engine, the so-called dusty torus (see Section 1.3 and dashed red line of Fig. 1.1), thermal dust continuum and features associated with star formation as well as additional line emission emanating from molecular, atomic, and ionic species (see Section 1.5 for more details).
3. Optical/UV emission: The most noticeable feature in this range mostly seen in type 1 AGN (see below for a definition) is the big blue bump (BBB) in the optical/UV spectra of AGN. This BBB peaks at around 1000 Å, and dominates the spectra at wavelengths shorter than ∼4000 Å. The BBB usually corresponds to the peak of AGN luminosity and can account for up to ∼50% of the bolometric luminosity. The relative strengths of the IR bump and the BBB vary from galaxy to galaxy but they are generally comparable. This BBB feature is attributed to some kind of thermal emission in the range around 104− 106K, believed to be emission from a heated accretion disk surrounding the SMBH (dot-dot-dashed blue line of Fig. 1.1). The optical spectrum shows strong broad permitted emission lines in type 1 AGN as well as narrow forbidden and permitted emission lines superposed on the continuum.
4. X-ray emission: The accretion disk surrounding the black hole is believed to produce a thermal spectrum in X-rays. Inverse Compton scattering of the low-energy disk photons by the relativis-tic electrons located in the inner part of the accretion disk (corona, see Section 1.3) produces the X-ray emission (dashed green line of Fig. 1.1). It can be approximated to a power law with spectral index of 0.8 − 1 from energies of ∼1 keV to over 100 keV. There is also a bump above the power-law continuum between ∼ 7 − 60 keV, peaking at ∼30 keV. This bump is explained as reflection of the X-ray continuum in the accretion disk (dot-dashed blue line of Fig. 1.1). 5. γ-ray emission: γ-ray emission has not been detected in the majority of the AGN, but some
RL AGN, known as Blazars, emit most of their bolometric luminosity above 100 MeV. They are characterised by a non-thermal continuum spectrum, a flat radio spectrum, strong variability and optical polarisation.
Chapter 1. Introduction 4
Table 1.1: Classification of AGN.
Radio AGN type Subtype X-ray Broad Narrow γ-rays?
classification obscured? Balmer lines? Balmer lines?
RQ Seyfert Seyfert 1 <10% X X x Seyfert 2 >90% x X x NLS1 <10% X X Few LINER type 1 x X X x type 2 X x X x Quasar type 1 x X X x type 2 X x X x RL
Radio galaxy FR I x Some X x
FR II x Some X x
Quasar type 1 x X X Some
type 2 X x X x
Blazar FSRQ x X X X
BL Lacs x x x X
1.2
AGN classification
The classification of AGN is very complex because the physical differences between different types of AGN are not clear. Historically, RL and RQ AGN have been classified in a different way. Whereas the RL AGN are classified according to their optical spectral properties and their radio morphology, the RQ AGN are classified according to their optical spectral properties and their luminosity. Therefore, the first main AGN classification depends on the radio emission. The parameter used to divide the galaxies into RL and RQ is called radio-loudness and is defined as:
R= f5 GHz f4400 Å !
(1.1)
where f5 GHzis the monochromatic radio flux at 5 GHz and f4400 Å is the monochromatic optical flux
centred at 4400 Å. An object is classified as RL when R > 10, and RQ when R < 10. Thus, an object which is radio-quiet is not necessary radio-silent, it can show radio emission. RL sources represent only about ∼10% of all the AGN. Here, we describe briefly some of the most relevant AGN types as they are usually classified in the literature, and we summarize their main properties in Table 1.1.
• RQ AGN:
– Seyfert galaxies
Seyfert galaxies were the first AGN identified as active. The host galaxy has a typical galactic spectrum while the central region has highly ionized emission lines, including
Chapter 1. Introduction 5
forbidden lines. This is the criterion used nowadays to identify Seyfert galaxies, if the spectrum shows these highly ionised emission lines, it qualifies it as Seyfert.
Khachikian and Weedman (1974) studied the spectra of Seyfert galaxies and found two dif-ferent types of optical spectra. Whereas all spectra showed narrow highly ionized emission lines, only some of them showed broad lines. They separated the Seyfert galaxies into two classes (Seyfert 1 and Seyfert 2) depending on the relative widths of narrow (forbidden) lines and Balmer lines (FWHM& 1000 km s−1for type 1 AGN and FWHM. 1000 km s−1
for type 2 AGN). Seyfert 1 galaxies have broader Balmer lines (Hα, Hβ, Hγ) than the forbidden lines, like the [Oii]λ3727, [Oiii]λλ4959,5007, [Nii]λλ6548,6584, [Neiii]λ3869, [Neiv]λ2439 lines. Furthermore, the Balmer lines have a broad and a narrow component. Conversely, Seyfert 2 galaxies show both, the Balmer and the forbidden lines with the same narrow width. Osterbrock (1977) introduced the intermediate types of Seyfert according to the Balmer lines characteristics. Seyfert 1.2 galaxies have typical broad Balmer lines, as Seyfert 1, but the Hβ line is slightly less broad. Seyfert 1.5 galaxies have Hβ lines in which the broad and the narrow component are equally strong. Seyfert 1.8 galaxies show some broad component in the Balmer lines and Seyfert 1.9 galaxies only show a broad Hα line while the Hβ line is narrow. There is another subset of Seyfert 1 galaxies, called narrow-line Seyfert 1 galaxies (NLS1). They are strong X-ray emitters with broad Hα narrow-lines and narrow Hβ lines (FWHM(Hβ) < 2000 km s−1), similar to Seyfert 1.9 galaxies. The NLS1 also have a ratio ([Feii]λ4570/Hβ) twice as high as the other Seyfert types.
For Seyfert galaxies a combination of emission from the host galaxy and the active nucleus is observed. In general, in Seyfert 2 galaxies the AGN nucleus is less dominant with respect to the host galaxy than for Seyfert 1 galaxies. For this reason it is more difficult to find Seyfert 2 galaxies based on their optical spectra (Moran et al. 2002). Conversely, Seyfert 1 galaxies show in general a strong continuum, without the characteristic stellar absorption lines, which cannot be attributed to the host galaxy.
– LINER
LINERSs (Low-Ionisation Nuclear Emission-line Region) are low-luminosity AGN. They are the most numerous type of AGN in the local Universe (Ho et al. 1997). They were first identified by Heckman (1980), who arbitrarily defined a LINER as an object in which [Oii]λ3727 is at least as strong as [Oiii]λ5007 and [Oi]λ6300 is at least one third as strong as [Oiii]λ5007. This definition is nearly equivalent to those of Veilleux and Osterbrock (1987), who defined the division between Seyferts and LINERS at [Oiii]λ5007/Hβ = 3. Therefore, LINERs can show [Oiii]λ5007/Hβ < 3, unlike Seyfert galaxies. Gonz´alez-Mart´ın et al. (2009) found that about 60% of the LINERs could host AGN cores emitting in the 4.5 − 8 keV band. Adding multiwavelength information they showed that about 80% of the objects have evidence of harbouring an AGN. In LINERs it is often difficult to detect the AGN because the host galaxy contributes a large amount to the observed
Chapter 1. Introduction 6
emission (Gonz´alez-Mart´ın et al. 2014). However, Gonz´alez-Mart´ın et al. (2015) showed that about 60% of the LINERs have their mid-IR (MIR, ∼ 5−50 µm) spectra not dominated by starburst. They also found that the average spectrum of AGN-dominated LINERs is different from the other optical classes, showing a rather flat continuum in the range 6 − 28 µm.
– Quasars
Quasars were discovered in the late 1950s and early 1960s in large radio surveys (Schmidt 1963). Many of the strong radio sources appeared in optical images like blue stars, so they were called quasi stellar objects (QSO) or quasars. Although the first quasars were found in radio surveys, the majority of the quasars found in optical surveys do not present strong radio emission, with approximately 90% of quasars being RQ AGN. Quasars have spectra similar to those of Seyfert galaxies, therefore they are divided into type 1 and type 2 depending of the presence (or absence) of broad emission lines. Quasars are brighter than Seyfert galaxies and are at higher redshifts. The division between quasars and Seyfert galaxies is arbitrary and depends on the luminosity. Seyfert galaxies with absolute B-magnitude MB< −23 mag are referred to as quasars (Schmidt and Green 1983).
• RL AGN:
– Radio galaxies
Radio galaxies are RL AGN in which the central region is hidden but show bright radio jets and large radio luminosities. They can be divided in two groups according to their radio morphology and luminosity: the low-luminosity Fanaroff-Riley class I (FR-I) and the high-luminosity Fanaroff-Riley class II (FR-II). The FR-I galaxies show compact radio emission and their radio surface brightness profiles decrease outwards, while FR-II galaxies are dominated by radio lobes and their radio surface brightness profiles increase outwards as they reach the end of the extended structures (Fanaroff and Riley 1974). Both, FR-I and FR-II optical spectra are similar to those of Seyfert galaxies. Those with a Seyfert 2 optical spectrum are called narrow-line radio galaxies (NLRG) and those with broad optical-UV lines are called broad-line radio galaxies (BLRG).
– RL Quasars
The RL quasars were the first quasars to be discovered. Although they are only about 10% of the quasars, they are easier to detect due to their strong radio emission. As RQ quasars, their optical spectrum is similar to those of Seyfert galaxies and are therefore divided into type 1 and type 2.
– Blazars
Blazars are a special subclass of RL quasars, in which a relativistic jet is pointing very close to the line of sight of the observer. They have high variability and emit from radio
Chapter 1. Introduction 7
frequencies to very high energies. Their emission is variable in all the electromagnetic spectrum in time scales from years to hours. Blazars are divided into BL Lac objects and Flat Spectrum Radio Quasars (FSRQ). BL Lac objects do not have prominent features in the optical spectrum, so the equivalent width (EW) of emission lines is used as an arbitrary dividing line between the two types of Blazars.
1.3
The Unified Model
In the previous section a great variety of AGN types have been presented, but all of them are believed to share the same basic phenomena at their centres. To explain this diversity of AGN, Antonucci (1993) proposed the first unification model. In the most simplified picture, there are basically two types of AGN: RL and RQ. A range of luminosities is observed for each type, allowing the distinction between Seyferts and quasars. All other observational differences are explained by orientation effects. Therefore, the differences between type 1 and type 2 AGN and the intermediate types are explained as a continuum transition in the viewing angle from 0° to 90°.
The unification between RQ and RL AGN was made by Urry and Padovani (1995). They included the relativistic jet, so the AGN radio emission depends on the inclination angle between the observer to the jet. Fig. 1.2 represents the AGN unified model, with the principal components and the type of AGN depending on the viewing angle. The principal components of the AGN unified model are:
• SMBH
It is accepted that the main engine of an AGN is an accreting SMBH with mass > 106M at
the centre of the host galaxy. As AGN are compact, extremely luminous and often variable, the only plausible mechanism that can provide a highly efficient conversion of potential and kinetic energy to radiation is accretion of material onto a SMBH.
• Accretion disk
The matter orbiting and falling onto the SMBH forms a geometrically thin and optical thick ac-cretion disk. The matter falls converting the potential and kinetic energy to radiation via viscous dissipation. The accretion disk emits thermal radiation in the optical/UV range, producing the BBB. The approximate inner radius of the accretion disk is at ∼ 0.01 − 60 astronomical units (AU) from the SMBH centre and the outer disk radius is at ∼ 1 − 1000 AU.
• Corona
Over the inner parts of the accretion disk, there is a corona of very energetic electrons that is responsible for the inverse Compton scattering of the thermal photons emitted from the disk. This results in the X-ray power law emission (see Section 1.1).
Chapter 1. Introduction 8
Figure 1.2: Schematic representation of the AGN unified model. The type of AGN depends on the viewing angle, whether or not the AGN produces a significant jet emission, and how powerful the
central engine is. Credit: Marie-Luise Menzel.
• Broad line region (BLR)
The BLR is the region where broad permitted emission lines observed in the optical/UV and near-IR (NIR, ∼ 1 − 5 µm) ranges arise from. It is formed of clouds of gas in photoionization equilibrium, with turbulent motions. The large Doppler broadening observed in the permitted lines is due to the deep gravitational potential of the SMBH, with gas velocities of order of 103to a few 104km s−1. The size of the BLR can be estimated by reverberation mapping of the broad lines, with typical sizes of ∼ 0.01 − 1 pc. The absence of broad forbidden lines indicates that the gas density has to be > 109cm−3.
• Torus
Outside the BLR there is an obscuring dust structure with a toroidal geometry that extends from 1 to 100 pc, in a similar plane as the accretion disk. It contains both, cold gas and dust. The torus provides anisotropic obscuration of the central engine, blocking the BLR and the accretion
Chapter 1. Introduction 9
disk for high viewing angles (directions close to the equatorial plane of the torus), whereas for low inclinations (close to the polar direction of the torus) the observer has an unobscured view of the central engine. The dust reprocesses the optical/UV radiation from the accretion disk via absorption and re-emission, and it is responsible for the major part of the nuclear MIR emission and for part of the far-IR (FIR, ∼ 50 − 1000 µm) continuum observed in AGN. In Chapter 4 we investigate the AGN contribution to the FIR. See Section 1.6 for information about the different torus models available in the literature.
• Narrow line region
The NLR is the region where the narrow permitted and forbidden lines in the optical/UV NIR and MIR ranges come from. The gas clouds have less turbulence than those in the BLR. The velocities of the clouds are ∼ 400 − 500 km s−1. The presence of forbidden and permitted lines is indicative of lower densities than the BLR (103− 105cm−3). The narrower widths and the lack of variability of the emission lines indicates that they arise from a region that is much larger and kinematically separate from that of the broad lines (∼ 102− 104pc).
• Relativistic jet
Certain subclasses of AGN present relativistic jets emanating from the sub-parsec scales of the AGN. They are believed to be extremely energetic and collimated outflowing plasma structures launched from the accretion disk that can extend up to hundreds of kpc. These jets occur in about 10% of the AGN (the RL AGN), and are responsible for the radio emission in the RL AGN.
The dusty torus is the essential component to explain the orientation dependence on the unified model. Its first direct detection was made with ALMA in the Seyfert 2 NGC 1068 (Garc´ıa-Burillo et al. 2016). In type 1 AGN the viewing angle is near to the polar direction of the torus, so the central engine is directly visible and the BLR can be seen (see Fig. 1.2). On the other hand, type 2 AGN are viewed edge-on, so the torus hides the central engine and the BLR, and therefore only narrow lines are present in the optical spectrum. The relativistic jet explains the differences between RQ and RL AGN. Those AGN with jet emission are RL AGN, while those with no jet are RQ AGN.
The first hint of the unified model was given by Antonucci and Miller (1985). They studied NGC 1068 and discovered that although in the direct optical light it only showed narrow emission lines when ob-served in polarized light it also showed broad Balmer lines. The proposed explanation is that although the BLR is hidden by the torus, the light can be scattered towards the line of sight of the observer, and these scattered photons are polarized. Other studies have confirmed the presence of hidden broad lines in type 2 AGN (see Moran et al. 2000; Ramos Almeida et al. 2016 and references therein). The IR band is another way to find hidden broad lines in type 2 AGN, as this spectral range is less affected by obscuration. The inferred optical depths from the IR correspond to the expected optical extinction (Ward et al. 1991).
Chapter 1. Introduction 10
However, there are observations that deviate from this unified model. Not all Seyfert 2 galaxies show a hidden type 1 nucleus even when observed in polarized light (Bianchi et al. 2008; Tran 2001, 2003). Studies with 8 m telescopes and good S/N have reduced significantly the number of Seyfert 2 galaxies without a hidden Seyfert 1 nucleus (Ramos Almeida et al. 2016). One explanation for Seyfert 2 galaxies without hidden broad lines is that the central engine has a low power, so it cannot illuminate sufficiently the BLR. This also can be used as explanation of why BL Lac objects do not show emission lines. According to the unified model, type 2 AGN should be X-ray absorbed, but there are examples of type 2 AGN with no absorption in X-rays, like NGC 3147 and NGC 4698 (Pappa et al. 2001), and for example the works of Corral et al. (2011) and Mateos et al. (2005). They can be due to the same effect as the Seyfert 2 galaxies without a hidden type 1 nucleus. The intrinsic power of the AGN is low so there might be only a weak BLR.
Another challenge for the unified model is the anticorrelation between the fraction of absorbed sources and the luminosity in hard X-rays surveys (Beckmann et al. 2009). This can be explained introducing the luminosity as a parameter in the unified model.
All these examples that deviate from the simplest unified model highlight the importance of adding the AGN intrinsic properties, such as the SMBH mass, its spin, the accretion rate, and the host-galaxy morphological type.
1.4
AGN identification
AGN present a large range of observational features, such as emission lines, variability, IR excess, strong X-ray emission, and strong radio emission. Not all AGN show all the features, so having an efficient, reliable and complete AGN selection technique is very difficult. The methods are also different for local AGN, where it is possible to have nuclear images and spectroscopy, than from those in cosmological fields, where most AGN appear unresolved. We describe briefly the different methods to select AGN.
Conventionally, the most direct and used method to identify AGN has been optical spectroscopy. As explained previously, AGN can be identified through the presence of broad emission lines (FWHM & 1000 km s−1, type 1 AGN) or the detection of narrow emission lines characteristic of AGN ion-ization (FWHM . 1000 km s−1, type 2 AGN). Another method is by line intensity ratios in diag-nostic diagrams, such as [Oiii]λ5007/Hβ vs [Nii]λ6583/Hα. Baldwin et al. (1981) demonstrated that it is possible to distinguish type 2 AGN from normal star-forming galaxies using line intensity ra-tios. Veilleux and Osterbrock (1987) also used line diagnostics based on emission line ratios to de-rive a semi-empirical classification between AGN and star-forming galaxies. Using the same diag-nostic diagrams Kewley et al. (2001) derived new theoretical boundary regions to classify LINERs and to separate AGN from starburst. Later Kauffmann et al. (2003) defined an empirical dividing
Chapter 1. Introduction 11
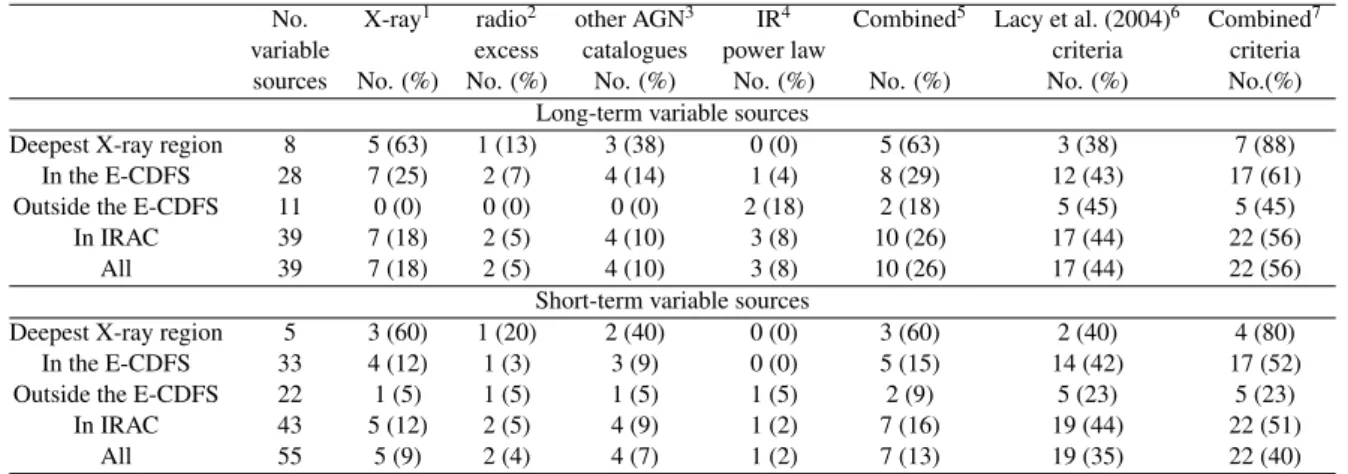
Figure 1.3: An example of a spectroscopic diagnostic diagram using the [Oiii]/Hβ ratio versus [Nii]/Hα ratio. The dashed curve shows the dividing line of Kauffmann et al. (2003) while the dotted line is the dividing line defined by Kewley et al. (2001). Seyfert galaxies are often defined to have [Oiii]λ5007/Hβ > 3 and [Nii]λ6583/Hα > 0.6, while LINERs are defined to have [Oiii]λ5007/Hβ < 3
and [Nii]λ6583/Hα > 0.6. Credit: Kauffmann et al. (2003)
line below the line drawn by Kewley et al. (2001) and Stasi´nska et al. (2006) proposed other divi-sion line between the AGN and the star-forming galaxies, close to the one defined by Kauffmann et al. (2003) and proposed a new diagnostic diagram for the galaxies up to z = 1.3. The underly-ing idea of these diagrams is that the emission lines in normal star-formunderly-ing galaxies are emitted by Hii regions, ionized by massive stars, while AGN are ionized by a harder radiation field. Therefore, for a given [Oiii]λ5007/Hβ or [Oiii]λ5007/[Oii]λ3727 ratio, galaxies containing an AGN will show higher [Oii]λ3727/Hβ, [Nii]λ6583/Hα, [Sii]λλ6717,6731/Hα, or [Oi]λ6300/Hα ratios than normal star-forming galaxies. Fig. 1.3 shows an example of a line ratio diagnostic diagram where it is plotted the emission line flux ratio [Oiii]λ5007/Hβ versus [Nii]λ6583/Hα. The dashed and dotted curves show the dividing lines of Kauffmann et al. (2003) and Kewley et al. (2001), respectively. Unfortunately, spec-troscopy of a large number of objects is very expensive in terms of observing time, especially for faint sources in cosmological fields. Furthermore, AGN lines can be obscured and/or swamped by emission from the host galaxy (Moran et al. 2002).
AGN in cosmological fields are routinely identified by their X-ray emission (Alexander et al. 2003; Brandt and Hasinger 2005). The standard threshold used to select AGN is a hard X-ray luminosity L2−10 keV > 1042erg s−1. This is based on the fact that the X-ray spectra of star-forming galaxies are
Chapter 1. Introduction 12
of an AGN and does not need additional observations at other wavelengths to confirm it. Although X-ray surveys provide the most complete AGN samples, they miss the most obscured AGN needed to fit the cosmic X-ray background integrated energy density (Gilli et al. 2007). Another method to identify AGN in cosmological fields is by their radio emission. It is known that a tight correlation exists between FIR and radio emission for star-forming galaxies (Helou et al. 1985; Appleton et al. 2004). Thus, an excess of radio emission over the expected relation is produced by an AGN, often obscured by large amounts of dust and gas (Donley et al. 2005; Del Moro et al. 2013). As this method depends only of the FIR and radio emission, AGN that are missed at other wavelengths can be detected. The AGN detection through radio emission also presents biases, as only about 10% of the AGN are RL, and in general there is little overlap between radio and IR/X-ray selected AGN (Hickox et al. 2009). In the last years many AGN searches have been done in the NIR and MIR, allowing to identify AGN whose optical emission is obscured by dust. Whereas star-forming galaxies have their NIR SEDs dominated by the 1.6 µm stellar bump, galaxies containing an AGN have a power-law emission in the NIR. For this reason the Spitzer IRAC NIR and MIR bands (3.6, 4.5, 5.8, and 8.0 µm) have been used to identify AGN (Lacy et al. 2004, 2013; Stern et al. 2005; Alonso-Herrero et al. 2006; Donley et al. 2007, 2008, 2012). The Wide-field IR Survey Explorer (WISE) bands (3.4, 4.6, and 12 µm) have also been used to select AGN (Mateos et al. 2012; Stern et al. 2012; Assef et al. 2013). These IR selection methods are only complete for the most luminous AGN (e.g., Donley et al. 2012), but they are likely to select obscured AGN not detected in X-rays (Mateos et al. 2013).
Variability can also be used to select AGN. Practically all AGN vary on time-scales from hours to millions of years (Ulrich et al. 1997; Hickox et al. 2014). Any variability detected in galaxies on human time-scales must originate in the nuclear region, because the typical timescale for star formation variability is ≥ 100 Myr (Hickox et al. 2014). In particular low-luminosity AGN are expected to show stronger variability than the luminous ones (Trevese et al. 1994). Therefore, variability is likely to be an effective method to select low-luminosity AGN. Although the mechanisms that produce variability are not well understood, the main explanations involve disk instabilities (Pereyra et al. 2006) or changes in the amount of accreting material (Hopkins and Beacom 2006).
All these methods of AGN selection are complementary and each one can detect sources other methods miss. It is therefore important to study the same region of the sky with different methods of AGN selection. In Chapter 3 we use MIR 24 µm variability as a method to identify AGN in a cosmological field.
1.5
IR emission of active galaxies
The IR emission of active galaxies not only is due to the AGN but also to the host galaxy. In RL AGN the predominant source of IR emission is the synchrotron emission process, which occurs when
![Figure 1.3: An example of a spectroscopic diagnostic diagram using the [Oiii]/Hβ ratio versus [Nii]/Hα ratio](https://thumb-us.123doks.com/thumbv2/123dok_es/6858187.284723/43.893.278.667.126.513/figure-example-spectroscopic-diagnostic-diagram-oiii-ratio-versus.webp)