The Relationship between NMR Chemical Shifts of Thermally Polarized and
Hyperpolarized
89Y Complexes and Their Solution Structures
Yixun Xing
a, Ashish K. Jindal
b, Martín Regueiro-Figueroa
c, Mariane Le Fur
d, Nelly Kervarec
e,
Piyu Zhao
a, Zoltan Kovacs
b, Laura Valencia
f, Paulo Pérez-Lourido
f, Raphaël Tripier
d, David
Esteban-Gómez
c, Carlos Platas-Iglesias
c, and A. Dean Sherry
a,ba Department of Chemistry, University of Texas, Dallas, Richardson, Texas, USA
b Advanced Imaging Research Center, University of Texas Southwestern Medical Center, Dallas, Texas, USA
c Centro de Investigaciones Científicas Avanzadas (CICA) y Departamento de Química Fundamental, Facultade de
Ciencias, Universidade da Coruña, A Coruña, Galicia, Spain
d Université de Bretagne Occidentale, UMR-CNRS 6521, UFR des Sciences et Techniques, Brest Cedex 3, France
e
Plateforme de RMN-RPE, Université de Bretagne Occidentale, UMR-CNRS 6521, UFR des Sciences et Techniques, Brest Cedex 3, France
f Departamento de Química Inorgánica, Facultad de Ciencias, Universidade de Vigo, Pontevedra, Spain
Chemistry - A European Journal Volume 22, Issue 46, pages 16657–16667, November 7, 2016
Issue online: 2 November 2016, Version of record online: 10 October 2016, Manuscript Received: 17 June 2016
This is the peer reviewed version of the following article:
Xing, Y., Jindal, A. K., Regueiro-Figueroa, M., Le Fur, M., Kervarec, N., Zhao, P., Kovacs, Z., Valencia, L., Pérez-Lourido, P., Tripier, R., Esteban-Gómez, D., Platas-Iglesias, C., Sherry, A. D. (2016), The
Relationship between NMR Chemical Shifts of Thermally Polarized and Hyperpolarized 89Y Complexes and Their Solution Structures. Chem. Eur. J., 21: 16657–16667.
which has been published in final form at https://doi.org/10.1002/chem.201602901. This article may be used for non-commercial purposes in accordance with Wiley Terms and Conditions for Self-Archiving.
Abstract
Recently developed dynamic nuclear polarization (DNP) technology offers the potential of increasing the NMR sensitivity of even rare nuclei for biological imaging applications. Hyperpolarized 89Y is an ideal candidate because of its narrow NMR linewidth, favorable spin quantum number (I= ), and long longitudinal relaxation times (T1). Strong NMR signals were detected in hyperpolarized
89
Y samples of a variety of yttrium complexes. A dataset of 89Y NMR data composed of 23 complexes with polyaminocarboxylate ligands was obtained using hyperpolarized 89Y measurements or 1H,89Y-HMQC spectroscopy. These data were used to derive an empirical equation that describes the correlation between the 89Y chemical shift and the chemical structure of the complexes. This empirical correlation serves as a guide for the design of 89Y sensors. Relativistic (DKH2) DFT calculations were found to predict the experimental 89Y chemical shifts to a rather good accuracy.
Introduction
Magnetic resonance imaging (MRI) is a technique widely used in medical diagnosis that is based on the same fundamental principles as NMR spectroscopy. Traditional MRI scanners detect the NMR signal of water proton nuclei present in the body, with image contrast being achieved by using adequate pulse sequences that take advantage of differences in proton densities and longitudinal and transverse relaxation times among tissues.[1] MRI provides 3D images of the body with very high resolution, but it is traditionally regarded as a rather insensitive technique.[2] In an external magnetic field B0, the extent to which a nuclear
spin becomes polarized is described by:[3]
𝑃 =
(𝑁(𝑁++−𝑁−)+𝑁−) (1)
where N+ and N− denote the number of nuclear spins parallel (spin up) and anti-parallel (spin down) with respect to B0. The polarization at Boltzmann equilibrium (P0) is given by:
[4]
𝑃
0= tanh (
𝛾ℎ𝐵02𝑘B𝑇
) ≈
𝛾ℎ𝐵0
2𝑘B𝑇 (2)
where γ is the gyromagnetic ratio of the nucleus under study, kB is the Boltzmann constant, and other
symbols have their usual meaning. Equation (2) shows that spin polarization increases with field, so the tendency has been for human MRI scanners to move to higher fields over the years to gain sensitivity. Eventually, this becomes cost-prohibitive, so alternative ways to increase NMR sensitivity are being explored. One method is to use hyperpolarized (HP) materials that exist, at least temporarily, in a non-equilibrium hyperpolarized state where (N+–N−) is increased several orders of magnitude over thermal equilibrium. Dynamic nuclear polarization (DNP), one of the more popular methods to produce hyperpolarized materials, has been used to amplify the sensitivity of 13C and 15N nuclei to a level where common metabolites can be imaged by MRI. For example, 13C polarization levels as high as 50 % have been achieved using DNP at low temperatures and high fields.[5] The experimental method involves doping the 13C material with a stable free radical such as trityl or nitroxide, freezing the sample in a solvent that forms a glass, and irradiating the sample with continuous microwave irradiation at a frequency close to the corresponding electron resonance frequency.
Recently we reported the use of DNP methods to hyperpolarize a variety of 89Y complexes.[6-9] In nature, yttrium exists 100 % as the stable isotope 89Y. The predominant chemical form of yttrium is the diamagnetic, trivalent ion, Y3+. 89Y has a much smaller nuclear magnetic moment than 13C, so its NMR sensitivity is only 0.668 relative to 13C.[10] Consequently, it is quite difficult and time-consuming to acquire an 89Y NMR spectrum at Boltzmann spin levels except for highly concentrated samples. However, 89Y3+ has a nuclear spin quantum number of I= and exhibits narrow NMR linewidths and long longitudinal relaxation times (T1),
Scheme 1. Complexes with macrocyclic ligands investigated in this work.
Only a single 89Y NMR report existed before 1970, which is most likely due to the extremely low NMR sensitivity of this nucleus.[15] In the late 1970s the first T1 values for some
89
Y complexes were found to be unusually long.[16] In 2007, three 89Y complexes, Y-DOTP, Y-DOTA, Y-DTPA, along with YCl3 were
hyperpolarized using DNP methods and NMR signals were obtained on complexes at concentrations of only 5–15 mm after a single scan.[6] The enhanced signals showed that yttrium complexes could be polarized to levels reasonable for imaging. Furthermore, the various 89Y complexes displayed a wide range of chemical shifts. This observation in combination with the long relaxation times of these complexes makes them potentially attractive as probes for various physiological parameters such as pH or redox environment. This preliminary study triggered our interest in conducting hyperpolarization experiments on a broader range of 89Y complexes. We report herein 89Y NMR spectra of both thermally polarized and hyperpolarized samples of the diverse group of Y3+ complexes shown in Scheme 1 and Scheme 2. Subsequently, density functional theory (DFT) calculations were conducted to better understand the factors that affect the observed 89Y NMR chemical shifts and eventually establish empirical correlations between NMR chemical shifts and the number and types of donor atoms in each complex, which might serve as a guide for designing new 89Y complexes as biosensors.
Results and Discussion
Structure of the Y3+ complexes
Establishing a correlation between the observed 89Y NMR chemical shifts and the coordination environment around the metal ion requires an accurate determination of the structure of the concerned complexes in solution. Given the similar coordination properties of Y3+ and the lanthanide ions (Ln3+) we sought to expand the family of structurally characterized Y3+ complexes by taking advantage of our recent studies on Ln3+ complexes. Thus, we have included in our studies a series of macrocyclic-based ligand complexes, [Y(Me2DO2PA)]+, [Y(CB-TE2PA)]+, [Y(P2C14Et4)]3+, [Y(P2C14Py4)]3+, and [Y(BP18C6)]+ (Scheme 1), where the structures of the corresponding Ln3+complexes have been established by X-ray diffraction in the solid state and/or by analysis of the Ln3+-induced paramagnetic 1H NMR shifts in aqueous solution.[17-25] The X-ray structure obtained using single crystals with formula [Y(P2C14Et4)](NO3)3⋅6H2O confirm that the
[Y(P2C14Et4)]3+ complex retains the ten-coordinate structure observed for the Ln3+ series along the whole lanthanide series (Figure 1).[20, 25] Similarly, the [Y(Me2DO2PA)]+ and [Y(CB-TE2PA)]+ complexes adopt eight-coordinate structures in the solid state very similar to those established for the corresponding complexes with the Ln3+ ions (Figure 2 and Figure 3).[18, 19, 21] The family of Y3+ complexes with macrocyclic ligands investigated in this work also includes [Y(DOTA)(H2O)]−, [Y(DOTAM)(H2O)]
3+
and [Y(DO3 A)(H2O)2]. The structure of [Y(DOTA)(H2O)]− in the solid state has been established by X-ray
diffraction,[26, 27] while the structure of Ln3+ complexes of these ligands have been also investigated both in the solid state and in solution.[28-33] The Gd3+ complex of DO3A was shown to be present in solution as a hydration equilibrium involving an eight-coordinated [Gd(DO3A)(H2O)] complex and a nine-coordinated
bis-hydrated [Gd(DO3A)(H2O)2] complex. The speciation in solution was found to be dominated by the
bis-hydrated form, which results in an overall hydration number of 1.8–1.9 at 25 °C.[34, 35]
The chemical formula of all Y3+ complexes with non-macrocyclic ligands included in this study are shown in Scheme 2. The number of inner-sphere water molecules in some of the complexes was assigned on the basis of available crystallographic data and solution studies performed on the Ln3+analogues ([Y(EGTA)(H2O)]−,[36, 37] [Y(DTPA)(H2O)]2−,[38] [Y(TTHA)]3−[39]). In other cases the complexes present
variable hydration numbers in the solid state so the exact number of water molecules coordinated to Y3+ cannot be predicted in a straightforward manner. For instance, the sodium salt of [Y(EDTA)(H2O)3]− was
found to contain three coordinated water molecules, while the structurally related [Y(DCTA)(H2O)2]− complex was reported to be bis-hydrated in the solid state.
[40]
water molecules in these complexes was assessed by using DFT calculations, which provided theoretical 89Y NMR shifts using different plausible coordination numbers. The comparison of experimental and calculated shifts allowed an unequivocal assignment of the hydration state (see below). Most ligands included in this study are known to form 1:1 complexes with the trivalent Ln3+ions, except for NT A3− and NTP A3−, which can form both 1:1 and 1:2 complexes, or HID A2−
and IMD A2−, which form 1:2 and 1:3 complexes, respectively.[10]
Figure 1. View of one of the complex cations present in crystals of [Y(P2C14Et4)](NO3)3⋅6 H2O. Water molecules,
anions and hydrogen atoms (except those of the hydroxy groups) have been omitted for simplicity. Bond distances [Å]: Y1–O1 2.435(2), Y1–O2 2.442(2), Y1–N1 2.562(2), Y1–N2 2.628(3), Y1–N3 2.657(3).
Figure 2. View of one of the complex cations present in crystals of [Y(CB-TE2PA)](PF6)⋅2.5H2O. Water molecules,
anions and hydrogen atoms have been omitted for simplicity. Bond distances [Å]: Y1–O1 2.275(4), Y1–O3 2.259(4), Y1–N1 2.590(5), Y1–N2 2.526(5), Y1–N3 2.607(5), Y1–N4 2.520(4) Y1–N5 2.459(5), Y1–N6 2.470(5).
Figure 3. View of one of the complex cations present in crystals of [Y(Me2DO2PA)](PF6)⋅2H2O. Water molecules,
89
Y NMR chemical shifts
89
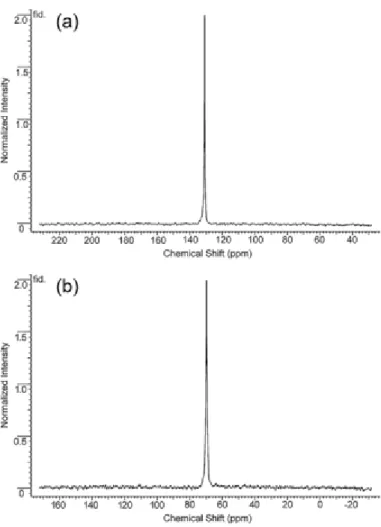
Y NMR spectra of hyperpolarized samples of Y3+-EDTA and Y3+-EGTA are illustrated in Figure 4. These spectra demonstrate that one can obtain high-quality 89Y NMR spectra relatively easily. The 89Y chemical shifts of seven complexes measured on hyperpolarized samples are listed in Table 1. Thermally polarized 89Y spectra have been reported previously for Y3+-(DTPA), Y3+-EGTA, Y3+-(NTA)2, Y
3+
-EDTA, and Y3+-TTHA, and their chemical shifts agree well with those measured from spectra of hyperpolarized samples.[10, 41]
Figure 4. NMR spectraof hyperpolarized a) Y3+-EDTA (6.1 mM) and b) Y3+-EGTA (7.7 mM) at pH 7.4 collected at 9.4
T using a single 20° pulse.
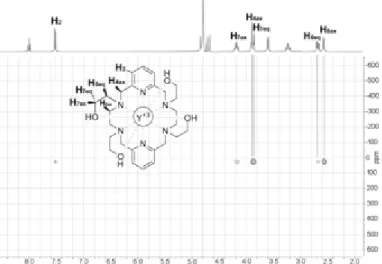
Another set of 89Y NMR shifts was obtained using 1H,89Y heteronuclear shift correlation through scalar coupling (1H,89Y-HMQC). This technique allows a much faster acquisition compared with conventional pulse-acquisition 89Y NMR measurements, which are very time-consuming owing to the long T1relaxation
times of 89Y (Table 1). 1H,89Y-HMQC spectroscopy allows an indirect 1H detection of 89Y, thereby overcoming this problem.[42] The representative example of the 1H,89Y-HMQC spectrum of [Y(P2C14Et4)]3+ is shown in Figure 5. Several cross-peaks relating the 89Y NMR signal of the complex at 25.7 ppm and aliphatic protons of the ligand situated at a three-bond distance are observed. A weak correlation involving the pyridyl proton H2, situated four bonds away the metal ion, is also evident. The strongest correlations involve H4ax, H5ax, H7eq, and H7ax, which according to the X-ray crystal structure
present H-C-N-Y or H-C-O-Y dihedral angles of 80.6, 78.4, 104.1, and 136.9°. However, no cross-peaks are observed in the case of protons H4eq ad H5eq, which are characterized by dihedral angles of 162.2 and 163.5°.
relationship, as observed for the 1H scalar coupling constants responsible for the contact shifts induced by paramagnetic Ln3+ ions.[19]
Table 1.89Y chemical shifts and T1 values for seven hyperpolarized Y3+ complexes.[a]
Y3+ complex Concentration [mM] Chemical shift [ppm] T1 [s]
EGTA 7.7 68.6 474±13
(NTA)2 7.2 73.0 534±118
DTPA 6.2 76.0 227±5
DO3 A 7.2 103.5 247±91
EDTA 6.1 133.5 310±4
DOTA 12.5 111.3 446±7
TTHA 7.7 96.9 245±90
103.2 230±14
[a] Circa 0.2 M samples dissolved in H2O/glycerol (3:1) plus 15 mM OX63 were frozen at 1.4 K and polarized for 3
h in an Oxford DNP HyperSense system. The samples were quickly dissolved in a buffer and transferred to a 10 mm NMR tube for data collection using a 9.4T magnet. 89Y spectra were collected using 20° pulses every 20 s over a period of 300–600 s and the resulting data were fitted to standard decay curve for polarized samples. All chemical shifts are reported relative to YCl3 set to 0 ppm.
The 89Y NMR chemical shift data of the complexes investigated in this work are compiled in Table 2. The yttrium chemical shifts of our data set composed of 23 polyamino-polycarboxylate complexes vary over 270 ppm. Particularly surprising are the shifts of [Y(Me2DO2PA]+ (245.8 ppm) and [Y(CB-TE2PA)]+(218.5 ppm) and the negative chemical shift of [Y(BP18C6)]+ (−23.6 ppm), which expand the 89Y NMR chemical shift range of polyaminocarboxylate complexes by about 200 ppm with respect to the window of 89Y NMR shifts reported previously (ca. 70 ppm).[10, 41]
Table 2. Measured chemical shifts and predicted chemical shifts from (3) of Y3+ complexes with the numbers of coordinated amine nitrogen atoms (nNam), pyridine nitrogen atoms (nNpy), carboxylate oxygen atoms (nOc), ether oxygen
atoms (nOe), amide oxygen atoms (nOa), and water oxygen atoms (nOw). [a]
Y3+ complex δexp (ppm) δcalc(ppm) nNam nNpy nOc nOe nOh nOa nOw
[Y(DOTA)(H2O)]− (1) 111.3 107.0 4 0 4 0 0 0 1
[Y(DOTAM)(H2O)]3+(2) 123.0[b] 125.1 4 0 0 0 0 4 1
[Y(DO3 A)(H2O)2] (3) 103.5 93.4 4 0 3 0 0 0 2
[Y(P2C14Et4)]3+ (4) 25.7 29.8 4 2 0 0 4 0 0
[Y(P2C14Py4)]3+ (5) 78.6 76.0 4 6 0 0 0 0 0
[Y(DOTA-(gly)4)(H2O)] −
(6) 121.6 125.1 4 0 0 0 0 4 1
[Y(DOTAM-2C)(H2O)]− (7) 120.9 125.1 4 0 0 0 0 4 1
[Y(DOTAM-3C)(H2O)]− (8) 118.7 125.1 4 0 0 0 0 4 1
[Y(DOTAM-5C)(H2O)]− (9) 117.8 125.1 4 0 0 0 0 4 1
[Y(Me2DO2PA)]+ (10) 244.7 231.0 4 0 0 0 0 0 0
[Y(CB-TE2PA)]+ (11) 218.5 231.0 4 0 0 0 0 0 0
[Y(BP18C6)]+ (12) -23.6 -15.3 2 0 0 4 0 0 0
[Y(TTHA)]3− (13) 103.2 120.6 4 0 5 0 0 0 0
[Y(IMDA)3]3− (14) 98.7[c] 94.7 3 0 6 0 0 0 0
Y3+ complex δexp (ppm) δcalc(ppm) nNam nNpy nOc nOe nOh nOa nOw
[Y(EDTA)(H2O)2]−(16) 133.5, 129.6[c] 135.7 2 0 4 0 0 0 2
[Y(DCTA)(H2O)2]−(17) 132.7[c] 135.7 2 0 4 0 0 0 2
[Y(HEDTA)(H2O)2] (18) 78.6[c] 76.0 2 0 3 0 1 0 3
[Y(DPTA)(H2O)2] −
(19) 130.0[c] 135.7 2 0 4 0 0 0 2
[Y(EGTA)(H2O)]− (20) 68.6, 69.4,[d]68.5[c] 52.0 2 0 4 2 0 0 1
[Y(HIDA)2]− (21) 57.0[c] 48.6 2 0 4 0 2 0 1
[Y(NTA)2]3− (22) 73.0, 76.5[c] 162.8 2 0 6 0 0 0 0
55.2 2 0 6 0 0 0 1
[Y(NTPA)2]3− (23) 90.5[c] 162.8 2 0 6 0 0 0 0
55.2 2 0 6 0 0 0 1
[Y(NTA)] (24) 62.6[c] 82.5 1 0 3 0 0 0 4
−25.1 1 0 3 0 0 0 5
[Y(NTPA)] (25) 44.0[c] 82.5 1 0 3 0 0 0 4
−25.1 1 0 3 0 0 0 5
[Y(H2O)8]3+ (26) 0.0 2.5 0 0 0 0 0 0 8
[a] SNam=68.1±6.4, SNpy=85.7±5.4, SOc=94.0±5.8, SOe=95.7±4.9, SOh=97.3±4.9, SOa=89.5±5.4, SOw=107.6±6.2. [b] Data
from Ref. [45]. [c] Data from Ref. [10]. [d] Thermally polarized data (this work).
if one makes the same assumption that each ligand nitrogen atom contributes equally and each oxygen atom contributes equally to the 89Y chemical shift, the 89Y chemical shifts of some of the yttrium(III) complexes listed in Table 2 are rather poorly predicted. An inspection of the 89Y chemical shift data reported in Table 2 shows that generally ten-coordinated complexes (that is, [Y(BP18C6)]+ and [Y(P2C14Et4)]3+) give signals at higher fields, while the 89Y resonances of eight-coordinate complexes are more deshielded and nine-coordinated complexes give signals in an intermediate range. Furthermore, the replacement of inner-sphere water molecules in [Y(EDTA)(H2O)2]− for ligands with different oxygen donor atoms as lactate affects
drastically the value of the 89Y NMR chemical shift (Supporting Information, Figure S8). This supports the use of different shielding constants for ligands having oxygen donor atoms of water, hydroxy, or carboxylate groups. In the other hand, the 89Y NMR chemical shifts measured for thermally polarized samples of complexes [Y(DOTAM-2C)]−, [Y(DOTAM-3C)]−, and [Y(DOTAM-5C)]− are very similar to that of [Y(DOTA-(gly)4)]−(Table 2; Figure S9, Supporting Information). The varying lengths of the four side chains
of the ligand have an effect on the inversion of the population of the twisted-square antiprismatic (TSAP) and square antiprismatic (SAP) diastereomers. Therefore, it turns out that chemical shifts are mainly dependent of contribution from the coordinated atoms rather than other structural factors. Thus, we attempted to fit the experimental 89Y NMR data to an empirical relationship of the form:
𝛿
calc( Y
89) = 𝐴 − (S
number of donor atoms of each class. The use of different shielding constants for similar donor atoms such as amide or carboxylate oxygen atoms is justified by the different chemical shifts observed for [Y(DOTA)(H2O)]− (111 ppm) and [Y(DOTAM)(H2O)]
3+
(123 ppm),[45] which indicate that oxygen atoms of carboxylate groups provide a slightly more important contribution to the shielding of the 89Y NMR resonance than amide oxygen atoms. The best fit of the data provided A=863±48 ppm and the shielding constants reported in Table 2.
The shielding effect of an amine nitrogen atom (SNam=68.1 ppm) is considerably smaller than that of pyridyl
nitrogen atoms (SNpy=85.7 ppm). Oxygen donor atoms of organic ligands provoke rather similar shielding
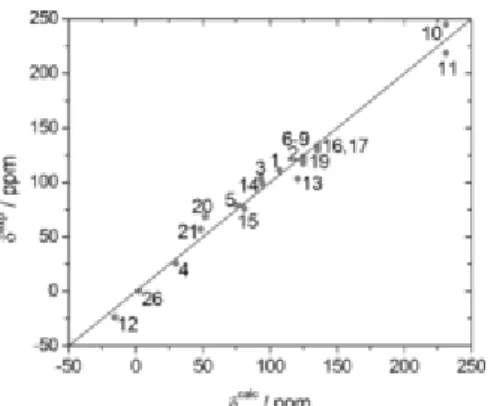
effects (94.0–97.3 ppm), while the shielding contribution of water molecules in significantly higher (SOw=107.6 ppm). Figure 6 shows a plot of experimental versus calculated
89
Y NMR shifts obtained with Equation (3) for 21 complexes. The shifts of NTA3− and NTPA3− complexes were found to deviate considerably from the predicted values, and were omitted from Figure 6. The reasons for this discrepancy are likely related to the presence of hydration equilibria in solution, as discussed below. Nevertheless, the error between the calculated versus experimental data for the 21 complexes is relatively small (±6.9 ppm).
Given the good agreement between the observed and calculated 89Y NMR shifts for most systems, the noticeable deviations from the experimental and calculated data of [Y(NTA)2]3− and [Y(NTPA)2]3− are
intriguing. In the case of [Y(NTA)2]3−, Equation (3) predicts a shift of 55.2 ppm assuming the presence of a
coordinated water molecule and 162.8 ppm if the complex lacks inner-sphere water molecules. The experimental shift (73.0 ppm) is closer to the value calculated for the q=0 species. In the case of [Y(NTPA)2]3− the donor atoms of the ligands are identical to those of [Y(NTA)2]3−, leading to the same
calculated values. However, the experimental value is quite different (90.5 ppm). We interpret these data in terms of hydration equilibria involving a non-hydrated species and a complex species containing one coordinated water molecule. The calculated 89Y NMR shifts suggest that the major species in solution corresponds to the hydrated complex, the population of the q=0 species being estimated as circa 15 and 30 % for [Y(NTA)2]3− and [Y(NTPA)2]3−, respectively. Similar hydration equilibria involving complex species
containing four- and five-coordinated water molecules are probably present in solutions of the [Y(NTA)] and [Y(NTPA)] complexes (Table 2).
Figure 6. Plot of experimental 89Y chemical shifts versus those predicted by Equation (3). The straight line is the identity line.
The [Y(TTHA)]3− complex presents at least two species in solution at about neutral pH, as two signals at 103.2 ppm and 96.9 ppm are observed in the hyperpolarized 89Y NMR spectrum at pH 6.9 (Table 1). The Ln3+ complexes of TTHA6− form different structures in the solid state depending upon the size of the metal ion.[46] The smallest Ln3+ ions form nine-coordinated complexes through binding of four amine nitrogen atoms and five oxygen atoms of carboxylate groups, the remaining carboxylate unit remaining
uncoordinated. For the largest Ln3+ ions, ten-coordinate species were observed in the solid state thanks to the coordination of the four amine nitrogen atoms and the six carboxylate oxygen atoms. Additionally, dinuclear [Ln2(HTTHA)2]4− species containing nine-coordinated metal ions were also reported, with the metal
coordination environment being fulfilled by three amine nitrogen atoms, four carboxylate groups of one of the ligands, and two carboxylate groups of a neighboring ligand unit. The chemical shift values calculated with Equation (3) for the nine- and ten-coordinated [Y(TTHA)]3− species are 120.6 ppm and 26.6 ppm, respectively. The calculated value for the dinuclear [Ln2(HTTHA)2]
4−
species is 94.7 ppm. The latter value is in excellent agreement with the NMR signal observed at 96.9 ppm. Thus, most likely the Y3+-TTHA
complex is present in solution as a mixture of a mononuclear and a dinuclear species, giving 89Y NMR signals at 103.2 and 96.9 ppm, respectively. A minor amount of ten-coordinate [Y(TTHA)]3− species might be responsible for the 17.5 ppm difference between the experimental and calculated shifts of [Y(TTHA)]3−.
DFT calculations
Aiming to have a deeper insight on the origin of the 89Y NMR chemical shifts observed for
polyaminocarboxylate complexes, we turned our attention to theory. Prior to calculation of 89Y NMR chemical shifts using DFT methods, we first performed geometry optimizations of 16 Y3+ complexes with polyaminocarboxylates using the TPSSh functional and a quasirelativistic pseudopotential that includes the inner 28 electrons in the core (see computational details below). For those complexes containing coordinated water molecules, we explicitly included two second-sphere water molecules hydrogen-bonded to each coordinated water molecule, as the inclusion of second-sphere water molecules was found to be critical for an accurate calculation of Gd3+−Owater distances and
17
polyaminocarboxylates.[47, 48] The optimized geometries of all Y3+ complexes together with the calculated bond distances of the Y3+ coordination environments are shown in the Supporting Information, Figures S10, S11). The quality of the optimized structures was assessed by comparison of the calculated bond distances of the metal coordination environment with crystallographic data (Supporting Information, Tables S1–S3).
Since Y3+ is a relatively heavy atom, relativistic effects are expected to play an important role on the 89Y NMR shifts.[49] Thus, the absolute shielding constants were obtained using relativistic DFT calculations at the TPSSh/DKH2/TZVP level. A plot of the isotropic nuclear shielding values (σiso) versus the observed
89
Y NMR shifts provides a rather good linear correlation (Figure 7). Furthermore, the chemical shifts obtained using the σiso value calculated for [Y(H2O)8]
3+
are also in reasonable agreement with the experimental values (Table 3). Besides, these calculations allowed us to assess the hydration number of those complexes for which the number of coordinated water molecules was uncertain. One of such cases is [Y(DO3A)(H2O)q],
for which the 89Y NMR shift calculated for the bis-hydrated complex (103.4 ppm, Table 3) is virtually identical to the experimental one (103.5 ppm). In contrast, the mono-hydrated complex yields a calculated chemical shift of 181.8 ppm, a value that deviates by about 78 ppm from the experimental one. For [Y(EDTA)(H2O)q]
−
, the DFT calculations predict 89Y NMR shifts of 20.5 and 119.4 ppm for the tris- and bis-hydrated forms, the latter value being in reasonably good agreement with the experimental one (135.7 ppm). However, for [Y(NTA)2(H2O)q]3− the chemical shifts calculated for both the q=1 (24.3 ppm) and q=0
(101.8 ppm) species deviate considerably from the experimental value (73.0 ppm), suggesting that a hydration equilibrium exists in solution involving a mono- and a bis-hydrated species. The presence of hydration equilibria in solution was ascertained using absorption spectroscopy for different Eu3+ complexes, and therefore it is likely that some Y3+complexes will show similar behavior.[50, 51]
Figure 7. Plot of the experimental 89Y NMR shifts versus the isotropic nuclear shielding values calculated in aqueous solution (COSMO) at the TPSSh/DKH2/TZVP level.
The calculated σiso values provide a rather good linear correlation with the calculated electron density at the
Y3+ nucleus (Supporting Information, Figure S12). The σiso values can be broken down into the diamagnetic
(σd) and paramagnetic (σp) contributions, which were obtained using each nucleus as the gauche origin for separation (Table 3).[52] The diamagnetic contribution arises from the magnetic field at the nucleus produced by the diamagnetic current density caused in the electrons by the external magnetic field.[53] Excluding the aquated ion, for the series of complexes listed in Table 3 the diamagnetic contribution varies by up to about 169 ppm. The σd values calculated for the complexes with polyaminocarboxylate ligands are larger than that calculated for [Y(H2O)8]
3+
effect (Supporting Information, Table S4). The natural electron configurations reveal significant changes in the 5s and 4d populations depending upon the metal coordination environment. The 5s populations are relatively small and vary from 0.162 for [Y(EDTA)(H2O)2]− to 0.186 for [Y(IMDA)3]3−, while the calculated
4d populations present values in the range 0.82–1.08. The 5p populations are smaller (<0.014) than the 5s and 4d populations, as would be expected. Plots of the diamagnetic shielding contribution versus the calculated 4d, 5s, and 5p populations (Supporting Information, Figure S13) reveal linear trends that indicate increasing shielding effects upon increasing the population of the Y3+ valence orbitals.
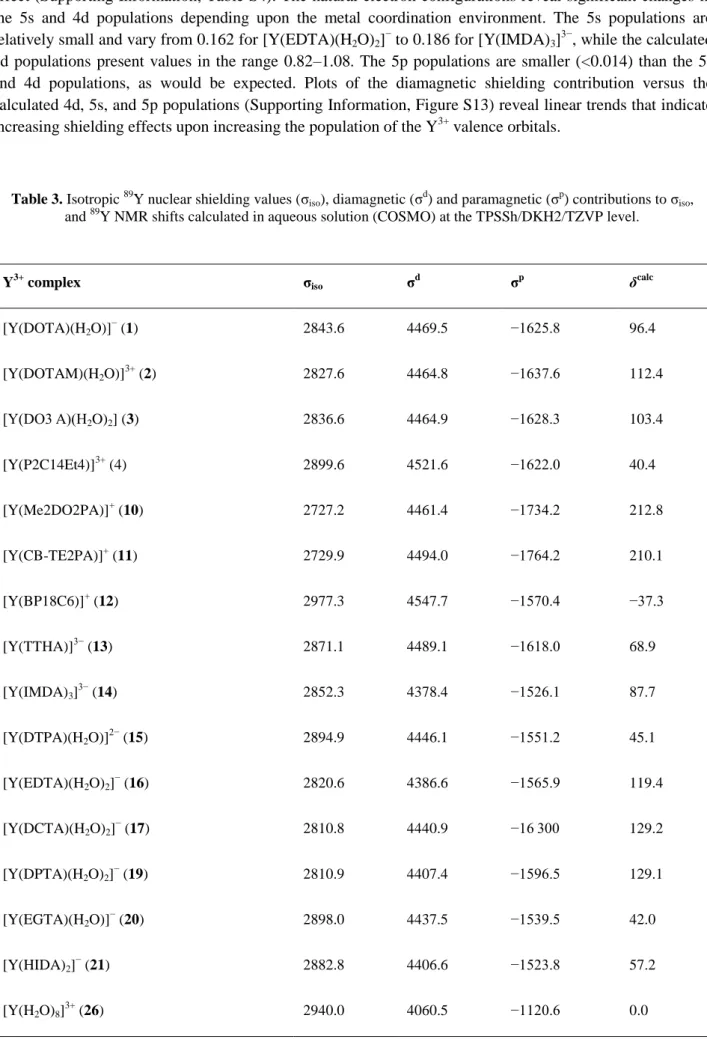
Table 3. Isotropic 89Y nuclear shielding values (σiso), diamagnetic (σd) and paramagnetic (σp) contributions to σiso,
and 89Y NMR shifts calculated in aqueous solution (COSMO) at the TPSSh/DKH2/TZVP level.
Y3+ complex σiso σd σp δcalc
[Y(DOTA)(H2O)]− (1) 2843.6 4469.5 −1625.8 96.4
[Y(DOTAM)(H2O)] 3+
(2) 2827.6 4464.8 −1637.6 112.4
[Y(DO3 A)(H2O)2] (3) 2836.6 4464.9 −1628.3 103.4
[Y(P2C14Et4)]3+ (4) 2899.6 4521.6 −1622.0 40.4
[Y(Me2DO2PA)]+ (10) 2727.2 4461.4 −1734.2 212.8
[Y(CB-TE2PA)]+ (11) 2729.9 4494.0 −1764.2 210.1
[Y(BP18C6)]+ (12) 2977.3 4547.7 −1570.4 −37.3
[Y(TTHA)]3− (13) 2871.1 4489.1 −1618.0 68.9
[Y(IMDA)3] 3−
(14) 2852.3 4378.4 −1526.1 87.7
[Y(DTPA)(H2O)]2− (15) 2894.9 4446.1 −1551.2 45.1
[Y(EDTA)(H2O)2]− (16) 2820.6 4386.6 −1565.9 119.4
[Y(DCTA)(H2O)2]− (17) 2810.8 4440.9 −16 300 129.2
[Y(DPTA)(H2O)2]− (19) 2810.9 4407.4 −1596.5 129.1
[Y(EGTA)(H2O)] −
(20) 2898.0 4437.5 −1539.5 42.0
[Y(HIDA)2]− (21) 2882.8 4406.6 −1523.8 57.2
The paramagnetic contribution accounts for the mixing of certain excited states with the electronic ground state in the presence of a magnetic field. The calculated σp values for complexes with polyaminocarboxylate ligands are more negative than that obtained for [Y(H2O)8]
3+
, indicating that the paramagnetic contribution results in a deshielding effect in the family of Y3+ complexes investigated here. The σp term generally becomes more important as the HOMO–LUMO gap is reduced (Supporting Information, Figure S14). This is expected as smaller HOMO–LUMO gaps tend to decrease the energy differences between all occupied and unoccupied orbitals.[54]
Conclusion
This study has shown that Y3+ complexes with polyaminocarboxylate ligands provide a rather wide range of 89Y NMR chemical shifts that spans about 270 ppm, an expansion by about 200 ppm of the chemical shift range observed previously. The 89Y NMR chemical shifts can be obtained either using hyperpolarized samples or 1H,89Y-HMQC NMR experiments to overcome the long acquisition times required for traditional 89Y NMR experiments owing to the long relaxation times. The 89Y NMR chemical shift values were found to change considerably depending upon the coordination number of the complex and the nature of the donor atoms of the ligand. A relativistic DFT study was conducted to rationalize the origin of the 89Y NMR chemical shifts. These calculations can predict the observed chemical shifts to a rather good accuracy. The breakdown of the calculated isotropic shielding constants revealed that the calculated 89Y NMR chemical shifts are a subtle balance of the two contributions. Generally increased 4d, 5s, and 5p populations and large HOMO–LUMO gaps have a shielding effect on the 89Y chemical shifts. However, these general trends do not allow a prediction of the chemical shifts without performing the DFT calculations. Thus, we proposed an empirical relationship that provides calculated chemical shifts to an accuracy of about ±6.9 ppm with respect to the experimental values. This empirical expression will be useful for the rational design of 89Y NMR imaging probes for hyperpolarized imaging. Furthermore, the 89Y NMR chemical shifts are also useful to gain information on the solution structure of the corresponding complexes with Ln3+ ions.
Experimental Section
General: All chemicals used were of the highest available purity and were not purified further. Solvents used were available commercially and used as received. Yttrium nitrate hexahydrate was obtained from Aldrich. Syntheses performed under microwave radiation were carried out with a Monowave Anton Paar 300 instrument (30 bar/850W). Elemental analyses were performed in a Carlo–Erba EA 1108 microanalyzer. Attenuated total reflection infrared (ATR-FTIR) spectra were recorded on a FP-6100 Jasco spectrometer. ESI-MS experiments of complexes [Y(P2C14Et4)](NO3)3⋅6 H2O and [Y(P2C14Py4)](NO3)3⋅6 H2O were
performed on an microTOF(focus) mass spectrometer (Bruker Daltonics, Bremen, Germany). Ions were generated using an ApolloII (ESI) source and ionization was achieved by electrospray. ESI-MS analyses of the remaining complexes were done either at HT Laboratory (San Diego, CA) or at core facilities at UT Southwestern Medical Center at Dallas. The pH values were direct readings as measured on an Orion 720 A+ (Thermo Corporation, city, state) or an Ultra Basic 5 pH meter (Denver Instruments, city state).
NMR spectroscopy: One-dimensional 1H NMR spectra of compounds [Y(P2C14Et4)](NO3)3⋅6 H2O,
[Y(P2C14Py4)](NO3)3⋅6 H2O, [Y(Me2DO2PA)]Cl, and [Y(CB-TE2PA)]Cl were recorded at 25 °C on a
long-range couplings of 41.66 ms and a 2 s delay for relaxation time. For example, in an HMQC experiment, the raw data set consisted of 48 fid of 1024 (F2) × 98(F1) complex data points, each zero-filled to 1000 in the F1 dimension prior to Fourier transform with a spectral width of 31 846 Hz and 4504 Hz in the F1 and F2 dimensions, respectively. 1H Chemical shifts were expressed in ppm relative to TSP as external reference, in 99.97 % D2O, and TMS for others solvents. 89Y chemical shifts were expressed in ppm relative to yttrium
nitrate hexahydrate 1 m, pH 4.3 as external reference. The one-dimensional 89Y spectrum reference was recorded with a 50 s delay relaxation time, 976 scans, and a spectral window of 5980 Hz. 1H,13C, and thermally polarized 89Y NMR spectra of all other complexes were recorded using a Bruker Avance III 400 MHz spectrometer and a 5 mm sample probe. Hyperpolarized 89Y NMR spectra were collected at a field strength of 9.4 T at 25° on an Oxford unshielded 89 mm magnet with Varian 10 mm low gamma probe. Both hyperpolarized and thermally polarized 89Y NMR spectra were referenced to YCl3 at 0 ppm.
Hyperpolarization experiments: Hyperpolarization of [Y(EDTA)(H2O)2]− (0.158 m),
[Y(EGTA)(H2O)]−(0.200 m), [Y(TTHA)]3− (0.200 m), [Y(NTA)2]3− (0.187 m),
[Y(DTPA)(H2O)2]− (0.160 m), [Y(DOTA)(H2O)]−(0.397 m), and [Y(DO3 A)(H2O)2] (0.187 m) were
generated following a reported method.[7] After 4.16 mL of hyperpolarized [Y(EDTA)(H2O)2]− solution was
ejected from the HyperSense, 1 mL was transferred to a 10 mm NMR tube to acquire the 89Y NMR data. Hyperpolarized 89Y spectra of [Y(TTHA)]3− were collected at pH 4.8 and 6.9 in buffer solutions.
Crystal structure determinations: X-ray diffraction data for compound [Y(P2C14Et4)](NO3)3⋅6 H2O were
collected at 173 K on a Bruker Smart-CCD- 6000 using Cu-Kα radiation. All data were corrected by Lorentz and polarization effects. Empirical absorption corrections were also applied.[55] Complex scattering factors were taken from the program package SHELX-97.[56] The structure was solved by direct methods using SIR-92,[57] which revealed the position of all non-hydrogen atoms. The structure was refined on F2 by a full-matrix least-squares procedure using anisotropic displacement parameters for all non-hydrogen atoms. The hydrogen atoms bonded to carbon atoms were located in their calculated positions and refined using a riding model. For compounds [Y(Me2DO2PA)](PF6)⋅2H2O and [Y(CB-TE2PA)](PF6) 2.5H2O single-crystal X-ray
diffraction data were collected with a Xcalibur 2 CCD 4-circle Diffractometer (Oxford Diffraction) fitted with a graphite monochromated MoKα radiation (λ=0.71073 Å). Data were collected at 170 K and 298 K. Unit cell determination and data reduction, including interframe scaling, Lorentzian, polarization, empirical absorption, and detector sensitivity corrections, were carried out using attached programs of CrysAlis software (Oxford Diffraction).[58] Structures were solved by direct methods and refined by full matrix least-squares method on F 2 with the SHELX L97[56] suite of programs. The hydrogen atoms were identified at the last step and refined under geometrical restraints and isotropic U-constraints.
Crystal data and structure refinement details are given in the Supporting Information, Table S5. CCDC 1484094, 1484140, and 1484139 contain the supplementary crystallographic data for this paper. These data are provided free of charge by The Cambridge Crystallographic Data Centre. Molecular graphics were generated by using USCF Chimera (version 1.8).[59]
appropriate ligand (0.04 mmol) in the same solvent (10 mL). The solution was allowed to concentrate and the crude products were recrystallized in water. By slow concentration of the water solutions, crystalline products were obtained, which were filtered off and air-dried.
[Y(P2C14Et4)](NO3)3⋅6 H2O: Yield: 67 %;
solution of YCl3⋅6 H2O (37 mg, 0.122 mmol) in MeOH (3 mL). The mixture was heated to reflux during 72 h
and then concentrated to dryness. The residue was stirred in CH3CN (2 mL) at room temperature during 24 h.
The precipitate was filtered and rinsed with CH3CN (2 mL) and Et2O (2 mL) to yield 34 mg of a white solid.
Addition of an excess of KPF6 to a solution of the complex gave single crystals suitable for X-ray diffraction
analysis. Yield 71 %; 1
C NMR (125.77 MHz, D2O, pD=7.46, 25 °C): δ=174.22, 158.99, 152.13 (quaternary C); 145.74,
129.87, 127.06 (tertiary C); 58.47, 56.17 (secondary C); 47.76 ppm (primary C).
[Y(CB-TE2 PA)]Cl: This complex was prepared following the previously reported procedure.[21] A mixture containing H2CB-TE2PA⋅4 HCl (50 mg, 0.078 mmol), DIPEA (80 mg, 0.624 mmol), and YCl3⋅6 H2O (47
mg, 0.156 mmol) in n-butanol (10 mL) was heated at 150 °C during 4 h under microwave radiation. The solvent was evaporated and the solid was washed four times with THF. The complex was obtained as a brown solid (28 mg). Addition of an excess of KPF6 to a solution of the complex gave single crystals suitable
for X-ray diffraction analysis. Yield: 58 %; 1H NMR (500 MHz, D2O, pD=5.65, 25 °C): δ=8.21 (t, D2O, pD=5.65, 25 °C): δ=175.80, 159.56, 151.96 (quaternary C); 145.62, 129.08, 126.00 (tertiary C); 71.52,
62.22, 62.10, 60.74, 55.91, 55.62, 26.88 ppm (secondary C).
Computational details: Geometry optimizations were performed in aqueous solution employing DFT within the hybrid meta-GGA approximation with the TPSSh exchange-correlation functional,[61] and the Gaussian 09 package (Revision D.01).[62]
constraints have been imposed during the optimizations. The default values for the integration grid (75 radial shells and 302 angular points) and the SCF energy convergence criteria (10−8) were used in all calculations. The stationary points found on the potential energy surfaces as a result of the geometry optimizations have been tested to represent energy minima rather than saddle points via frequency analysis. Bulk solvent effects (water) were included with the polarizable continuum model using the integral equation formalism (IEFPCM)[65] variant as implemented in Gaussian 09. The universal force field radii (UFF)[66] scaled by a factor of 1.1 were used to define the solute cavities.
The calculations of the 89Y NMR shielding tensors were carried out using the ORCA program package (Version 3.0.1)[67] using the own nucleus as the origin of this gauche origin. Relativistic effects were considered by means of the second order Douglas–Kroll–Hess (DKH2) method,[68] with the all-electron scalar relativistic TZVP-DKH basis set of Pantazis et al. for Y.[69] The geometries of the complexes optimized with the Gaussian code as described above were employed. The RIJCOSX approximation[70] was used to speed up the calculations of NMR parameters using the Def2-TZVPP/JK[71] auxiliary basis set as constructed automatically by ORCA. The convergence tolerances and integration accuracies of the calculations were increased from the defaults using the available TightSCF and Grid5 options. Solvent effects (water) were taking into account by using the COSMO solvation model as implemented in ORCA.[72] Chemical shifts were calculated as δ=(σref−σ) using [Y(H2O)8]
3+
as a reference. Natural electron configurations were obtained with the NBO 6.0 program developed by Weinhold.[73]
Acknowledgements
The authors are indebted to Centro de Supercomputación de Galicia (CESGA) for providing the computer facilities. M.R.-F., D.E.-G., and C.P.-I. thank Ministerio de Economía y Competitividad (CTQ2013-43243-P and CTQ2015-71211-REDT) for generous financial support. R.T. acknowledges the Ministère de l'Enseignement Supérieur et de la Recherche, the Centre National de la Recherche Scientifique, and the “Service Commun” of NMR facilities of the University of Brest. C.P.-I. acknowledges the University of Brest for his invited Professor position. A.D.S. acknowledges financial support from the National Institutes of Health (EB-015908 and CA-115531) and the Robert A. Welch Foundation (AT-584).
[1] a) L. M. De Leon-Rodriguez, A. J. M. Lubag, C. R. Malloy, G. V. Martinez, R. J. Gillies, A. D. Sherry, Acc. Chem. Res. 2009, 42, 948–957; b) E. Terreno, D. D. Castelli, A. Viale, S. Aime, Chem. Rev. 2010, 110, 3019–3042.
[2] a) S. Aime, D. D. Castelli, S. G. Crich, E. Gianolio, E. Terreno, Acc. Chem. Res. 2009, 42, 822–831; b) P. Caravan, Chem. Soc. Rev. 2006, 35, 512–523.
[3] K. Golman, L. E. Olsson, O. Axelsson, M. Mansson, M. Karlsson, J. S. Peterson, Br. J. Radiol. 2003, 76, S118.
[4] B. M. Goodson, Annu. Rep. NMR Spectrosc. 2005, 55, 299–323.
[5] J. H. Ardenkjaer-Larsen, S. Macholl, H. Johannesson, Appl. Magn. Reson. 2008, 34, 509–522.
[6] M. E. Merritt, C. Harrison, Z. Kovacs, P. Kshirsagar, C. R. Malloy, A. D. Sherry, J. Am. Chem. Soc. 2007, 129, 12942–12943.
[8] L. Lumata, A. K. Jindal, M. E. Merritt, C. R. Malloy, A. D. Sherry, Z. Kovacs, J. Am. Chem. Soc. 2011, 133, 8673–8680.
[9] L. Lumata, M. Merritt, C. Malloy, A. D. Sherry, Z. Kovacs, Appl. Magn. Reson. 2012, 43, 69–79.
[10] R. C. Holz, W. D. Horrocks, J. Magn. Reson. 1990, 89, 627–631.
[11] R. D. Shannon, Acta Crystallogr. Sect. A 1976, 32, 751–767.
[12] The Chemistry of Contrast Agents in Medical Magnetic Resonance Imaging, A. E. Merbach, L. Helm, É. Tóth, Eds., 2nd ed., Wiley, New York, 2013.
[13] P. Verwilst, S. Park, B. Yoon, J. S. Kim, Chem. Soc. Rev. 2015, 44, 1791–1806.
[14] C. Popovici, I. Fernández, P. Oña-Burgos, L. Roces, S. García-Granda, F. L. Ortiz, Dalton Trans. 2011, 40, 6691–6703.
[15] E. Brun, J. Oeser, H. H. Staub, C. G. Telschow, Phys. Rev. 1954, 93, 172–173.
[16] a) R. M. Adam, G. V. Fazakerley, D. G. Reid, J. Magn. Reson. 1979, 33, 655–657; b) G. C. Levy, P. L. Rinaldi, J. T. Bailey, J. Magn. Reson. 1980, 40, 167–173.
[17] M. del C. Fernández-Fernández, R. Bastida, A. Macías, P. Pérez-Lourido, C. Platas-Iglesias, L. Valencia, Inorg. Chem. 2006, 45, 4484–4496.
[18] A. Rodríguez-Rodríguez, D. Esteban-Gómez, A. de Blas, T. Rodríguez-Blas, M. Fekete, M. Botta, R. Tripier, C. Platas-Iglesias, Inorg. Chem. 2012, 51, 2509–2521.
[19] A. Rodríguez-Rodríguez, D. Esteban-Gómez, A. de Blas, T. Rodríguez-Blas, M. Botta, R. Tripier, C. Platas-Iglesias, Inorg. Chem. 2012, 51, 13419–13429.
[20] G. Castro, M. Regueiro-Figueroa, D. Esteban-Gómez, R. Bastida, A. Macías, P. Pérez-Lourido, C. Platas-Iglesias, L. Valencia, Chem. Eur. J. 2015, 21, 18662–18670.
[21] A. Rodríguez-Rodríguez, D. Esteban-Gómez, R. Tripier, G. Tircso, Z. Garda, I. Toth, A. de Blas, T. Rodriguez-Blas, C. Platas-Iglesias, J. Am. Chem. Soc. 2014, 136, 17954–17957.
[22] A. Rodríguez-Rodríguez, M. Regueiro-Figueroa, D. Esteban-Gómez, R. Tripier, G. Tircso, F. K. Kálmán, A. C. Bényei, I. Tóth, A. de Blas, T. Rodriguez-Blas, C. Platas-Iglesias, Inorg. Chem. 2016, 55, 2227–2239.
[23] A. Roca-Sabio, M. Mato-Iglesias, D. Esteban-Gómez, É. Tóth, A. de Blas, C. Platas-Iglesias, T. Rodríguez-Blas, J. Am. Chem. Soc. 2009, 131, 3331–3341.
[24] M. Regueiro-Figueroa, D. Esteban-Gómez, A. de Blas, T. Rodriguez-Blas, C. Platas-Iglesias, Chem. Eur. J. 2014, 20, 3974–3981.
[25] G. Castro, M. Regueiro-Figueroa, D. Esteban-Gómez, P. Pérez-Lourido, C. Platas-Iglesias, L. Valencia, Inorg. Chem. 2016, 55, 3490–3497.
[26] C. A. Chang, L. C. Francesconi, M. F. Malley, K. Kumar, J. Z. Gougoutas, M. F. Tweedle, Inorg. Chem. 1993, 32, 3501–3508.
[28] F. Benetollo, G. Bombieri, L. Calabi, S. Aime, M. Botta, Inorg. Chem. 2003, 42, 148–157.
[29] S. Aime, M. Botta, G. Ermondi, Inorg. Chem. 1992, 31, 4291–4299.
[30] S. Amin, D. A. Voss Jr. , W. D. Horrocks Jr., C. H. Lake, M. R. Churchill, J. R. Morrow, Inorg. Chem. 1995, 34, 3294–3300.
[31] S. Aime, A. Barge, F. Benetollo, G. Bombieri, M. Botta, F. Uggeri, Inorg. Chem. 1997, 36, 4287–4289.
[32] S. Aime, M. Botta, M. Fasano, M. P. M. Marques, C. F. G. C. Geraldes, D. Pubanz, A. E. Merbach, Inorg. Chem. 1997, 36, 2059–2068.
[33] F. A. Dunand, R. S. Dichins, D. Parker, A. E. Merbach, Chem. Eur. J. 2001, 7, 5160–5167.
[34] É. Tóth, O. M. N. Dhubhghaill, G. Nesson, L. Helm, A. E. Merbach, Magn. Reson. Chem. 1999, 37, 701–708.
[35] X. Zhang, C. A. Chang, H. G. Brittain, J. M. Garrison, J. Telser, M. F. Tweedle, Inorg. Chem. 1992, 31, 5597–5600.
[36] S. Aime, A. Barge, A. Borel, M. Botta, S. Chemerisov, A. E. Merbach, U. Muller, D. Pubanz, Inorg. Chem. 1997, 36, 5104–5112.
[37] L. Q. Zhang, T. T. Fan, J. Wang, B. Liu, D. Li, G. X. Han, R. Xu, X. D. Zhang, Russ. J. Coord. Chem. 2010, 36, 389–395.
[38] J. A. Peters, Inorg. Chem. 1988, 27, 48486–44691.
[39] J. Wang, D.-M. Fan, X.-D. Zhang, R. Ma, Acta Chim. Sin. 2002, 60, 536–540.
[40] J. Wang, Y. Wang, Zh. H. Zhang, X. D. Zhang, J. Tong, X. Zh. Liu, X. Y. Liu, Y. Zhang, Zh. J. Pan, J. Struct. Chem. 2005, 46, 895–905.
[41] S.-G. Lee, Bull. Korean Chem. Soc. 1996, 17, 589–591.
[42] M. W. Löble, M. Casimiro, D. T. Thielemann, P. Oña-Burgos, I. Fernández, P. W. Roesky, F. Breher, Chem. Eur. J. 2012, 18, 5325–5334.
[43] R. E. White, T. P. Hanusa, Organometallics 2006, 25, 5621–5630.
[44] C. F. G. C. Geraldes, A. D. Sherry, J. Magn. Reson. 1986, 66, 274–282.
[45] P. Mieville, S. Jannin, L. Helm, G. Bodenhausen, J. Am. Chem. Soc. 2010, 132, 5006–5007.
[46] P. Caravan, J. J. Ellison, J. McMurry, B. Lauffer, Chem. Rev. 1999, 99, 2293–2352.
[47] M. Regueiro-Figueroa, C. Platas-Iglesias, J. Phys. Chem. A 2015, 119, 6436–6445.
[48] D. Esteban-Gómez, A. de Blas, T. Rodríguez-Blas, L. Helm, C. Platas-Iglesias, ChemPhysChem 2012, 13, 3640–3650.
[49] J. Autschbach, Philos. Trans. R. Soc. London Ser. A 2014, 372, 20120489.
[51] a) C. Platas-Iglesias, D. M. Corsi, L. Vander Elst, R. N. Muller, D. Imbert, J.-C. G. Benzli, E. Toth, T. Maschmeyer, J. A. Peters, Dalton Trans. 2003, 727–737; b) E. Balogh, M. Mato-Iglesias, C. Platas-Iglesias, E. Toth, K. Djanashvili, J. A. Peters, A. de Blas, T. Rodriguez-Blas, Inorg. Chem. 2006, 45,8719–8728.
[52] a) J. A. Platts, K. Gkionis, Phys. Chem. Chem. Phys. 2009, 11, 10331–10339; b) A. H. Greif, P. Hrobarik, V. Hrobarikova, A. V. Arbuznikov, J. Autschbach, M. Kaupp, Inorg. Chem. 2015, 54, 7199–7208.
[53] J. C. Facelli, Prog. Nucl. Magn. Reson. Spectrosc. 2011, 58, 176–201.
[54] S. Moncho, J. Autschbach, Magn. Reson. Chem. 2010, 48, S76–S85.
[55] G. M. Sheldrick, SADABS. Program for Empirical Absoption Correction of Area Detector Data. University of Götingen, Germany, 1996.
[56] G. M. Sheldrick, SHELX-97, An integrated system for solving and refining crystal structures from diffraction data, University of Göttingen, Germany 1997.
[57] A. Altomare, G. Cascarano, C. Giacovazzo, A. Gualardi, J. Appl. Crystallogr. 1993, 26, 343–350.
[58] CrysAlis software system, version 1.171.28 cycle 4 beta,Oxford Diffraction Ltd, Abingdon, U. K., 2005.
[59] E. F. Pettersen, T. D. Goddard, C. C. Huang, G. S. Couch, D. M. Greenblatt, E. C. Meng, T. E. Ferrin, J. Comput. Chem. 2004, 25, 1605–1612.
[60] M. P. Lowe, D. Parker, O. Reany, S. Aime, M. Botta, G. Castellano, E. Gianolio, R. Pagliari, J. Am. Chem. Soc. 2001, 123, 7601–7609.
[61] J. M. Tao, J. P. Perdew, V. N. Staroverov, G. E. Scuseria, Phys. Rev. Lett. 2003, 91, 146401.
[62] M. J. Frisch, G. W. Trucks, H. B. Schlegel, G. E. Scuseria, M. A. Robb, J. R. Cheeseman, G. Scalmani, V. Barone, B. Mennucci, G. A. Petersson, et al. Gaussian 09, Revision D.01, Gaussian, Inc.: Wallingford CT, 2009.
[63] D. Andrae, U. Haeussermann, M. Dolg, H. Stoll, H. Preuss, Theor. Chim. Acta 1990, 77, 123–141.
[64] J. M. L. Martin, A. Sundermann, J. Chem. Phys. 2001, 114, 3408–3420.
[65] J. Tomasi, B. Mennucci, R. Cammi, Chem. Rev. 2005, 105, 2999–3093.
[66] A. K. Rappe, C. J. Casewit, K. S. Colwell, W. A. Goddard III, W. M. Skiff, J. Am. Chem. Soc. 1992, 114, 10024–10035.
[67] F. Neese, The ORCA program system, WIREs Comput. Mol. Sci. 2012, 2, 73–78.
[68] a) M. Barysz, A. J. Sadlej, J. Mol. Struct. 2001, 573, 181–200; b) M. Reiher, Theor. Chem. Acc. 2006, 116, 241–252.
[69] D. A. Pantazis, X. Y. Chen, C. R. Landis, F. Neese, J. Chem. Theory Comput. 2008, 4, 908–919.
[70] a) F. Neese, F. Wennmohs, A. Hansen, U. Becker, Chem. Phys. 2009, 356, 98–109; b) R. Izsák, F. Neese, J. Chem. Phys. 2011, 135, 144105; c) T. Petrenko, S. Kossmann, F. Neese, J. Chem. Phys. 2011, 134, 054116; d) S. Kossmann, F. Neese, Chem. Phys. Lett. 2009, 481, 240–243.
[72] S. Sinnecker, A. Rajendran, A. Klamt, M. Diedenhofen, F. Neese, J. Phys. Chem. A 2006, 110, 2235– 2245.
 3 ⋅6 H 2 O](https://thumb-us.123doks.com/thumbv2/123dok_es/4001276.676397/5.892.166.711.263.1106/figure-view-complex-cations-present-crystals-y-et.webp)