Accepted Manuscript
Oxidation kinetics of sardine oil in the presence of commercial immobilized lipases commonly used as biocatalyst
Ángela García Solaesa, María Teresa Sanz, Rodrigo Melgosa, Sagrario Beltrán
PII: S0023-6438(18)30446-8 DOI: 10.1016/j.lwt.2018.05.032 Reference: YFSTL 7142
To appear in: LWT - Food Science and Technology
Received Date: 22 January 2018 Revised Date: 10 May 2018 Accepted Date: 11 May 2018
Please cite this article as: Solaesa, Á.Garcí., Sanz, Marí.Teresa., Melgosa, R., Beltrán, S., Oxidation kinetics of sardine oil in the presence of commercial immobilized lipases commonly used as biocatalyst, LWT - Food Science and Technology (2018), doi: 10.1016/j.lwt.2018.05.032.
M
AN
US
CR
IP
T
AC
CE
PT
ED
1
Oxidation kinetics of sardine oil in the presence of
1
commercial immobilized lipases commonly used as biocatalyst
2
Ángela García Solaesa, María Teresa Sanz
∗
, Rodrigo Melgosa, Sagrario Beltrán3
Department of Biotechnology and Food Science (Chemical Engineering Section), 4
University of Burgos, 09001 Burgos. Spain 5
Abstract
6
Oxidation kinetics of sardine oil have been determined at 40, 65 and 90ºC by measuring 7
concentration of primary and secondary oxidation products in the presence of 8
commercial immobilized lipases (Lipozyme 435, Lipozyme RM and Lipozyme TL) 9
commonly used as biocatalyst in lipid modification reactions. Oxidation products 10
concentration was found to be lower when the immobilized lipases were added at the 11
highest temperatures studied. The lowest oxidation indices were observed in the 12
presence of Lipozyme RM. 13
Although the mechanism to explain this decrease in the oxidation products is not still 14
clear, these results might indicate that the use of these immobilized lipases in lipase-15
catalyzed reactions of fish oils at high temperature (90ºC) will yield higher reaction 16
rates but also a reduction of the oxidation products formed due to oxidation of 17
polyunsatured fatty acids. 18
Keywords: fish oil, omega-3, oxidation products, commercial immobilized lipases. 19
M
AN
PUFA), mainly eicosapentaenoic acid (EPA, 20:5n-3) and docosahexaenoic acid (DHA, 22
22:6n-3) which have been reported to protect against the development of many diseases 23
(Solaesa, Sanz, Falkeborg, Beltrán, & Guo, 2016). However, despite the high nutritional 24
value of these products, the high degree of unsaturation makes fish oils very prone to 25
autoxidation. The resulting breakdown products cause off-flavors and rancidity, loss of 26
nutritional value and finally consumer rejection (Gómez-Alonso, Mancebo-Campos, & 27
Salvador, 2004). The degree and rate of lipid oxidation is influenced by the unsaturation 28
of fatty acids, oxygen concentration, temperature, surface area, water activity and 29
presence of anti– and prooxidants. Temperature has also an important impact on lipid 30
oxidation since an increase in temperature accelerates oxidation rates. 31
The process of lipid oxidation can be described in three general steps: initiation, 32
propagation and termination. The concentrations of primary and secondary oxidation 33
products can be measured quantitatively and therefore give an indication of the 34
oxidative status of the oil. The hydroperoxide content, as primary oxidation products, is 35
usually determined by the peroxide value (PV) assay. Secondary oxidation products can 36
be determined by anisidine value (AV) and thiobarbituric acid reactive substances 37
(TBARS) assays. AV measures mainly 2-alkenals and 2,4-dienals. On the other hand, 38
the cyclic peroxides formed by autoxidation from polyunsaturated fatty acids with three 39
or more double bonds are the most important precursors of malonaldehyde and hence 40
source of TBARS (Hoyland & Taylor, 1991). Polyene index (PI) is also used as a good 41
indicator of PUFA deterioration in fish oils, defined as (EPA + DHA): palmitic acid 42
M
AN
Omega-3 concentrates can be produced by lipase-catalyzed reactions since they can be 44
carried out under mild conditions in short reaction times compared with chemical 45
processes. Some widely used commercial immobilized lipases used in enzymatic 46
reactions are from Candida antarctica (Novozym 435 and Lipozyme 435), Rhizomucor 47
90ºC catalyzed by the commercial immobilized lipase, Lipozyme 435, was even lower 51
than the oxidation status of the initial sardine oil, determined as PV and AV. Especially, 52
hydroperoxide content decreased in a greater extend at the highest reaction temperature 53
assayed. Therefore, an increase in reaction temperature, not higher than the maximum 54
denaturation temperature for the lipase, was positive since reaction rate increased and 55
lower oxidation status of the final products was determined. 56
temperature range where lipase catalyzed reactions usually take place. The commercial 60
lipases used, immobilized onto different supports, were Lipozyme 435, Lipozyme RM 61
and Lipozyme TL. Autoxidation kinetics of sardine oil, as a control, were first 62
determined at the temperatures selected in this work (40, 65 and 90ºC) to determine the 63
net formation rate of the primary and secondary oxidation products. Afterwards, sardine 64
oil was incubated at the same temperatures in contact with the different immobilized 65
lipases to evaluate the reduction of the oxidation products concentration in the presence 66
M
AN
2. Materials and methods
68
2.1 Materials
69
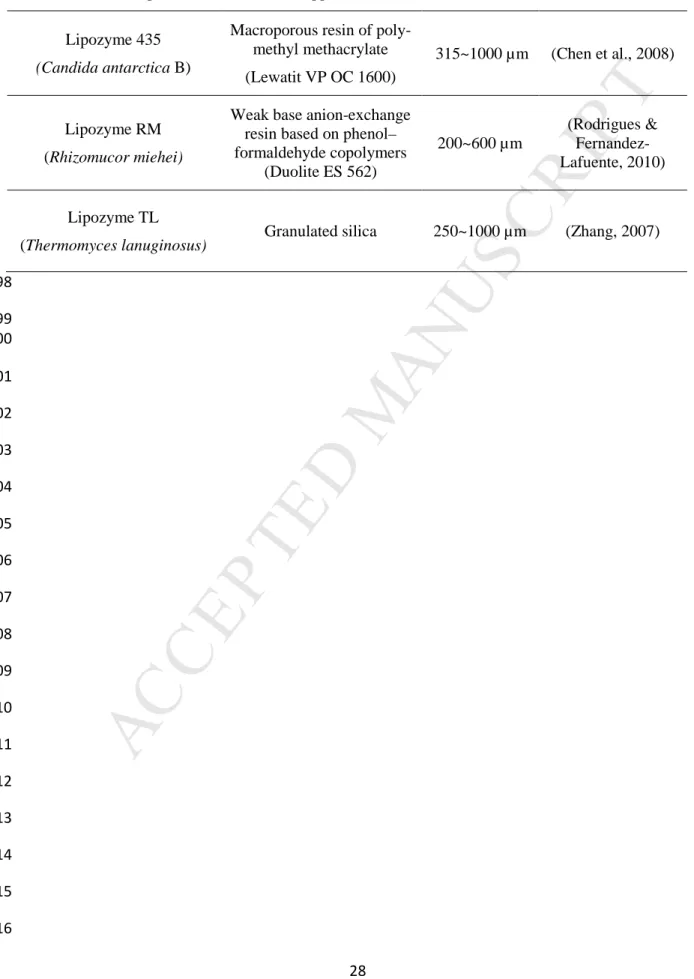
Refined sardine oil was provided by Industrias Afines S.L. (Spain). Three commercial 70
immobilized lipases were used in this work. Lipozyme 435 from Candida antarctica B 71
and Lipozyme TL IM from Thermomyces lanuginosus were kindly donated by 72
Novozymes A/S (Bagsvaerd, Denmark). Lipozyme RM IM, from Rhizomucor miehei, 73
was purchased from Sigma Aldrich. The support characteristics of these immobilized 74
lipases are summarized in Table 1. All other chemicals used in the different analyses 75
performed in this work, were of analytical or HPLC grade. 76
2.2Oxidation kinetics of sardine oil
77
First, autooxidation kinetics of sardine oil were evaluated at three different temperatures 78
40, 65 and 90 ºC as control samples. 79
For each experiment, stoppered erlenmeyer glass flasks were filled with 70 g of refined 80
sardine oil and immediately applied a nitrogen stream in the flask. Afterwards they were 81
perfectly closed and covered with foil paper to avoid the light exposure. Sardine oil 82
samples were incubated in a water bath with orbital agitation at the corresponding 83
temperature. At different time intervals, during10 h, aliquots were withdrawn to follow 84
This concentration was found to be suitable for lipid modification reactions (Solaesa et 89
al., 2016). As for the autooxidation kinetics, samples were withdrawal at different time 90
M
AN
US
CR
IP
T
AC
CE
PT
ED
5
All samples were stored at -18ºC up to oxidation products analysis. Duplicate 92
experiments were carried out at each temperature. 93
2.3Determination of primary oxidation products: peroxide value (PV)
94
PV was determined by iodometric titration following the AOAC Official Method 95
(AOAC Official Method 965.33, 2000) by an automatic titrator Methrom 905 Titrando. 96
PV was expressed as milliequivalents of O2 per kilogram of sample. All samples were
97
analyzed in triplicate. 98
2.4 Determination of secondary oxidation products
99
2.4.1 Anisidine value (AV)
100
The AV was measured according to AOCS Official Method (AOCS Official Method Cd 101
18-90, 2017), using a UV-Visible spectrophotometer at 350nm. All samples were 102
analyzed in triplicate. 103
2.4.2 Thiobarbituric acid reactive substances (TBARS) assay
104
TBARS were determined according to the spectrophotometric method described by 105
Norveel Semb in her Master's Thesis (Norveel Semb, 2012). The method is based on the 106
formation of a pink complex with strong absorbance at 532-535nm due to the presence 107
of thiobarbituric acid reactive substances (TBARS). TBARS is expressed as mg of 108
malondialdehyde (MDA) per kilogram of oil. All samples were analyzed in triplicate. 109
2.5Fatty acid analysis
110
The initial sardine oil and the oil samples after 10 h of incubation at 40, 65 and 90ºC 111
were analyzed by the AOAC method (AOAC Official Method 991.39, 2000) to evaluate 112
the fatty acid profile and the polyene index (EPA+DHA/16:0). An Agilent gas 113
M
AN
was used. The method and the calibration procedure was developed previously (Solaesa 116
et al., 2016). The samples were analyzed in triplicate. 117
2.6Statistical analysis
118
Statistical analyses were conducted using software Statgraphics X64. Control 119
experiments and oxidation status of sardine oil in contact with the immobilized lipases 120
were carried out in duplicate. For each oxidation product, analysis was performed in 121
triplicate. The results are presented as a mean ± standard deviation. The significance of 122
three operating temperatures at a specific contact time. ANOVA was also performed to 126
analyze the statistical significance of time by comparing oxidation product 127
concentration for each enzyme and temperature along time. 128
The estimation of the parameters for the models tested in this work was performed by 129
using the Marquardt algorithm (Statgraphics X64). 130
3. Results and discussion
131
3.1 Chemical quality of initial sardine oil
132
The fatty acid profile and some quality parameters of the supplied refined sardine oil 133
used in this work are presented in Table 2. The fatty acid profile was similar to those 134
previously reported for sardine oil (Homayooni, Sahari, & Barzegar, 2014; Noriega-135
Rodríguez et al., 2009; Okada & Morrisset, 2007; Solaesa, Bucio, Sanz, Beltrán, & 136
Rebolleda, 2014). The polyene index (PI) of the supplied refined sardine oil used in this 137
M
AN
US
CR
IP
T
AC
CE
PT
ED
7
(Homayooni et al., 2014). Otherimportant quality parameters such as acid value, PV 139
and AV for the supplied refined sardine oil were 0.45 ± 0.04 mg KOH/g, 4.8 ± 0.6 meq 140
O2/kg and 19.7 ± 0.4, respectively. These values were very close to the limits allowed
141
by GOED Voluntary Monograph (GOED, 2015), which are 0.5 mg KOH/g for acid 142
value, 5 meq O2/kg oil for PV and 20 for AV. Therefore, the supplied refined sardine oil
143
used in this work was partially oxidized and oxidation reaction rates could be faster due 144
to the presence in the medium of oxidation products. According to Toro-Vázquez et al. 145
(1993) the induction period was reduced as initial peroxide value increased, based on 146
their study of corn oil oxidation. The refined sardine oil used in this work presented a 147
value of 46 mg of MDA/kg. Regarding TBARS content, the maximum is not clearly 148
specified. A document by FAO establishes for fresh fish oil a TBARS value of 50 mg of 149
MDA/kg fish oil, although it is referred to fishes feed (Masson S, 1994). The induction 150
period (h) by Rancimat, determined at 70ºC and 20 L/h of air flow rate was 7.2 hours, 151
similar to that obtained by Noriega et al. (Noriega-Rodríguez et al., 2009) for crude and 152
deodorized sardine oil (10.4 and 17.7 h, respectively) using Rancimat at 60ºC and 7 L/h 153
of air flow rate. 154
3.2 Oxidation kinetics of sardine oil at different temperatures
155
3.2.1 Kinetic aspects of oxidation products
156
Peroxide values were determined over time during 10 h at 40, 65 and 90ºC (Fig. 1a). At 157
any incubation time, hydroperoxide content increased with incubation temperature. Fig. 158
1a also shows that peroxide value continuously increased with time during 10 h. This
159
means that hydroperoxide rate formation was still higher than hydroperoxide rate 160
M
AN
The kinetics of lipid oxidation is not an easy task. Reactions rates are usually described 162
by a pseudo-zero, pseudo-first and pseudo second order reactions. In any case, the order 163
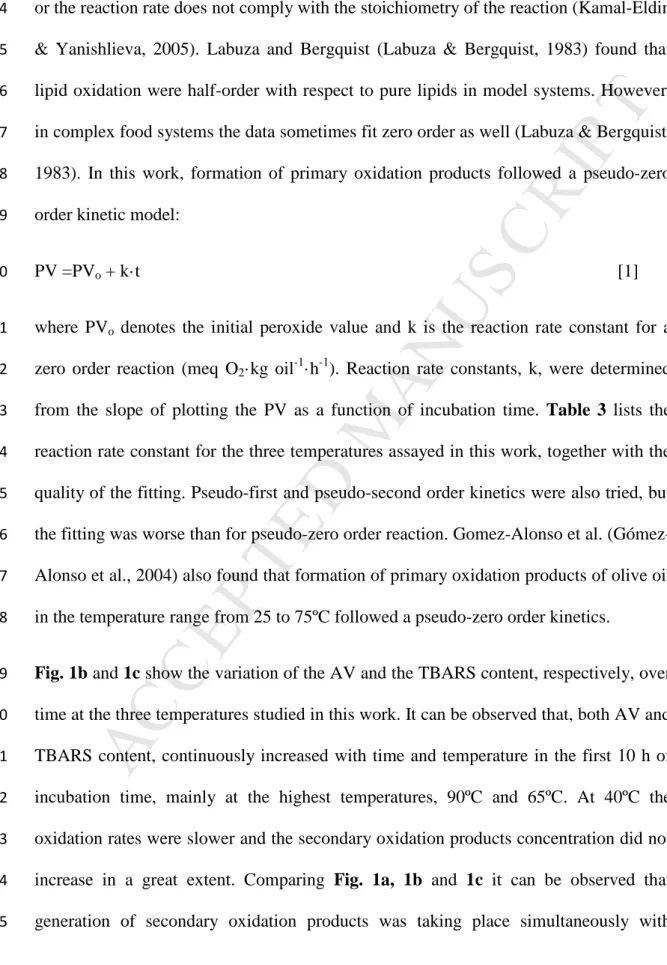
or the reaction rate does not comply with the stoichiometry of the reaction (Kamal-Eldin 164
& Yanishlieva, 2005). Labuza and Bergquist (Labuza & Bergquist, 1983) found that 165
lipid oxidation were half-order with respect to pure lipids in model systems. However, 166
in complex food systems the data sometimes fit zero order as well (Labuza & Bergquist, 167
1983). In this work, formation of primary oxidation products followed a pseudo-zero 168
order kinetic model: 169
reaction rate constant for the three temperatures assayed in this work, together with the 174
quality of the fitting. Pseudo-first and pseudo-second order kinetics were also tried, but 175
the fitting was worse than for pseudo-zero order reaction. Gomez-Alonso et al. (Gómez-176
Alonso et al., 2004) also found that formation of primary oxidation products of olive oil 177
in the temperature range from 25 to 75ºC followed a pseudo-zero order kinetics. 178
Fig. 1b and 1c show the variation of the AV and the TBARS content, respectively, over
179
time at the three temperatures studied in this work. It can be observed that, both AV and 180
TBARS content, continuously increased with time and temperature in the first 10 h of 181
incubation time, mainly at the highest temperatures, 90ºC and 65ºC. At 40ºC the 182
oxidation rates were slower and the secondary oxidation products concentration did not 183
increase in a great extent. Comparing Fig. 1a, 1b and 1c it can be observed that 184
M
AN
incubation time, hydroperoxide formation was still higher than its decomposition into 187
secondary oxidation products. Similar behavior has been also observed for vegetables 188
oils, such as olive and rapeseed oil, in which it was observed that secondary oxidation 189
products begin to be formed nearly at the same time as hydroperoxides generation 190
(Guillen & Cabo, 2002). Gomez-Alonso et al. (Gómez-Alonso et al., 2004) proposed a 191
pseudo-first order reaction for the formation of secondary oxidation products, 192
determined as AV, in olive oil. However, similar to hydroperoxide formation, the best 193
fitting for AV and TBARS content was obtained for a pseudo-zero order reaction. 194
Reaction rate constants for this model are collected in Table 3 together with the quality 195
of the fitting. 196
The kinetics of PUFA secondary oxidation products formation has not yet been well 197
investigated (Kamal-Eldin & Yanishlieva, 2005). From Fig. 1b and 1c and the values of 198
the kinetic constant, it can be observed that TBARS content formation increased faster 199
than AV. Some authors support the theory that TBARS are formed in considerable 200
amounts mainly from PUFA’s containing three or more double bonds (Hoyland & 201
Taylor, 1991). Therefore, the faster increase of TBARS content in comparison with AV 202
could be probably due to the high PUFA content of the refined sardine oil. 203
M
AN
3.2.2 Thermodynamic aspects of sardine oil oxidation
212
The dependence of the kinetic rate constant on temperature is usually represented by an 213
Arrhenius type relationship: 214
k = k · exp − [2]
215
where k is the reaction rate constant, ko is the pre-exponential factor, Ea the activation
216
energy and R the universal gas constant. Fig. 2a shows the Arrhenius plot for the 217
primary and secondary oxidation products of sardine oil. The activation energy for each 218
oxidation product formation is reported in Table 3. The errors associated to the 219
activation energy values for each oxidation product have been evaluated through the 220
slope-error of a least square line-fitting algorithm. 221
For the hydroperoxide formation, an activation energy of 37.1 kJ/mol was obtained. 222
This value was compared with other studies found in the literature, which are 223
summarized in Table 4. Yin et al. (Yin & Sathivel, 2010) obtained a similar value for 224
hydroperoxides formation in the unrefined pollock oil. Table 4 also reports Ea for some
228
vegetable oils being more temperature-dependent than fish oils autooxidation. The 229
lower Ea for fish oils is expected because less energy should be required to initiate
230
oxidation due to the higher n-3 PUFA content compared to vegetable oils. Furthermore, 231
vegetable oils have high content of natural antioxidants, such as tocopherols (Lee, Lee, 232
M
AN
The dependence on temperature of the reaction rate constants of the secondary oxidation 234
products formation followed also an Arrhenius type relationship with activation energy 235
of 55.9 kJ/mol when they were determined as AV and 35 kJ/mol when they were 236
determined as TBARS. The higher activation energy for the formation of non-volatile 237
secondary oxidation products determined as AV demonstrates that is more temperature 238
sensitive than hydroperoxides and TBARS formation. For formation of both, 239
hydroperoxides and TBARS, similar values of Ea were obtained, according to the
240
mechanism proposed by some authors for malonaldehyde formation from peroxides 241
which are produced from fatty acids containing three or more double bonds (Hoyland & 242
Taylor, 1991). 243
Enthalpy (∆H≠) and entropy (∆S≠) of activation were also estimated by applying the 244
equation of Eyring (Eq. 3), by plotting ln (k/T) vs 1/T: 245
equation, units of k should be s-1. However, primary and secondary oxidation products 250
formation was good described by zero order reaction rate. Although units of Erying 251
equation won’t cancel each other, in this work, it was assumed that comparison of 252
temperature dependence among the different oxidation products could be established 253
since all the oxidation products determined in this work were fitted to zero order 254
reaction rate. In any case, for the Eyring plot, time units in the reaction rate constants 255
were expressed as s. A straight line was obtained with negative slope (-∆H/R) and a y-256
intercept (∆S/R+ln(kB/h)). Therefore, from the slope and the intercept, the values of ∆H≠
M
AN
US
CR
IP
T
AC
CE
PT
ED
12
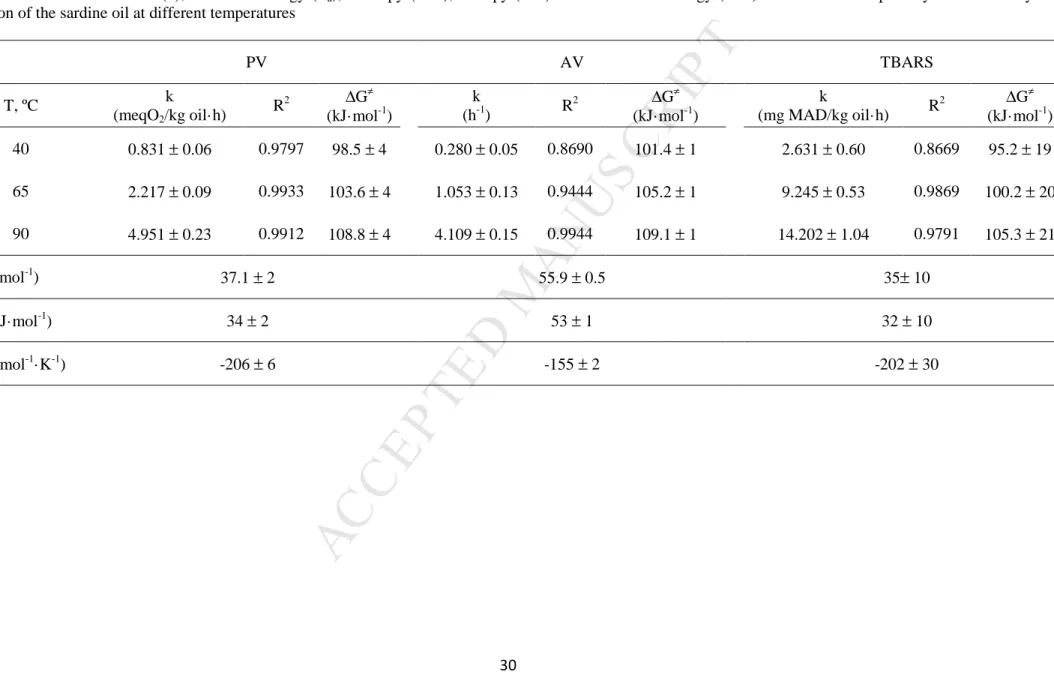
and ∆S≠ have been calculated, and presented in Table 3. ∆H≠ is the energy involved in 258
the process during oxidation, the positive value of ∆H≠ for the primary and secondary 259
oxidation products indicated that the oxidation process is endothermic. The higher value 260
of ∆H≠for AV, compared to PV and TBARS indicated lower reactivity. 261
∆S≠ is related to the degree of disorder of a system, in a spontaneous process the energy 262
of the system tends to decrease, while the total entropy tends to increase (Silva 263
Rodrigues et al., 2017). The negative value for ∆S≠, in all the oxidation reactions, was a 264
result of association mechanism between reacting species to form the transition state 265
during the reaction. The Gibb’s free energy of activation (∆G≠) was calculated for each 266
temperature by the thermodynamics fundamental equation: 267
∆ = ∆ − ∆ [4]
268
Negative values of ∆G≠ indicate a spontaneous reaction, while positive values indicate 269
nonspontaneous reaction. Table 3 also reported the ∆G≠ at the three temperatures for all 270
the oxidation kinetics. The positive values of the Gibbs’s free energy of activation also 271
showed the non-spontaneity of this process. The increase of ∆G≠ with temperature 272
observed was related to the endothermic oxidationmechanism (Pazhouhanmehr et al., 273
2016). 274
The errors associated to the values of the different thermodynamic parameters presented 275
in Table 3 have been evaluated through the slope or intercept error of a least square 276
line-fitting algorithm and in the case of ∆G≠ combining the uncertainties from ∆H≠ and 277
∆S≠ according to the error propagation theory. 278
3.3Oxidation status of sardine oil in contact with different immobilized lipases
M
AN
Table 5 presents the different PV, AV and TBARS over time for sardine oil in contact
280
with the three immobilized lipases selected in this work, at different incubation 281
temperatures, 40, 65 and 90ºC. 282
When sardine oil was in contact with the immobilized lipases, PV were much lower 283
than the values corresponding to the control samples (Fig. 1a) at the highest 284
temperatures studied in this work (65 and 90 ºC), being even lower than the initial PV 285
for sardine oil. This decrease in primary oxidation products can be the result of a 286
complex balance between formation, decomposition, adsorption capacity of the 287
immobilized lipase support and also reaction of primary oxidation products with the 288
own lipase. This complex balance seems to be favored by an increase in temperature 289
(Table 5). At 10 h of contact time, at the highest temperature, 90 ºC, PV of sardine oil 290
in contact with Lipozyme RM, immobilized on a weak base anion exchange resin 291
(Rodrigues & Fernandez-Lafuente, 2010), reached the lowest value, followed by 292
Lipozyme 435, immobilized on a macroporous resin of poly-methylmethacrylate. The 293
same trend was observed at 65 and 40ºC. However, at 40ºC the PV of sardine oil in 294
contact with the immobilized lipases was no significantly different than those reported 295
previously for oxidation of sardine oil at 40ºC in the control samples for Lipozyme RM 296
and Lipozyme 435, while for Lipozyme TL, even higher values were obtained. 297
Therefore, at 40ºC hydroperoxides formation was still probably promoted. 298
Regarding secondary oxidation products content, determined as AV and TBARS, 299
sardine oil incubated with the immobilized lipases presented also lower levels than the 300
corresponding to the control samples at the highest temperatures, 90 and 65ºC (see Fig. 301
1b and 1c). AV was slightly lower than the initial value of the sardine oil, 19.7, for
302
M
AN
control samples in the absence of immobilized lipases. 305
In the case of TBARS content, at the highest temperatures, 90 and 65ºC, much lower 306
values were obtained compared to the values reported for the control oil in the absence 307
of immobilized lipases (see Fig 1c). Similar to PV, oil samples in contact with 308
Lipozyme RM at 90 ºC and 65 ºC, reduced their TBARS content below the initial value 309
for sardine oil, from 46 mg MDA/kg of oil to 15 mg MDA/kg of oil, almost a 70% less. 310
On the contrary, for Lipozyme TL, at 40 ºC, values of the same order or even higher 311
were obtained than for the control sardine oil in the absence of immobilized lipases. 312
In general, the oxidation products concentration of sardine oil bulk in contact with the 313
optimum due to higher reaction rates and also lower oxidation products concentration in 318
the reaction bulk. The decrease of oxidation status was also observed by Solaesa et al. 319
(2017) in a previous work on glycerolysis reaction of sardine oil catalyzed by Lipozyme 320
proposed that peroxide compounds could be retained in the enzyme bed. 324
In any case, when considering high operation temperatures in biocatalysis, although it 325
could be positive from the quality product point of view, denaturation temperature of 326
M
AN
the lipase activity. These authors proposed that hydroperoxide decomposition products 332
could cause inactivation of the enzyme. 333
Although, mechanism is not still clear, among the different phenomenon that could be 334
higher affinity for hydrophilic oxidation products. On the contrary, Lipozyme 435 was 338
products usually are (Kamal-Eldin & Yanishlieva, 2005). This could partially explain 342
the difference observed among both immobilized lipases. In case of Lipozyme TL, 343
although it was immobilized on silica gel, a hydrophilic material, its particle size range 344
was bigger (250-1000 µm) as well as the true density of the support (1830 kg/m3, 345
M
AN
The oxidation status for sardine oil in contact with the immobilized lipases (Cimmob-lipase)
354
has been related to the corresponding data for the control sardine oil previously 355
determined in section 3.2 at the same temperature and incubation times (Ccontrol), C
immob-356
lipase/Ccontrol, for each type of oxidation product. Figures 3a, 3b, 4a, 4b, 5a and 5b show
357
Based on the shape of the Fig. 3-5 the following equation has been used to correlate the 364
where Cimmob-lipase,t is the concentration of oxidation compounds in sardine oil in contact
367
with immobilized lipases at a certain contact time, t, Ccontrol,t is the concentration of
368
oxidation compounds in control sardine oil (in the absence of immobilized lipases) at 369
the same incubation time, t, n is an adjustment parameter and k is an empirical constant. 370
This equation was based on the modified model of Brimberg proposed by Monte et al. 371
(Monte et al., 2015) in the study of reduction of color and oxidation products of carp oil 372
with blends of bleaching earth and activated carbon. The dependence of k parameter on 373
M
AN
US
CR
IP
T
AC
CE
PT
ED
17
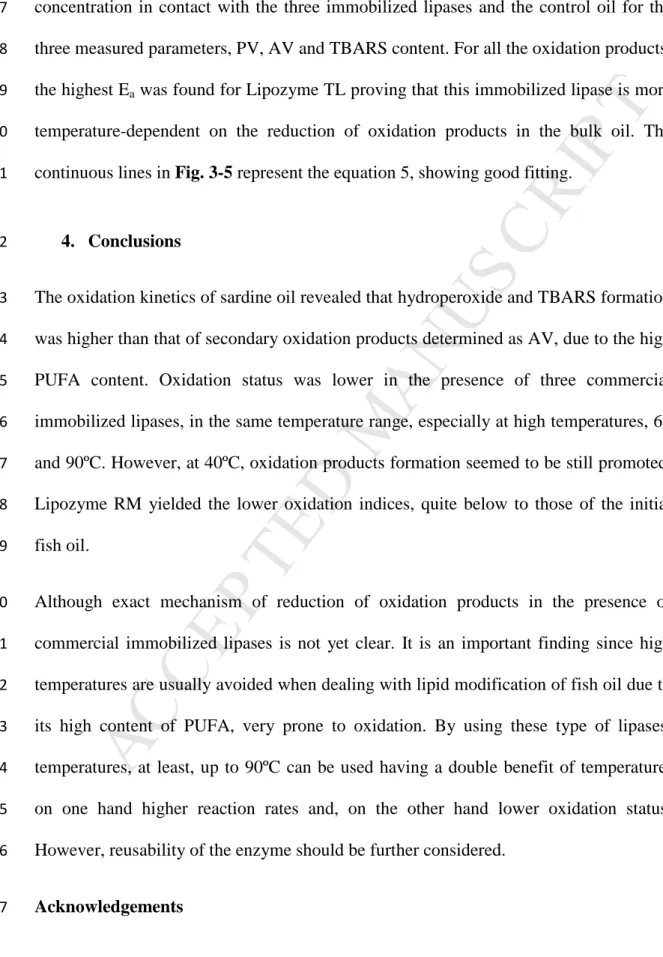
only the highest temperatures, 90 and 65º C were considered in the fitting procedure. 375
Table 6 lists the parameters obtained for equation 5 to relate the oxidation products
376
concentration in contact with the three immobilized lipases and the control oil for the 377
three measured parameters, PV, AV and TBARS content. For all the oxidation products, 378
the highest Ea was found for Lipozyme TL proving that this immobilized lipase is more
379
temperature-dependent on the reduction of oxidation products in the bulk oil. The 380
continuous lines in Fig. 3-5 represent the equation 5, showing good fitting. 381
4. Conclusions
382
The oxidation kinetics of sardine oil revealed that hydroperoxide and TBARS formation 383
was higher than that of secondary oxidation products determined as AV, due to the high 384
PUFA content. Oxidation status was lower in the presence of three commercial 385
immobilized lipases, in the same temperature range, especially at high temperatures, 65 386
and 90ºC. However, at 40ºC, oxidation products formation seemed to be still promoted. 387
Lipozyme RM yielded the lower oxidation indices, quite below to those of the initial 388
fish oil. 389
Although exact mechanism of reduction of oxidation products in the presence of 390
commercial immobilized lipases is not yet clear. It is an important finding since high 391
temperatures are usually avoided when dealing with lipid modification of fish oil due to 392
its high content of PUFA, very prone to oxidation. By using these type of lipases, 393
temperatures, at least, up to 90ºC can be used having a double benefit of temperature; 394
on one hand higher reaction rates and, on the other hand lower oxidation status. 395
However, reusability of the enzyme should be further considered. 396
Acknowledgements
M
AN
US
CR
IP
T
AC
CE
PT
ED
18
The authors thank the European Regional Development Fund (ERDF) and Junta de 398
Castilla y León [grant number BU055U16] for financial support. AGS acknowledges 399
University of Burgos and RM MINECO [grant number BES-2013-063937] for their 400
pre-doctoral contracts. 401
402
403
M
AN
US
CR
IP
T
AC
CE
PT
ED
19
References
405
AOAC Official Method 965.33. (2000). Peroxide Value of Oils and Fats. 406
AOAC Official Method 991.39. (2000). Fatty Acids in Encapsulated Fish Oils and Fish 407
Oil Methyl and Ethyl Esters. 408
AOCS Official Method Cd 18-90. (2017). p-Anisidine Value. 409
Chen, B., Hu, J., Miller, E. M., Xie, W., Cai, M., & Gross, R. A. (2008). Candida 410
antarctica Lipase B Chemically Immobilized on Epoxy-Activated Micro- and 411
Nanobeads : Catalysts for Polyester Synthesis. Biomacromolecules, 9, 463–471. 412
GOED. (2015). Voluntary Monograph Version 5 (Issue Date November 19). 413
Gómez-Alonso, S., Mancebo-Campos, V., & Salvador, M. D. (2004). Oxidation 414
kinetics in olive oil triacylglycerols under accelerated shelf-life testing (25 – 75oC). 415
European Journal of Lipid Science and Technology, 106, 369–375.
416
Guillen, M.D., Cabo N. (2002). Fourier transform infrared spectra data versus peroxide 417
and anisidine values to determined oxidative stability of edible oils. Food 418
Chemistry, 77, 503-510.
419
Homayooni, B., Sahari, M. A., & Barzegar, M. (2014). Concentrations of omega-3 fatty 420
acids from rainbow sardine fish oil by various methods. International Food 421
Research Journal, 21(2), 743–748.
422
Hoyland, D., & Taylor, A. (1991). A Review of the Methodology of the 2-423
Thiobarbituric Acid Test. Food Chemistry, 40, 271–291. 424
Kamal-Eldin, A., & Yanishlieva, N. (2005). Chapter 10. Kinetic Analysis of Lipid 425
M
AN
US
CR
IP
T
AC
CE
PT
ED
20
Labuza, T., & Bergquist, S. (1983). Kinetics of Oxidation of Potato Chips under 427
Constant Temperature and Sine Wave Temperature Conditions. Journal of Food 428
Processing and Preservation, 48, 712–715.
429
Lee, J., Lee, Y., & Choe, E. (2007). Temperature dependence of the autoxidation and 430
antioxidants of soybean, sunflower, and olive oil. European Food Research and 431
Technology, 226, 239-246.
432
Masson S, L. (1994). Control de Calidad de Insumos y Dietas Acuicolas 433
http://www.fao.org/docrep/field/003/ab482s/ab482s10.html. 434
Monte, M. L., Monte, M. L., Pohndorf, R. S., Crexi, V. T., & Pinto, L. A. A. (2015). 435
Bleaching with blends of bleaching earth and activated carbon reduces color and 436
oxidation products of carp oil. European Journal of Lipid Science and Technology, 437
117, 829–836.
438
Noriega-Rodríguez, J. A., Ortega-García, J., Angulo-Guerrero, O., García, H. S., 439
Medina-Juárez, L. A., & Gámez-Meza, N. (2009). Oil production from sardine ( 440
Sardinops sagax caerulea ) Producción de aceite a partir de sardina ( Sardinops 441
sagax caerulea). CyTA -Journal of Food, 7(3), 173–179. 442
Norveel Semb, T. (2012). Analytical Methods for Determination of the Oxidative Status 443
in Oils (Master’s Thesis; NTNU).
444
Okada, T., & Morrisset, M. (2007). Recovery and Characterization of Sardine Oil 445
Extracted by pH Adjustment. Journal of Agricultural and Food Chemistry, 55, 446
1808–1813. 447
Pazhouhanmehr, S., Farhoosh, R., Sharif, A., & Esmaeilzadeh, R. (2016). Oxidation 448
M
AN
US
CR
IP
T
AC
CE
PT
ED
21
bene oils ’ unsaponifiable matter. Food Chemistry, 190, 748–754. 450
Rodrigues, R. C., & Fernandez-Lafuente, R. (2010). Lipase from Rhizomucor miehei as 451
a biocatalyst in fats and oils modification. Journal of Molecular Catalysis B: 452
Enzymatic, 66, 15–32.
453
Sathivel, S., Huang, J., & Prinyawiwatkul, W. (2008). Thermal properties and 454
applications of the Arrhenius equation for evaluating viscosity and oxidation rates 455
of unrefined pollock oil. Journal of Food Engineering, 84, 187–193. 456
Silva Rodrigues, J., Peixoto do Valle, C., Pinheiro Guerra, P. D. A. G., De Sousa Rios, 457
M. A., Queiroz Malveira, J. De, & Ricardo, N. M. P. S. (2017). Study of kinetics 458
and thermodynamic parameters of the degradation process of biodiesel produced 459
from fi sh viscera oil. Fuel Processing Technology, 161, 95–100. 460
Solaesa, Á. G., Bucio, S. L., Sanz, M. T., Beltrán, S., & Rebolleda, S. (2014). 461
Characterization of Triacylglycerol Composition of Fish Oils by Using 462
Chromatographic Techniques. Journal of Oleo Science, 63(5), 449–460. 463
Solaesa, Á. G., Sanz, M. T., Falkeborg, M., Beltrán, S., & Guo, Z. (2016). Production 464
and concentration of monoacylglycerols rich in omega-3 polyunsaturated fatty 465
acids by enzymatic glycerolysis and molecular distillation. Food Chemistry, 190, 466
960–967. 467
Solaesa, Á. G., Sanz, M. T., Melgosa, R., & Beltrán, S. (2017). Substrates 468
emulsification process to improve lipase-catalyzed sardine oil glycerolysis in 469
different systems. Evaluation of lipid oxidation of the reaction products. Food 470
Research International, 100(May), 572–578.
471
M
AN
US
CR
IP
T
AC
CE
PT
ED
22
Pinto, L. A. A. (2017). Bleaching optimization and winterization step evaluation in 473
the refinement of rice bran oil. Separation and Purification Technology, 175, 72– 474
78. 475
Sullivan, J. C., Suzanne, R., Jovica, F., & Jean, A. (2015). Oxidation Rates of 476
Triacylglycerol and Ethyl Ester Fish Oils. Journal of the American Oil Chemists’ 477
Society, 92, 561–569.
478
Toro-Vazquez, J.F., Castillo-M., A.A., & Hernández-C., R. (1993). A multiple-variable 479
approach to study corn oil oxidation. Journal of the American Oil Chemist's 480
Society, 70(3), 261-267.
481
Wang, Y., & Gordon, M.H. (1991). Effect of lipid oxidation products on the 482
transesterification activity of an immobilized lipase. Journal of Agriculturad and 483
Food Chemistry, 39, 1693-1695.
484
Xu, X., Timm-H., M., Skall Nielsen, N., Porsgaard, T., & Jacobsen, Ch. (2005) Effects 485
of antioxidants on the lipase-catalyzed acidolysis during production of structured 486
lipids. European Journal of Lipid Science and Technology, 107, 464-468. 487
Yin, H., & Sathivel, S. (2010). Physical Properties and Oxidation Rates of Unrefined 488
Menhaden Oil ( Brevoortia patronus ). Journal of Food Science, 75(3), 163–168. 489
Zhang, H. (2007). Evaluation of Practical Process Aspects for Lipozyme TL IM 490
Catalyzed Bulk Fat Modification in a Batch Reactor. The Open Biotechnology 491
Journal, 1, 72–80.
492
493
M
AN
M
AN
US
CR
IP
T
AC
CE
PT
ED
24 501
502
503
504
Fig. 2. (a) Arrhenius plot and (b) Eyring plot of the oxidation of sardine oil, PV (○), AV (□),
505
TBARS (∆). Units of k are listed in Table 3. Time units in Eyring plot for k values have been
506
expressed as s.
507 508 509
-2 -1 0 1 2 3
0.0027 0.0028 0.0029 0.0030 0.0031 0.0032 0.0033
ln k
1/T (K-1)
(a)
-16.0 -15.2 -14.4 -13.6 -12.8 -12.0 -11.2
0.0027 0.0028 0.0029 0.0030 0.0031 0.0032 0.0033
ln (
k/
T
)
1/T (K-1)
M
AN
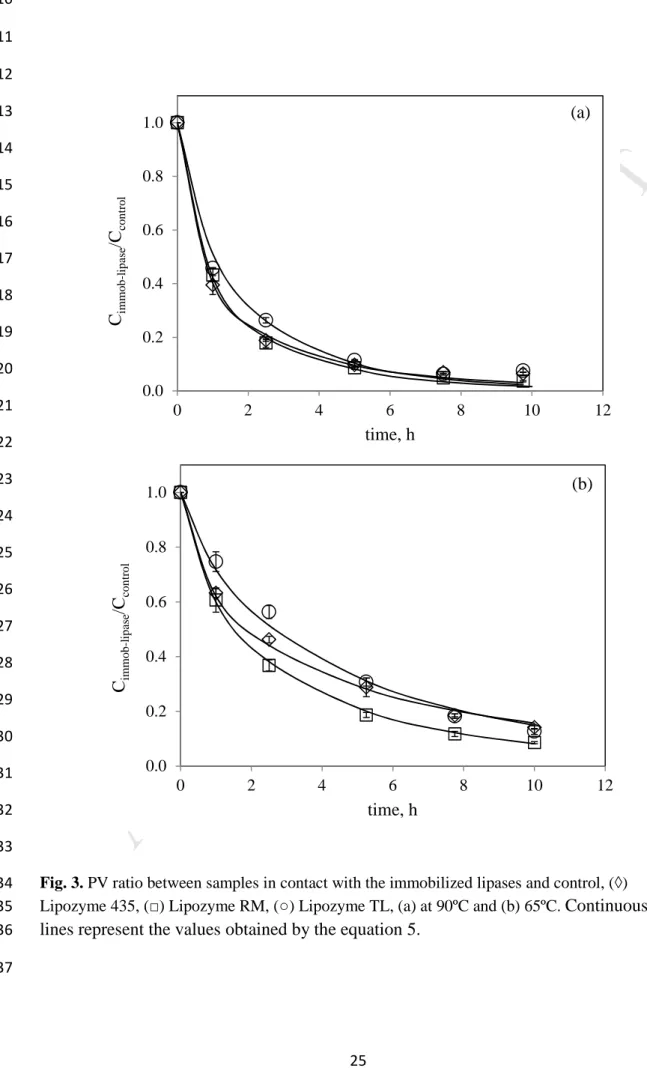
Fig. 3. PV ratio between samples in contact with the immobilized lipases and control, (◊) 534
Lipozyme 435, (□) Lipozyme RM, (○) Lipozyme TL, (a) at 90ºC and (b) 65ºC. Continuous 535
M
AN
Fig. 4. AV ratio between samples in contact with the immobilized lipases and control, (◊)
560
Lipozyme 435, (□) Lipozyme RM, (○) Lipozyme TL, (a) at 90ºC and (b) 65ºC. Continuous 561
M
AN
Fig. 5. TBARS ratio between samples in contact with the immobilized lipases and control, (◊)
589
Lipozyme 435, (□) Lipozyme RM, (○) Lipozyme TL, (a) at 90ºC and (b) 65ºC. Continuous 590
M
AN
US
CR
IP
T
AC
CE
PT
ED
28 596
Table 1. Characteristics of the immobilized commercial lipases used in this work. 597
Immobilized lipase Support Particle size Reference
Lipozyme 435
(Candida antarctica B)
Macroporous resin of poly-methyl methacrylate
(Lewatit VP OC 1600)
315~1000 µm (Chen et al., 2008)
Lipozyme RM
(Rhizomucor miehei)
Weak base anion-exchange resin based on phenol– formaldehyde copolymers
(Duolite ES 562)
200~600 µm
(Rodrigues & Fernandez-Lafuente, 2010)
Lipozyme TL
(Thermomyces lanuginosus) Granulated silica 250~1000 µm (Zhang, 2007)
M
AN
US
CR
IP
T
AC
CE
PT
ED
29 617
Table 2. Fatty acid composition and chemical characteristics of the 618
refined sardine oil used in this work.
619
Fatty acid profile (wt%)
C14:0 6.3 ± 0.2
C16:0 17.3 ± 0.3
C16:1n-7 8.4 ± 0.1
C16:2n-4 1.1 ± 0.0
C16:3n-4 1.2 ± 0.0
C16:4n-1 2.1 ± 0.0
C18:0 3.7 ± 0.0
C18:1n-9 13.9 ± 0.1
C18:1n-7 3.7 ± 0.0
C18:2n-6 2.9 ± 0.0
C18:4n-3 2.1 ± 0.0
C20:1n-9 2.6 ± 0.0
C20:3n-3 1.1 ± 0.0
C20:5n-3 15.7 ± 0.3
C22:1n-11 1.9 ± 0.0
C22:5n-3 1.9 ± 0.1
C22:6n-3 8.2 ± 0.3
Others <1% 6.0 ± 0.1
PUFA % 39.6 ± 0.8
n3 % 31.2 ± 0.7
EPA+DHA 23.9 ± 0.6
Polyene index 1.39 ± 0.01
Acid value (mg KOH/kg)* 0.45 ± 0.04
Peroxide value (meqO2/kg) 4.8 ± 0.6
Anisidine value 19.7 ± 0.4
TBARS (mg MAD/kg oil) 46 ± 4
Induction period (h) by Rancimat (70 ◦C) 7.2 ± 0.7 *According to AOCS, Ca 5a-40.
M
AN
US
CR
IP
T
AC
CE
PT
ED
30
Table 3. Kinetic rate constant (k), activation energy (Ea), enthalpy (∆H≠), entropy (∆S≠) and Gibb’s free energy (∆G≠) of activation for primary and secondary oxidation of the sardine oil at different temperatures
PV AV TBARS
T, ºC k
(meqO2/kg oil·h)
R2 ∆G
≠
(kJ·mol-1)
k
(h-1) R
2 ∆G≠
(kJ·mol-1)
k
(mg MAD/kg oil·h) R
2 ∆G≠
(kJ·mol-1)
40 0.831 ± 0.06 0.9797 98.5 ± 4 0.280 ± 0.05 0.8690 101.4 ± 1 2.631 ± 0.60 0.8669 95.2 ± 19
65 2.217 ± 0.09 0.9933 103.6 ± 4 1.053 ± 0.13 0.9444 105.2 ± 1 9.245 ± 0.53 0.9869 100.2 ± 20
90 4.951 ± 0.23 0.9912 108.8 ± 4 4.109 ± 0.15 0.9944 109.1 ± 1 14.202 ± 1.04 0.9791 105.3 ± 21
Ea (kJ·mol -1
) 37.1 ± 2 55.9 ± 0.5 35± 10
∆H≠ (kJ·mol-1) 34 ± 2 53 ± 1 32 ± 10
M
AN
US
CR
IP
T
AC
CE
PT
ED
31 Table 4. Activation energy from the Arrhenius equation for the formation of hydroperoxides in
different kind of oils found in literature.
Type of oil T range (ºC) Ea, kJ/mol Reference
Refined sardine oil 40 - 90 37.1 This work
Unrefined menhaden oil 45 - 85 30.9 (Yin & Sathivel, 2010)
Unrefined pollock oil 24 - 90 33.2 (Sathivel et al., 2008)
Refined soybean oil
25 - 80
73.6
(Lee et al., 2007)
Refined sunflower oil 79.5
M
AN
Table 5. Oxidation products concentration for sardine oil samples in contact with Lipozyme 435, Lipozyme RM
and Lipozyme TL at 40, 65 and 90ºC at different incubation times.
Oxidation applying the Tukey's honestly significant difference (HSD) method at p-value ≤ 0.05.
M
AN
US
CR
IP
T
AC
CE
PT
ED
33 Table 6. Parameters of equation 5 with an Arrehnius type dependence on temperature for k parameter for oxidation products quantified by PV, AV and TBARS for the samples in contact with Lipozyme 435, Lipozyme RM and Lipozyme TL.
Immobilized lipase
PV AV TBARS
ko Ea, kJ/mol n R2 ko Ea, kJ/mol n R2 ko Ea, kJ/mol n R2
Lipozyme 435 5.9·103 26.5 0.59 0.998 2.3·105 45.2 1.03 0.968 2.2·102 19.9 0.78 0.973
Lipozyme RM 9.6·102 21.2 0.68 0.999 8.9·104 32.03 0.76 0.989 3.2·102 19.6 0.78 0.993
M
AN
US
CR
IP
T
AC
CE
PT
ED
Highlights
• PV and TBARS increase faster than AV in the autoxidation of sardine oil.
• Oxidation products concentration decreased in the presence of immobilized lipases.
• The decrease was higher for PV and TBARS than anisidine reacted compounds.