Synthesis, characterization and photocatalytic evaluation of potassium hexatitanate (K2Ti6O13) fibers
10
0
0
Texto completo
(2) Hydrogen production through an environmentally clean process is regarded as a promising energy carrier to achieve a sustainable energy system. Specifically, photocatalytic water splitting using with UV-Vis irradiation has attracted significant interest because such a system is capable of hydrogen production without greenhouse emissions and the use of solar irradiation [1]. Many studies have been carried out to develop highly active photocatalysts, some of the advantages of the photocatalysis are: low processing costs, the evolution of hydrogen and oxygen during the water splitting reaction and suitable small reactor systems for domestic applications [2]. Therefor the development of materials with appropriate band gap, crystallinity and morphological features allow the development of active photocatalysts and efficient processes for hydrogen production in the water splitting reaction. A method of synthesis which is widely used for semiconductor production for this purpose is the molten salts (Flux method). Agreements of synthesis condition and the kinds of molten salts used is posible to obtain nanometric particles or small fibers. Some examples of photocatalysts used for water splitting or H2/O2 evolution from aqueous solution with a sacrificial reagent prepared by this route and theoretical research are: SrTiO3 treated with the KCl flux exhibited higher activity by 20 times than the non-fluxtreated [3], La2Ti2O7 showed H2 evolution from an aqueous methanol solution [4,5] PbTiO3 nanospheres, flakes, hierarchical flowers and thin microbelts show excellent optical absorbance, fine band gap tuning and high surface area [6] CaZrTi2O7 powder with high crystallinity and 100–300 nm showed a broad photoluminescence band around 580 nm [7,8], K3Ta3Si2O13 and Ba3Ta6Si4O26 with one-dimensional and linear pillared structure [9], La-doped Ag1.4K0.6Ta4O11 makes use of Ag nanoparticles on the surface to enhance absorption in the visible region [10], RbLaNb2O7 prepared in platelet-shaped morphologies using a RbCl flux [11], strontium sodium tantalite (SNT) mesocrystals exhibit an outstanding photocatalytic performance due to their nanosteps, high porosity and preferred oriented direction [12] and graphitic carbon nitride (g-C3N4) showed the enhanced photocatalytic activity for water reduction and oxidation under visible light irradiation with wavelength > 420 nm [13]. So far, there is little research about potassium titanates as photocatalyst, some have been synthesized to assess the reduction of carbón dioxide with mixture of Cu/ZnO under concentrated solar irradiation [14]. However, there is scarce research related to their photocatalytic activity towards the splitting of the water molecule [15]. Therefore, the objective of the present research is the synthesis by flux method, characterization and photocatalytic evaluation of potassium hexatitanate through the water splitting reaction towards the hydrogen production under the visible light irradiation.. 2. Materials and Methods 2.1 Synthesis. 101 | P á g i n a.
(3) In this work, two samples of K2Ti6O13 were obtained by the method described by Ponce et al., [16]. Mixtures of raw materials (purity > 99%), TiO2 (Sigma-Aldrich), K2CO3 (Fermont) and H3BO3 (Fermont) with composition (mol %) 30K2O-60TiO2-10B2O3 were molten in a platinum crucible in an electrical furnace (Lindberg Blue BF51433). The furnace program included heating up to 400°C (to decompose boric acid and avoid losses due to volatilization[17]), which was maintained for 1 hour, followed by heating up to 1250°C and maintaining the temperature for another hour. Each of the melts was poured into water, after cooling, the samples were dried at 80°C in a stove (Lab-line 3475) for three hours and then powdered into an agate mortar (-80 mesh, 180 m). The remnant flux was dissolved in hot water (95°C) using a ratio of powder: water of 1:20 under magnetic stirring at a rate of 150 rpm for two hours, the solutions were filtered and the powders were dried at 70°C for two hours, after powders were thermally treated to growth fibers at 900 (C21) and 1000 °C (C22) for 2 h, using a heating rate of 10 °C/min.. 2.2 Characterization of materials. Powdered samples were analyzed by X-ray diffraction (XRD, Rigaku MiniFlex) using Cu-K radiation, measurements were performed in a 2θ interval from 5 to 80 ° and using a step size of 0.011 °/sec; likewise, they were attached to a metallic cylinder and coated with graphite and then characterized by scanning electron microscopy (SEM, Philips XL30ESEM) equipped with an X-ray micro-analyzer for energy dispersive spectroscopy (EDS, EDAX Pegasus). Specific surface area (BET, Brunauer–Emmett–Teller) was calculated from the amount of N2 adsorption at 77 K, in a Quantachrome Instrument. For the measurement of the band gap energy a UV–vis Perkin Elmer (Lambda-10) spectrophotometer equipped with an integration sphere for the diffuse reflectance studies was used.. 2.3 Photocatalityc evaluation. Photocatalytic evaluation of the synthesized samples towards the hydrogen production by water splitting was performed using a 250 W mercurial lamp and 0.2 g of each tungstate sample suspended in 200 mL of DI water and 4mL of methanol in the reactor system as sacrificial agent (2% vol). The suspension was placed inside a quartz photoreactor with a length and diameter of 19 and 5 cm, respectively, then it was hermetically sealed and placed 7 cm away from the 250 W mercury lamp. The photoreactor was kept under constant stirring and irradiated for 8 h [18]. The reaction was monitored by gas chromatography (GC) using a Perkin Elmer Clarus 500 GC. In order to monitor the photocatalytic reaction, gas samples were taken at regular time intervals using a gas syringe through a septum located at the upper section of the photoreactor, where a small gas headspace was located. A sample under darkness was 102 | P á g i n a.
(4) taken at the initial concentration and then the sampling took place every hour up to a total of 8 h of continuous irradiation.. 3. Results and Discussion 3.1 X-ray diffraction. X-ray diffraction patterns for synthetized samples are shown in Figure 1. Accordingly, it was found the single formation of crystalline K2Ti6O13 phase based on heat treatment at 900 °C (C21) and 1000 °C (C22), as indicated by ICSD Card pattern no. 74-0275. Additionally, samples were analyzed by Scherrer’ procedure to investigate about size of crystals (Table 1). Size of crystals is scarcely bigger for samples after heating treatment at 1000 °C, regarding to samples heated at 900 °C, thus indicating the influence of heating process during crystals aggregation and size. A range from 38 to 52 nm was identified for C22 crystal samples, which is similar to that reported in elsewhere [15].. Intensity (a.u). C21 C22 K2Ti6O13. 10. 20. 30. 40. 50. 60. 70. 80. 2 (degree). Fig. 1. XRD of the synthesized titanate.. 3.2 BET surface area. 103 | P á g i n a.
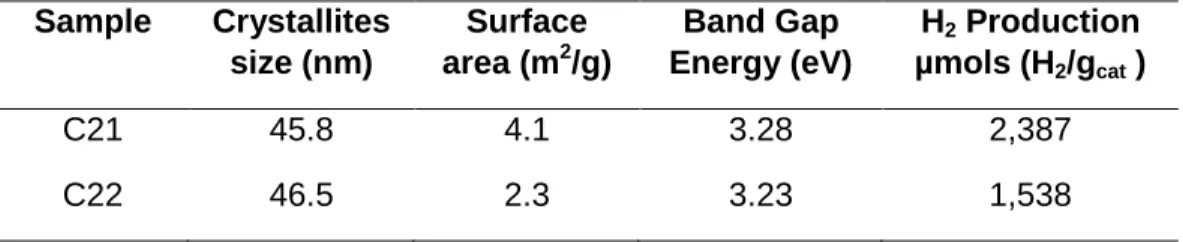
(5) Table 1 shows results concerning to surface area determined for synthetized samples. A surface area for C21 sample was 4.1 m2/g, while 2.3 m2/g was identified for C22 samples, which was associated to growth of K2Ti6O13 phase. According to literature, a surface area of 1.08 m2/g. [14] and 1.2 -2.9 [15] has been reported, which is in the same order of magnitude that results reported in Table 1. This finding is highlighted considering necessity of hydrogen production efficiency by water splitting process [2].. Table 1. Crystal size, surface area, band gap energy and hydrogen production.. Sample. Crystallites size (nm). Surface area (m2/g). Band Gap Energy (eV). H2 Production µmols (H2/gcat ). C21. 45.8. 4.1. 3.28. 2,387. C22. 46.5. 2.3. 3.23. 1,538. 3.3 UV – Vis spectra. Figure 2 shows the tungstate diffuse reflectance spectra (UV–Vis) of K2Ti6O13 samples; results were converted to Kubelka – Munk units [18] through to the following expression:. F(R) = (1–R)2/2R. (1). where R is diffuse reflectance and F(R) is the Kubelka – Munk function. In order to determine the direct band gap energy of the samples, a lineal region from the inflection point of the diffuse reflectance spectrum is considered, which represents the absorption energy above the border. Extrapolating the lineal slope up to the interception of the photonic energy axis (X axis), this point provides the band gap value of the material. The calculated values are presented en Table 1.. 104 | P á g i n a.
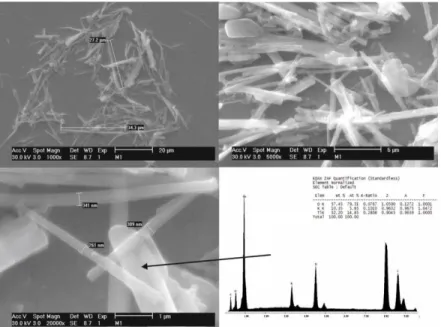
(6) (F(R)h). 2. C21 = K2Ti6O13. Eg = 3.23 eV. 2.0. 2.2. 2.4. 2.6. 2.8. 3.0. 3.2. 3.4. 3.6. 3.8. 4.0. h (eV). (F(R)h). 2. C22 = K2Ti6O13. Eg = 3.28 eV. 2.0. 2.2. 2.4. 2.6. 2.8. 3.0. 3.2. 3.4. 3.6. 3.8. 4.0. h (eV). Fig. 2. UV–Vis spectra of the synthesized titanate.. Most of band gap energies found for these materials are somewhat bigger than the observed values reported in the literature for similar synthesis techniques. For example, Pt and Cu/ZnO on K2Ti6O13 has no significant effect on the light absorption behavior of K2Ti6O13 since is reported to have Eg = 3.6 eV [14], while K2Ti6O13 exhibited a Eg = 3.5 – 3.6 eV [15], finally α-K2Ti6O13 show a Eg = 3.3 eV [19] which is very close to the value obtained in the present work.. 3.4 Scanning electron microscopy. Scanning electron microscopy provided important information related to samples morphology as well as the fiber size and elemental composition present in the samples. Figure 3 shows SEM images of the obtained titanate treated at 900 °. Accordingly, well 105 | P á g i n a.
(7) defined synthetized fibers are observed (30 µm long, 261-341 thick), while a similar morphology is observed for synthetized samples after 1000 °C treatment involving 12 µm long and 360-530 nm thick parameters (Figure 4). These findings suggest a longitudinal growth decrement, as well as thick increment for >900 °C treated samples. In addition, not any porosity is observed for C21 and C22 samples. Furthermore, the EDS analysis resulted in the expected molar ratios of the crystalline phase for each sample, thus verifying the obtained XRD results.. Fig. 3. SEM images of the C21 sample.. Fig. 4. SEM images of the C22 sample.. 106 | P á g i n a.
(8) 3.5 Photocatalytic evaluation Photocatalytic analyses for C21 and C22 samples were carried in order to determine hydrogen evolution during 8 h of splitting water molecule reaction and results are shown in Table 1. Highest hydrogen production was determined for C21 sample (2,387 µmoles H2/gcat) while minor rendering was identified for C22 sample (1,538 µmoles H2/gcat). These finding were mainly associated to surface area, shape and size and agglomeration properties for synthetized K2Ti6O13 phases.. 4. Conclusion Potasium titanates fibers were successfully synthetized using an effective synthesis method, followed by calcination at 900 and 1000 °C. The photocatalytic activity of K2Ti6O13 was investigated. Of the two samples prepared in the present study, C21 sample exhibited the best performance for the photocatalyst with the highest H2 production under visible light spectrum according to experimental results. The synthesis method allowed to obtain the desired crystalline phase. According to the photocatalytic evaluation towards the water splitting of the water molecule, it can be concluded that K2Ti6O13 is a promising and innovative photocatalytic material that needs to be further studied, especially on the proper surfaces on the fine crystals would provide the independent reaction field for either reductive or oxidative reaction to minimice the reverse reaction to create a more active and efficient photocatalyst toward the H2 production.. Acknowledgements The authors acknowledge QFB. Sandra V. Reyes Aguilera for the assistance in this work. Special thanks are given to PROFOCIE 2016 (Programa de Fortalecimiento de la Calidad en Instituciones Educativas), and Laboratorio Nacional de Nanotecnología in Centro de Investigación en Materiales Avanzados, S.C., for their support in funding and infrastructure.. References [1] Honda Y, Watanabe M, Hagiwara H, Idaa S, Ishihara T. Inorganic/whole-cell biohybrid photocatalyst for highly efficient hydrogen production from wáter. Appl. Catal., B 2017;210:400–6. [2] López XA, Fuentes AF, Zaragoza MM, Guillen JAD, Gutiérrez JS, Ortiz AL, Martínez VC. Synthesis, characterization and photocatalytic evaluation of MWO4 (M = Ni, Co, Cu and Mn) tungstates. Int. J. of Hydrogen Energy 2016;41:23312–17. 107 | P á g i n a.
(9) [3] Kato H, Kobayashi M, Hara M, Kakihana M. Fabrication of SrTiO 3 exposing characteristic facets using molten salt flux and improvement of photocatalytic activity for water splitting. Catal. Sci. Technol 2013;3:1733-38. [4] Hu S, Jia L, Chi B, Pu J, Jian L. Visible light driven (Fe, Cr)-codoped La2Ti2O7 photocatalyst for efficient photocatalytic hydrogen production. J. Power Sources 2014;266:304-312. [5] Wang Q, Hisatomi T, Moriya Y, Maeda K, Domen K. Physicochemical properties and photocatalytic H2 evolution activity of Rh-doped La2Ti2O7 prepared by molten salt synthesis. Catal. Sci. Technol 2013;3:2098–2103. [6] Chandrasekaran S, Kim EJ, Chung JS, Yoo I, Senthilkumar V, Kim YS, Bowen CR, Adamaki V, Hur SH. Structurally tuned lead magnesium titanate perovskite as a photoelectrode material for enhanced photoelectrochemical water splitting. Chem. Eng. J 2017;309:682-690. [7] Yugo M, Kenji S, Akihiko K. Nanocrystalline CaZrTi2O7 photocatalyst prepared by a polymerizable complex method in the presence of Cs2CO3 flux for water splitting. Chem. Lett. 2009;38:180–1. [8] Liu J, Chen S, Zhu Y. Electronic structures and effective masses of photogenerated carriers of CaZrTi2O7 photocatalyst: First-principles calculations. Solid State Commun 2012;152:1650–54. [9] Takayama T, Iwase A, Kudo A. Photocatalytic water splitting over rod-shaped K3Ta3Si2O13 and block-shaped Ba3Ta6Si4O26 prepared by flux method. Chem. Lett 2015;44:306–8. [10] Wang R, Zhu Y, Liu G, Lau T. Synthesis of La-doped Ag1.4K0.6Ta4O11 nanocomposites as efficient photocatalysts for hydrogen production and organic pollutants degradation. Appl. Catal., A 2013;467:335-341. [11] Arney D, Maggard PA. Effect of platelet-shaped surfaces and silver-cation exchange on the photocatalytic hydrogen production of RbLaNb2O7. ACS Catal 2012;2:1711–17. [12] Sun J, Chen G, Pei J, Jin R, Wang Q, Guang X. A simple approach to strontium sodium tantalite mesocrystals with ultra-high photocatalytic properties for water splitting. J. Mater. Chem. 2012;22:5609–14. [13] Zhang J, Zhang M, Zhang G, Wang X. Synthesis of carbon nitride semiconductors in sulfur flux for water photoredox catalysis. ACS Catal 2012;2:940–48. [14] Guana G, Kida T, Harada T, Isayama M, Yoshida A. Photoreduction of carbon dioxide with water over K2Ti6O13 photocatalyst combined with Cu/ZnO catalyst under concentrated sunlight. Appl. Catal., A 2003;249:11–8. [15] Yoshida H, Takeuchi M, Sato M, Zhang L, Teshima T, Chaskar MG. Potassium hexatitanate photocatalysts prepared by a flux method for water splitting. Catal. Today 2014;232:158–164. 108 | P á g i n a.
(10) [16] Peña PP, Lozano MAG, Bretado MAE, Gómez PD, Sánchez EG, Rivera E, Alexandrova L. Synthesis and characterization of potassium hexatitanato using boric acid as the flux, Ceram. Int 2015;41:10051–56. [17] Pernice P, Esposito S, Aronne A., Structure and nonisothermal crystallization of glasses in the BaO-TiO2-B2O3 system, Phys. Chem. Glasses 1998;39:222. [18] Back S, Wenderich K, Mul G. Synthesis of bimetallic tungstates for finding photocatalytic active compounds with a smaller band gap than tungsten oxide. University of Twente; 2014. Student Theses. [19] Meng X, Wang D, Liu J, Lin B, Fu Z. Effects of titania different phases on the microstructure and properties of K2Ti6O13 nanowires. Solid State Commun 2006;137:146–49.. 109 | P á g i n a.
(11)
Figure


Documento similar