An empirical examination of the relationship between wages and education
22
0
0
Texto completo
(2) CONTENTS 1 Introduction..............................................................................................................................3 2 Education and wages................................................................................................................5 2.1 Human capital...................................................................................................................5 2.2 Signaling...........................................................................................................................7 2.3 Wage equations................................................................................................................7 3 Data........................................................................................................................................11 3.1 The Programme for the International Assessment of Adult Competencies (PIAAC).......11 3.2 Descriptive statistics.......................................................................................................12 4 Results....................................................................................................................................13 5 Conclusions.............................................................................................................................20 6 References..............................................................................................................................21. 2.
(3) An empirical examination of the relationship between wages and education Rosa María Martí Linares. Abstract Education is a human right that allow people to develop their skills, improve their productivity and their living conditions. Education has long been recognized as an important foundation for sustained economic growth. Using data from the OECD Programme for International Assessment of Adult Competencies (PIAAC), we empirically investigate the economic effects of education in Spain. Our data source allow us to perform international comparisons and we estimate wage equations for three other European countries: France, the Netherlands and Norway. Another advantage of the PIAAC dataset is the availability of cognitive skills indices. We use these indices as proxy variables for the unobserved ability of workers. Based on these data, our estimates show a strong positive relationship between education and wages.. 1 Introduction The Spanish educational system receives a significant amount of resources of all kinds from the public sector, families and students themselves. In return for this significant amount of resources, it is expected that the sacrifice taken on in the present allow us to obtain a number of benefits in the future, especially for those who have received educational training. We can say therefore that from an economic perspective, that education is one of the fundamental instruments to achieving adequate standards of living and a society with equal opportunities. The level of education has influence in determining the type of jobs and wages to be obtained in the future. This increase in educational training allows the student to be a more efficient worker, being more 3.
(4) attractive for employers, and, consequently, it increases the possibility of higher earnings. The study of the effects of education in the economic sphere has had a great interest since the development of human capital theory, from the mid-60s, with the decisive contributions of Schultz (1960, 1962), Becker (1964), or Mincer (1974). The theory of human capital focuses on the behavior of rational individuals who decide on their level of training to help achieve the best situation for them throughout their lives. According to this theory, education can be considered as an investment, and its fruit, a type of capital, the human capital, which is incorporated into its owner. Thus, the returns to be derived by individuals for their contribution to the development of society will be greater the higher education.. The goal of this paper is to validate empirically that increasing education leads to an increase in salary by estimating wage equations using data obtained from the OECD Programme for the International Assessment of Adult Competencies (PIAAC). The information from this database allows us to analyze the economic effects of education taking into account not only the amount received but also controlling for other individual factors, especially the PIAAC cognitive indices measuring reading and numerical skills. Another advantage of our data source is that the PIAAC is designed to allow researches to make international comparisons. Although our main interest is in the case of Spain, we also consider the cases of three other European countries.. In the second section of the paper, we briefly review the theoretical and empirical approaches to the relationship between education and earnings, where we will explain the importance of human capital theory, discussing the ideas of the authors and critics. In the third section, we introduce our data source and report descriptive statistics of the key variables for the four European countries we consider: Spain, France, the Netherlands and Norway. In the fourth section, we apply econometric techniques to the data in order to analyze the influence of the determinants of salaries.. The data. obtained will be discussed and the methodology used explained, in our case the empirical strategy developed by the method of Ordinary Least Squares (OLS), then the main findings will be detailed. The last section summarizes the main conclusions of the study. 4.
(5) 2 Education and wages. According to international evidence education has a positive, permanent and direct relationship with salaries; this means that, ceteris paribus, the higher the educational level of workers, the higher the earnings. Education is essential to the economic growth of a country, key to achieving a society with equal opportunities and allowing people to achieve an adequate living level. Thus, wage inequality is caused in part by the different educational levels of workers. When we talk about the relationship between education and the level of wages, an increase in the level of education, assuming, all else being equal, will produce an increase in salary.. In this case, we consider education as an investment by the individual. It involves an initial cost which is expected to be recovered in the future. Therefore, there are three different classes of investment for workers: education, migration and the search for new jobs; see chapter 9 of Ehrenberg and Smith (2012). The three investments have an initial cost and the three are based on the expectation of higher future incomes that allow individuals to recoup the initial costs. To reflect the similarity of these three investments economists refer to as investments in human capital, a term that conceptualizes workers as embodying a set of skills that can be “rented out” to employers.. This investment in the skills and knowledge of workers takes place in three stages: the first is childhood where individual decisions are determined by others, parents and compulsory education rules; the second stage is adolescence where knowledge and skills are acquired as students; and the last stage is incorporation into the labour market. A challenge that confronts any behavioral theory is explaining why people in the same environment have different choices.. 2.1 Human capital. The research conducted has the support of the approach of human capital theory, the definition of which is any voluntary mobilization of scarce resources devoted to the increase of the productive capacity of the individual.. 5.
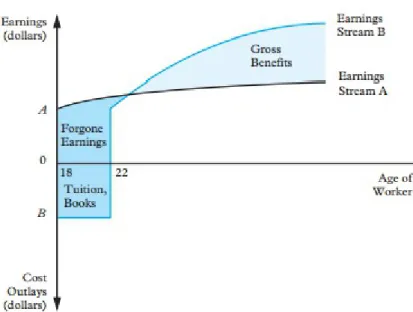
(6) Empirical studies analyzing the returns to, the labor market, salaries, discrimination, and other related issues have also been based on this economic theory arguing that human capital has positive effects on productivity, technical progress, employability, economic growth and social development.. The costs of investment in human capital can be separated into three categories. On the one hand we must take into account the cost of the investment in education, where tuition, books, and in some cases homes are included, while on the other hand it also means renouncing an income, since during the period of investment in education it is complicated to work, at least full time, and finally, another factor to consider are the psychic losses since studying can be tough and difficult. However, it should be noted that the decision to invest in education in the future will provide higher incomes and better work conditions.. Figure 1: Alternative Earnings Streams. Source: Ehrenberg and Smith (2012). As we can see from the chart, the individuals that invest in education have negative revenues during the first four years, because of the costs of studying. In the next stage, once the individuals have completed their studies, they continue to invest in themselves, accepting lower-wage jobs that provide them with a higher content of job training during their early years in the labor market. They can, therefore, have access to jobs with higher pay in the future, since they have more work experience. 6.
(7) 2.2 Signaling. The traditional hypothesis of human capital theory, which links education with increases in worker productivity, is called into question when Arrow (1973), Spence (1973) and Stiglitz (1975) introduced the theory of signaling as an alternative. The assumption on which this theory is based raises the usefulness of education as a mechanism by which individuals acquire knowledge which is used as an indicator to offer themselves to employers and who then establish expectations about productivity.. This theory may help to explain the existing wage differentials between individuals with identical levels of education, unlike the classic model of human capital, which does not answer it. Employers sometimes encounter problems when determining the salaries of their employees, as there may be differences between productivity demonstrated and the expectations of the employers based on the information they had.. In order to determine the productivity of individuals, employers rely on indices and signals to assign a salary corresponding to the expectations created from the signals offered by employees in the form of academic qualifications. When a worker perceives that the signals can increase their profits through information regarding their skills, they will try to increase their education. In the signalling theory framework, education does not necessarily raise the productivity of workers. Academic qualifications solve the problem of asymmetric information: highly productive workers demonstrate their skills by obtaining academic degrees.. Both the classical theory of human capital and signaling theory imply similar behavior in terms of education. In both models the individual increases their education to earn higher wages, but the differences are in the implications that decisions have on the work market.. 2.3 Wage equations. Based on the Theory of Human Capital, Mincer (1974) presents a model of wage determination. This model focuses on the study of the dynamics of stages in life with. 7.
(8) regard to revenue, investigating the relationship between observed income, potential income, and investment in human capital, in terms of formal education and job training.. Given that the human capital theory states that there is a positive relationship between education and the income individuals obtain in the future, wage determination also takes into account the variation in earnings explained by differences in the years of education which increase significantly when controlled by age. However, the conclusion is that neither the Mincer basic model, with years of education as the only variable, nor the model of schooling with age as an additional explanatory variable account for more than 15% of the variation on income. Mincer proposes completing the basic model, with the introduction of variables measuring the weeks worked per year and post-schooling investment.. There is a large initial imbalance of earnings generated by education due to differences of post-schooling investment. However, this imbalance begins to decline in response to the equalization of the logic of current value; this decrease is called the "overtaking point". According to Mincer, after 7 or 9 years integrated into the labor world, the effect of formal education is at its maximum because the post-school training performance now meets the investment cost, and finally the imbalance increases again in the final stages of working life. Thus, having controlled the experience, part of the variations in salaries is explained by education. If the differences in post-school investment and weeks worked per year are taken into account, the explanatory power of the model rises to over 50%, and may be increased by standardizing differences in the quality of teaching by up to 70%.. After making the observation of these empirical results, Mincer wanted to introduce a new concept of the relationship between salary and years of education and work experience. However, the information at its disposal did not allow him to know with certainty the years of work experience of each individual. To overcome this lack of information, Mincer proposed subtracting the age of completion of studies from the reported age. To capture the diminishing effect of experience on earnings, a quadratic term is added. In practice, the concept of potential experience is used, instead the concept of experience, since there is usually no information about the age at which individuals complete their training. This new formulation of experience is defined as age minus years of education minus the years of initiation. Consequently, Mincer 8.
(9) proposes the equation expressing earnings according to years of education and years of potential labour market experience. The logarithm of wage is used in this equation to impose a constant percentage effect on the dependent variables of wage. Thus, under this specification, the natural logarithm of earnings is not a separable from education, experience, gender, etc. The specification is as shown in the equation:. log (w)=α 0 +α1 S +α 2 X +α3 X 2+ε where w is the worker's wage, S are years of education, X is potential experience in the labor market,. α 0, …, α3 are regression parameters and ε is an unobserved error. term, assumed to have zero conditional mean.. There are different rates for the performance of education in groups with different levels of experience. Therefore, introducing potential experience rather than age in determining the equations of earnings is a way to capture, on the one hand, the shape of the age-income profile and on the other, differences between individuals with different levels of education. That is, by introducing the years of potential experience, a single rate of return on education in the labor market is obtained. Owing to this result, the Mincer equation is considered the most widespread tool in empirical research to estimate the causal effect of education on earnings. However, Mincer has acknowledged that the argument underlying the earnings equation is not complete. This model of earnings is determined by investment in individuals focusing on the supply of human capital, and leaves aside the effects of demand in the labor market. Furthermore, the distribution of income is explained by the distribution of human capital accumulated and this is in turn explained by the distribution of skills and opportunities. With this in mind, the human capital theory does not incorporate the effects of innate abilities and imperfections in the capital market on the demand for education in its analysis.. Concluding with an analysis of Mincer´s proposal, it can be said that his argument does not distinguish the cause from the effect of education in increased earnings. It may be due to an effect of productivity growth from education, or an effect of identification or signaling. In these terms, the Mincer equation is consistent with any hypothesis of human capital theory.. 9.
(10) The phenomena associated with the increase in earnings inequality and salaries have renewed interest in the study of the labor market and theories that explain its operation. Usually economic shortfall solutions offered by TCH, human capital theory are related to improving educational levels. There are several ways to calculate the rate of return on education, but one of the most used is the Mincerian equation, (traditional Mincer equation), as explained above.. The assumption of human capital, as stated above, is that the individual tries to maximize their utility by optimizing their path of consumption and years of education. However, it overlooks aspects such as the cost of education and public subsidies. This allows scientific contributions to show that in measuring the performance of education estimated by OLS, several biases exist. Griliches (1977) identified the following:. 1. The existence of certain omitted variables in the Mincer equation such as the ability of the individual. Ability is a variable that is not directly observable or available in databases, meaning that an assumption has to be made to quantify how to approach the information available. If the error term includes the ability of the individual, and assumes that people with higher skills choose to be better educated, this would lead to inconsistent estimates, since the random disturbance and educational level would be correlated and this would cause the returns to education to be overestimated.. 2. The incorrect measurement of education. The Mincer equation implies a single rate of return on education, however, both theory and empirical evidence show this is not the case, and suggests representing schooling in a more broken down and flexible manner. The aim is to collect returns on the process of investment in education in a better way. Failure to properly collect data on educational level would cause an underestimation in performance.. 3. Finally there is selection bias which he seeks to minimize. This bias arises when only earnings of those employed are observed, so some attributes are lost in the OLS when the wages function is calculated, leading to biased estimates of the parameters. According to this, the selection of the sample can be seen as a specification error that has incorrectly omitted a relevant variable.. 10.
(11) 3 Data. 3.1 The Programme for the International Assessment of Adult Competencies (PIAAC). PIAAC, the Programme for International Assessment of Adult Competencies is a program conducted by the OECD in 2008. It seeks to assess the different levels of knowledge and skills distribution of the adult population during its working life in 24 different countries, of which 22 belong to the OECD, a group of most developed countries, with 9 countries more participating as part of the program.. This program attempts to measure basic cognitive skills that allow adults to participate in social and economic life as well as the basic skills required by their job. To perform this evaluation, information about the personal history of the population that has been selected in the sample is collected, on the demands of the job and the use of information technology in general. Two basic mandatory aspects are valued for all participating countries, the rate of reading comprehension (literacy) and index calculation capacity (numeracy), which in this work will be referred to as lit and num variables. and will be analyzed in more detail, comparing the results between the. countries Spain, France, Norway and the Netherlands. The method of evaluating the different degrees of knowledge is by examination, in which tests of maths skills (numeracy) and reading comprehension (literacy) are answered by a sample of people aged between 16 and 65 years. The tests are designed and managed by a consortium of universities and research centers led by the Educational Testing Service. This evaluation is designed to be internationally valid and provide a comparative analysis of the systems of education, training and results, with the intention of being an international reference on adult skills. In this way, policy makers can evaluate the development of key aspects in the development and acquisition of skills. The results are beneficial as they help countries better understand how education and education systems can help develop these skills. Educators, policymakers and labour economists may use this information to develop economic, educational and social policies to improve the skills of adults. Although the final beneficiaries are the citizens of the participating countries, who benefit from further elaboration and implementation of effective policies. 11.
(12) 3.2 Descriptive statistics. Table reports the means and standard deviations of the variables used in the econometric analysis. The statistics in Table 1 are computed with all the observations available for each of the four countries we consider.. Table 1: Descriptive statistics: all observations Spain Mean Std. Dev. lwage 2,169 0,55 educ 11,156 3,54 exper 16,756 12,20 pub 0,205 0,40 ngo 0,012 0,11 age 40,082 13,57 female 0,510 0,50 marr 0,653 0,48 kids 0,597 0,49 imm 0,132 0,34 lit 249,632 50,67 num 243,029 53,31. France Mean Std. Dev. 2,502 0,46 11,382 3,62 20,442 13,28 0,235 0,42 0,027 0,16 41,841 14,28 0,510 0,50 0,740 0,44 0,669 0,47 0,116 0,32 263,607 49,23 256,401 56,92. Netherlands Mean Std. Dev. 2,710 0,66 13,129 2,74 19,767 12,76 0,257 0,44 0,054 0,23 41,778 14,42 0,508 0,50 0,764 0,42 0,630 0,48 0,091 0,29 285,198 46,61 281,689 49,29. Norway Mean Std. Dev. 5,298 0,49 14,141 2,60 18,620 12,78 0,358 0,48 0,016 0,12 39,860 14,18 0,482 0,50 0,752 0,43 0,648 0,48 0,128 0,33 281,636 46,04 282,191 53,56. Source : Own elaboration. The variables used in this paper are:. •. lwage: the natural logarithm of hourly earnings for Individuals employed.. •. educ: the education received by individuals, in years.. •. exper: the work experience of each, in years.. •. pub: a dummy variable indicating whether individuals are employed in the public sector or not.. •. ngo: this dummy unlike previous shows whether the individuals work in a nonprofit organization or not.. •. age: indicates the age of the individuals.. •. female: dummy; 1 if female, 0 if male.. 12.
(13) •. marr: dummy; 1 cohabiting, 0 if not cohabiting.. •. kids: dummy; 1 if you have children, 0 if they have children.. •. imm: dummy; 1, if they are immigrants, 0 if they are not.. •. lit: literacy, reading ability index obtained in PIAAC test.. •. num: numeracy, numerical ability index obtained in the PIAAC test.. In Table 1 all the above mentioned variables are presented for the four different countries. As we can see, the average number of years in educational training in Spain is 11,156 well below 14.141 years in Norway. Moreover, the average work experience is 16.76 years in Spain, compared with 20.44 years in France, 19.77 years in Holland, and 18.62 years in Norway. As for the control variables introduced with reference to the characteristics of individuals it should be mentioned that in Spain 51% of the individuals in question are women and of all individuals surveyed 13% are immigrants. We can also see that 20% of individuals in the sample are working in the Spanish public sector compared with 1% who do so in a non-profit organization. The means of the literacy and numeracy indices of Spain are the lowest of the four countries analyzed.. 4 Results. We will now go on to focus on the empirical analysis of earnings differentials according to the results obtained in the test conducted by the PIAAC applying econometric regression techniques. This methodology involves using a multivariate equation that incorporates the explanation on earnings an individual receives of all observable determinants of their salary. If the educ variable, once differences between individuals are accepted, remains significant, it is concluded that there is empirical evidence of salary discrimination for education reasons in the populations analyzed. Estimates by Ordinary Least Squares (OLS), Mincer type earnings equations whose dependent variable is the logarithm of earnings:. log wage = β 0 + β 1 educ + β 2 exper + β 3 pub + β 4 ngo + β 5 age + β 6 female + β 7 married + β 8 kids + β 9 imm + β 10 lit + β 11 num 13.
(14) This equation presents an earnings logarithm. There are three reasons for using this semi-logarithmic specification. First, has been mathematically obtained by solving the proposal in Mincer´s theoretical model. Secondly, it is the solution to potential problems of normality in the estimate. Finally, it allows an easy interpretation of the coefficients of our estimates, which indicate the percentage change in the dependent to a unit change in the explanatory variable. It is important to have a good database that can be developed specifically for this type of analysis. In our work we have included variables with greater academic merit than have appeared as relevant in previous studies.. We also include in our regressions lit and num indices in order to mitigate the possible selection bias originating in the omission of the ability of workers in the above equation. The inclusion of these variables produces consistent estimates of the returns on education under the conditions exposed by Wooldridge (2010), who calls this procedure the plug-in solution to the omitted variables problem. The first condition refers to the irrelevance of the proxy variables. Ideally, if we could observe the ability of the workers and include it as an explanatory variable then lit and num would be irrelevant in the wage equations; the only reason to use lit and num as explanatory variables is that ability is unobservable. The second condition states that lit and num are good proxy variables for ability. Once we control for num and lit, the other explanatory variables are irrelevant in explaining the average level of ability. Therefore including these proxy variables helps to estimate the returns to education more accurately avoiding bias owing to the omission of the ability variable.. 14.
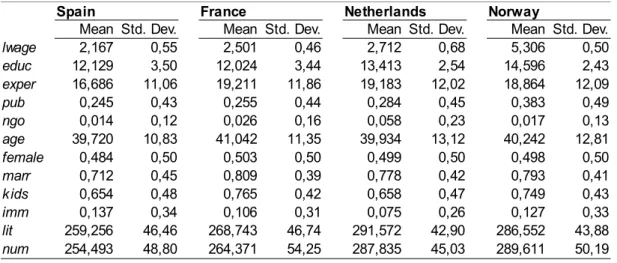
(15) Table 2: Descriptive variables: only wage earners Spain Mean Std. Dev. lwage 2,167 0,55 educ 12,129 3,50 exper 16,686 11,06 pub 0,245 0,43 ngo 0,014 0,12 age 39,720 10,83 female 0,484 0,50 marr 0,712 0,45 kids 0,654 0,48 imm 0,137 0,34 lit 259,256 46,46 num 254,493 48,80. France Mean Std. Dev. 2,501 0,46 12,024 3,44 19,211 11,86 0,255 0,44 0,026 0,16 41,042 11,35 0,503 0,50 0,809 0,39 0,765 0,42 0,106 0,31 268,743 46,74 264,371 54,25. Netherlands Mean Std. Dev. 2,712 0,68 13,413 2,54 19,183 12,02 0,284 0,45 0,058 0,23 39,934 13,12 0,499 0,50 0,778 0,42 0,658 0,47 0,075 0,26 291,572 42,90 287,835 45,03. Norway Mean Std. Dev. 5,306 0,50 14,596 2,43 18,864 12,09 0,383 0,49 0,017 0,13 40,242 12,81 0,498 0,50 0,793 0,41 0,749 0,43 0,127 0,33 286,552 43,88 289,611 50,19. Source: Own elaboration. Table 2 shows the descriptive statistics of the variables for the subsample used for estimation. Our regressions only apply to those individuals who are working and exclude unemployed individuals. The sample used for estimation in the case of Spain contains data for 2343 individuals, 3236 in the case of France, 2857 individuals in the Netherlands and 3106 in Norway. The sample selection limits the generality of our results. Education could affect the probability of an individual finding a job. Additional years of education raises the expected earnings of an individual because by raising the probability of finding a job and by raising the expected wage. Our estimates, do not contain information on the effects of education on the probability of being employed. Therefore, our estimates are downward biased and represent a lower limit of the true returns to education. In spite of this, our estimates still remain informative if we limit our attention to the effect of education on the wages of employed workers.. Table 3 shows the regressions made with the data obtained from the PIAAC. The dependent variable in all regressions is the logarithm of the hourly wage. The estimates were obtained by Ordinary Least Squares. The standard errors reported in Table 3 are robust to heteroskedasticity. Also reported in Table 3 are N, the number of observations used in each regression; SER, the standard error of the regression; R2, the coefficient of determination; and F, the joint significance test robust to heteroskedasticity.. 15.
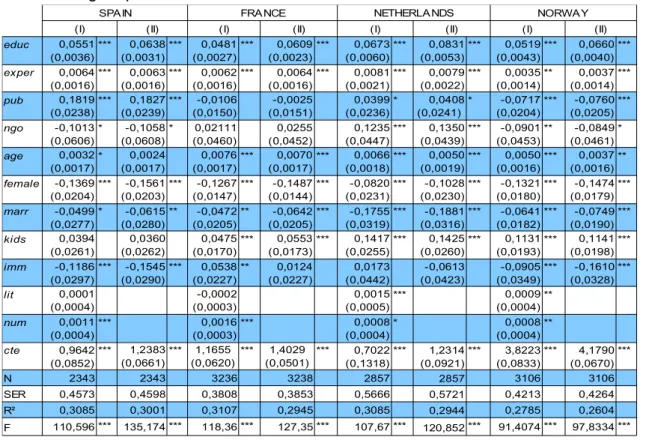
(16) Table 3: Wage equations estimates SPAIN (I) educ exper pub ngo age female marr kids imm lit num cte N. 0,0551 (0,0036) 0,0064 (0,0016) 0,1819 (0,0238) -0,1013 (0,0606) 0,0032 (0,0017) -0,1369 (0,0204). NETHERLA NDS. FRA NCE (II). 0,0638 (0,0031) 0,0063 *** (0,0016) 0,1827 *** (0,0239) -0,1058 * (0,0608) 0,0024 * (0,0017) *** -0,1561 (0,0203) ***. (I) *** *** *** *. ***. -0,0499 * -0,0615 ** (0,0277) (0,0280) 0,0394 0,0360 (0,0261) (0,0262) -0,1186 *** -0,1545 *** (0,0297) (0,0290) 0,0001 (0,0004). 0,0481 (0,0027) 0,0062 (0,0016) -0,0106 (0,0150) 0,02111 (0,0460) 0,0076 (0,0017) -0,1267 (0,0147). (II) *** ***. *** ***. -0,0472 ** (0,0205) 0,0475 *** (0,0170) 0,0538 ** (0,0227) -0,0002 (0,0003). 0,0011 *** 0,0016 *** (0,0004) (0,0003) 1,2383 *** 1,1655 *** 0,9642 *** (0,0661) (0,0620) (0,0852) 2343 2343 3236. 0,0609 (0,0023) 0,0064 (0,0016) -0,0025 (0,0151) 0,0255 (0,0452) 0,0070 (0,0017) -0,1487 (0,0144). (I) *** ***. *** ***. -0,0642 *** (0,0205) 0,0553 *** (0,0173) 0,0124 (0,0227). 1,4029 *** (0,0501) 3238. 0,0673 (0,0060) 0,0081 (0,0021) 0,0399 (0,0236) 0,1235 (0,0447) 0,0066 (0,0018) -0,0820 (0,0231). NORWAY. (II) *** *** * *** *** ***. -0,1755 *** (0,0319) 0,1417 *** (0,0255) 0,0173 (0,0442) 0,0015 *** (0,0005) 0,0008 * (0,0004) 0,7022 *** (0,1318) 2857. 0,0831 (0,0053) 0,0079 (0,0022) 0,0408 (0,0241) 0,1350 (0,0439) 0,0050 (0,0019) -0,1028 (0,0230). (I) *** *** * *** *** ***. -0,1881 *** (0,0316) 0,1425 *** (0,0260) -0,0613 (0,0423). 1,2314 *** (0,0921) 2857. (II). 0,0519 (0,0043) 0,0035 (0,0014) -0,0717 (0,0204) -0,0901 (0,0453) 0,0050 (0,0016) -0,1321 (0,0180). ***. -0,0641 (0,0182) 0,1131 (0,0193) -0,0905 (0,0349) 0,0009 (0,0004). ***. ** *** ** *** ***. *** ***. 0,0660 *** (0,0040) 0,0037 *** (0,0014) -0,0760 *** (0,0205) -0,0849 * (0,0461) 0,0037 ** (0,0016) -0,1474 *** (0,0179) -0,0749 *** (0,0190) 0,1141 *** (0,0198) -0,1610 *** (0,0328). **. 0,0008 ** (0,0004) 3,8223 *** (0,0833) 3106. 4,1790 *** (0,0670) 3106. SER. 0,4573. 0,4598. 0,3808. 0,3853. 0,5666. 0,5721. 0,4213. 0,4264. R². 0,3085. 0,3001. 0,3107. 0,2945. 0,3085. 0,2944. 0,2785. 0,2604. 118,36 ***. 127,35 ***. 107,67 ***. F. 110,596 ***. 135,174 ***. 120,852 ***. 91,4074 ***. 97,8334 ***. Source: Own elaboration. We report two regressions for each of the four countries which are analyzed. Model (I) includes as explanatory variables: educ, exper, pub, ngo, age, female, marr, kids, imm, lit and num. In Model (II) all explanatory variables are present except lit and num. The differences will be seen that may occur to earnings depending on the level of reading and maths ability of individuals according to the PIAAC surveys.. The signs of the coefficients are as expected based on the literature reviewed. We will briefly comment on the coefficients corresponding to the rest of the variables that explain the results of earnings individual receives. The results of this table show the marginal effects relating to future earnings. Taking into account (I), all else being equal, the more education, the higher the earnings. In the case of Spain this increase is 5.5 percent per additional year, similar to that in France and Norway with 4.8 percent and 5.2 percent, respectively, below Holland with 6.7 percent, with this significant variable. Work experience is a factor that also influences an increase in earnings. In Spain and France for each additional year this is 0.64 percent and 0.62 percent, well above 16.
(17) Norway with 0.35 percent, in contrast, well below Holland with an increase of 0.81 percent. The average value for the dummy indicates the proportion of individuals for whom the dummy is set to 1, for example, the value 0.1819 for the pub variable indicates that wages paid in Spain by the public sector are on average 18 percent higher than those paid in the private sector. This large difference is not observed in other countries. While in the Netherlands the public sector wages are 4 percent higher than in the private sector, the comparison is reversed in the other two countries: France and Norway with -1 percent and -7 percent respectively. However work in a non-profit organization has a negative influence on wages in the case of Spain a -10 percent and Norway -9 percent, however, this relationship is positive in the countries of France and Holland with 2 percent and 12 percent respectively. In terms of age, the four countries agree on the positive relationship that exists between earnings, ceteris paribus, all else being equal, and an additional year of age increasing earnings by 0.32 percent in Spain, 0,76 in France, 0.66 percent in Holland and 0.50 percent in Norway. It is different in the case of women, this time the four countries agree but on the negative relationship between the female variable and income. The value of this variable indicates that in Spain wages of women are 13.7 percent lower than those of a man with the same characteristics. In Norway the decline is similar with 13.21 percent. France and Holland, however, have a decrease in lower wages by 12.7 percent and 8.2 percent respectively. The conclusion we can draw from this result is that there is a part of the difference in earnings between men and women that does not come from a difference in characteristics, but can be attributed to gender discrimination. Living together is also a variable that has a negative relationship on income. In Spain and France the decline in earnings for living together is similar, with 5 percent and 4.7 percent, slightly higher is Norway with 6.4 percent, while in Holland the decline is much higher with 17.5 percent. On the other hand, children have a positively effect on earnings, so that an increase in the number of children, increases incomes. In Spain having children can increase earnings by 4 percent, the lowest percentage of all countries surveyed, in France it can be increased by 4.7 percent, similar to that of Spain, against the rise of 14.17 percent of salary in Holland and 11 percent in Norway.. 17.
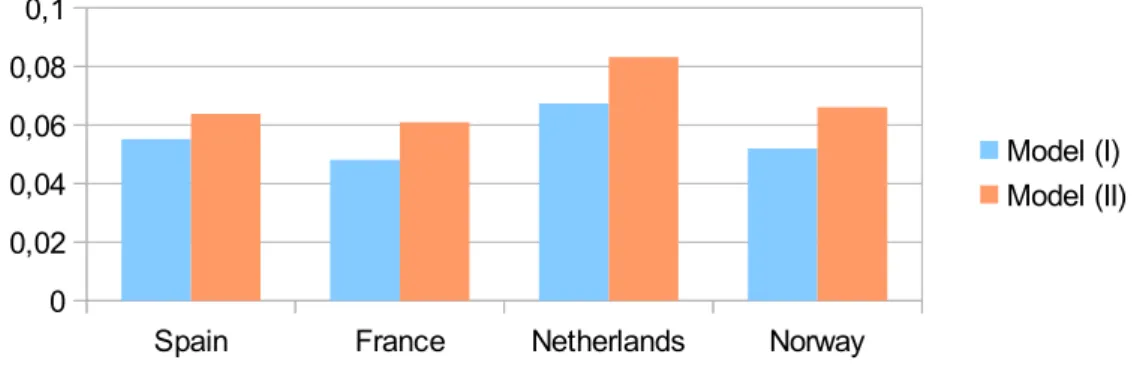
(18) At first glance we can say that using model (I), which takes into account the literacy and numeracy variables, that the results of the regression indicate that there is a clear and positive relationship between the results obtained in reading and maths comprehension, and education (educ) in the four countries. Therefore, ceteris paribus, all else being equal, higher scores on tests of literacy and numeracy, come from higher levels of education leads to increases earnings. However these results are different if we analyze model (II), in which we have not included the lit and num variables. In this case the performance of the educ variable in Spain was reduced to 5.5 percent this result affirms our initial opinion about the bias that can be produced by omitting the ability variable. In the case of Spain the omission of these two variables changes the value of education from 0.0551 to 0.0638, so in this model a year in education in Spain increase earnings by 6,4 percent. We see in general that the omission of the variables num and lit and increases the values of education in all countries of the table. In order to understand better a chart has been prepared with data of the variable educ in model (I) and data with the variable educ in model (II), this way we represent what was discussed earlier, that the omission of two of the most important variables in the model, num and lit increases the value of the educ variable, in the four countries.. Figure 2: Returns to education estimates 0,1 0,08 0,06. Model (I) Model (II). 0,04 0,02 0 Spain. France. Netherlands. Norway. Source : Own elaboration. 18.
(19) It can be said without doubt that these are two interrelated aspects. On the one hand the higher the ability of the people the higher the score obtained in the test of literary and numeracy and so the higher the level of education (variable educ). Moreover, the more education individuals have, the better their chances of getting a higher salary in the future. What is more, the R-squared (R²) by definition is between zero and one, and is responsible for determining the quality of the model to replicate the results, and the proportion of variation in results can be explained by the model, the closer to 1 the more concrete the model. The R² = 0.31 in Spain, showing that all independent variables of our model explain about 31 percent of the variation in earnings. Adding the literacy and numeracy variables only increases the R² from 0.3001 to 0.3085; this means that much of the variation in earnings is not explained by the factors in the model (II). 19.
(20) 5 Conclusions We can say that the theory of human capital is a useful framework for studying the behavior of the labor market and in the determination of earnings. The aim of this study was to analyze how education affects earnings, and other variables such as living with a partner, if you work in the public sector, age, gender, children, experience and place of birth. The sample estimate was based on data from surveys PIAAC (Programme for the International Assessment of Adult Competencies), for each of the four countries of Spain, France, Norway and Holland. Adding as proxy variables, literacy (level of literary ability) and numeracy (numeracy level), thus attempting to address the problem of omission of the innate ability variable. Eight regressions have been carried out , using the method of Ordinary Least Squares (OLS) with robust standard errors; two for each of the four countries, model (I) with the inclusion of lit and num variables, and model (II) with the omission of variables lit and num. Comparing the results of Spain with the other three countries, our analysis indicates in all samples, a positive relationship between educational training and earnings, resulting in an increased probability of getting higher salaries the higher the studies an individual has. It can be said, therefore, that education, in part, helps determine earnings. It has also been observed that the estimates of the returns on education are reduced when literacy and numeracy are introduced into the model, thus confirming the bias that is caused by the omission of the ability variable. The data obtained show that working in the public sector also has a positive relationship on earnings as do children, age and the experience factor. In contrast, being married and or being a woman have a negative relationship on earnings data and are also reduced by introducing lit and num variables in the model.. 20.
(21) 6 References -Ann P. Bartel and George J. Borjas., (1981). Wage Growth and Job Turnover: An Empirical Analysis. [pdf]. Available at: <http://www.nber.org/chapters/c8908.pdf> -Arrow, K. J. (1973): “Higher education as a filter”, Journal of Public economics, 2, págs. 193-216. -Barro, R.J. (2001): Human Capital and Growth, American Economic Review, 91, 1217. -Becker, G. (1964): Human Capital. Nueva York, Columbia University Press. -Cabrales, A., (2013): “PIAAC, el examen de PISA para adultos”. Nada es gratis, [online] 13 de Octubre. Available at: <http://nadaesgratis.es/cabrales/piaac-el-examen-de-pisa-para-adultos> [Accessed on 5 March 2015] -Card D. (1999). “The Causal Effect of Education on Earnings”, En Ashenfelter, O., D. Card (Eds.) Handbook of Labor Economics, volume 3, chapter 30. Elsevier. -Diamond, Arthur M., Jr. "Zvi Griliches's Contributions to the Economics of Technology and Growth." Economics of Innovation and New Technology 13, no.4 (June 2004): 365-97. -Duncan, G. & Hoffman, S.D. (1981): The Incidence and Wage Effects of Overeducation, Economics of Education Review, 1, 75-86.. -Ehrenberg, R.G. and Smith, R.S and (2012): Modern Labor Economics: Theory and Public Policy, 11th edition. Prentice Hall.. -Freire, M.J y Teijeiro, M., (2010). Las ecuaciones de Mincer y las tasas de rendimiento de la educación en Galicia. [pdf] Galicia. Available at: <http://2010.economicsofeducation.com/user/pdfsesiones/095.pdf>. 21.
(22) -Griliches, Z. (1977): “Estimating the return to schooling: some econometric problems”, Econométrica, 45, págs. 1-22. -Groot, W. & Maassen van den Brink, H. (2000): Overeducation in the Labor Market: A Meta-analysis. Economics of Education Review, 19, 145-158. -Heckman James J. (enero 1979) «Sample selection bias as a specification error»Econometrica. Journal of the Econometric Society (47): pp.153-161. -Mincer, J. (1974). Schooling, experience and earnings, National Bureau of Economic Research (NBER), Nueva York, Estados Unidos. -Neumark, D.: “Biases in Twin Estimates of the Return to Schooling: a Note on Recent Research”, en Economics of Education Review, 18 (1999), pp. 149-157. -OECD, (2014). Elementos principales de la evaluación (PIAAC). Available at: <http://www.oecd.org/piaaces/elementosprincipalesdelaevaluacionpiaac.htm> [Accessed on 30 April 2015] -PIAAC, (2013). Programa internacional para la evaluación de las competencias de la población adulta. [pdf] Madrid. Available at: <http://www.mecd.gob.es/dctm/inee/internacional/piaac/piaac2013vol2.pdf? documentId=0901e72b81736785> -Schultz, T.W. (1960): Capital Formation by Education, Journal of Political Economy, 69, 571-583 -Schultz, T.W. (1962): Investment in Human Capital, American Economic Review, 51, 1-17. -Solomon W. Polachek., (2007). Earnings Over the Lifecycle: The Mincer Earnings Function and Its Applications. [pdf] Germany. Available at: <http://ftp.iza.org/dp3181.pdf> -Wooldridge, J. M. (2010): Introducción a la Econometría: Un Enfoque Moderno, 4st ed. Madrid: Ed. CENGAGE Learning.. 22.
(23)
Figure

+2
Documento similar
The results of cointegration analysis also suggest that there is no evidence of long-term relationship between Qatar intra-trade with Bahrain, Saudi Arabia and the United
In the “big picture” perspective of the recent years that we have described in Brazil, Spain, Portugal and Puerto Rico there are some similarities and important differences,
Given that arthritis is one of the leading causes of functional disability in the elderly, and in spite of the fact that the literature about the relationship between
Finally, taking into account the degree of match between the education received by the worker and that required in the job, we found that the return to schooling is not uniform
In this line, Model 10 shows that the negative relationship between debt arrears and SAH is over and beyond the effects of the current economic condition of the
Here we can verify what we believe constitutes a paradox: the necessity of con- siderations of an ethical kind is imposed, but from that tradition of Economic Theory whose
50 The goal is to help people to reach an optimum level in the dimensions of psychological well- being: environmental mastery, personal growth, purpose in life,
This theoretical and empirical evidence allows us to go a step further in the B&B theory, in order to verify whether the relationship between positive emotions and resilience
