Caracterización microestructural y comportamiento tribológico de aleación ti6al4v anodizado
11
0
0
Texto completo
(2) Ingeniería y Competitividad, Volumen 16, No. 1, p. 295 - 305 (2014). 1. Introduction Titanium and its alloys are widely used as biocompatible materials for numerous orthopedic and dental applications due to their chemical stability within the human body, good strengthto-density ratio, fatigue resistance and formability (Leyens & Peters, 2003). The passive layer formed at the surface of these materials is responsible by their biocompatible behavior though outstanding tribological properties have not been obtained yet, which keeps the door open for improvements in terms of manufacturing processes and heat treatments (Lee et al., 2010). Among the options available to reduce friction and wear, surface treatments emerge as a cost-effective solution with positive results, which have already been reported in literature (Brunette et al., 2001; Leyens & Peters, 2003; Liu et al., 2004). A number of surface treatments, including chemical, thermal and electrochemical methods have been used to form a thin oxide layer on the metal surface(Biswas & Dutta Majumdar, 2009; Paital & Dahotre, 2009). The formation of the oxide layer improves wear resistance and reduces friction while helps promote osseointegration process in orthopedic implants (Kumar, Sankara Narayanan, Ganesh Sundara Raman, & Seshadri, 2010) and adhesive bonding in components for aerospace applications3. In particular, anodic oxidation is an electrochemical method generated by potentiostatic or galvanostatic process in strong acids such as H3PO4, H2SO4 and HF at high current density or potential. As a result, a thin oxide layer ranging from 200 to more than 1000 nm in thickness can be formed (Das, Bose, & Bandyopadhyay, 2007; Narayanan & Seshadri, 2007). The anodic layer in titanium alloys is constituted by stable anatase, brokite or rutile oxides. Titanium oxides have good ionic and insulating properties that increase adhesion with the metallic substrate and reduce adverse reactions into the human body (Leyens & Peters, 2003; Roessler et al., 2002). This oxide also exhibits low electronic conductivity, high corrosion resistance and. 296. thermodynamical stability at physiological pH values. The properties of the layer are strongly affected by the morphology, chemical composition and crystalline structure of the oxide(Song et al., 2009), which depend on the electrolyte type, concentration and current density used during the anodizing process(Kuromoto et al., 2007). Consequently, an adequate combination of such parameters allows obtaining the desired characteristics in the oxide layers (Afshar & Vaezi, 2004; Narayanan & Seshadri, 2007). It has been shown, for instance, that the presence of rutile-type titanium oxide can effectively inhibit adhesive effects in metal/metal and metal/UHMWPE tribological pairs and improve boundary lubrication while reducing wear rate (Dong & Bell, 2000). On the other hand, biocompatibility and bioactivity of titanium and titanium alloys can also be improved by anodizing, as shown, for instance, by Liu et al. Several authors (Das et al., 2007; Kumar et al., 2010; Narayanan & Seshadri, 2007) have developed anodizing processes of titanium alloys in phosphoric acid solution with a wide range of layer thicknesses (typically between 0.1 and 1.0 µm) and pore sizes from nanometric scale to around 100 µm, mainly for applications where elevated corrosion resistance is required. However, systematic results regarding tribological behavior of anodic layers are scarce and extensive experimental work is still to come on this matter. The aim of this work is to study the conditions to produce thicker passive layers on Ti6Al4V alloy surface by anodizing process, and to evaluate the influence of such conditions on the tribological behavior of the surface when it slides against UHMWPE in a pin-on-disc setup.. 2. Materials and methods 2.1 Anodizing process Ti6Al4V ELI alloy (ASTM F136) rods with 14 mm in diameter and Ultra-High Molecular Weight.
(3) Ingeniería y Competitividad, Volumen 16, No. 1, p. 295 - 305 (2014). Polyethylene UHMWPE (TIVAR 1000) discs with 220 mm in diameter and thickness of 5 mm were used in this work. The Ti6Al4V ELI alloy samples were ground in silicon carbide papers in successive grades from 600 to 1200 grit and ultrasonically cleaned in distilled water; the final polishing was performed using alumina suspension of 1 µm. The electrolytic cell for the anodizing process was composed by a Ti6Al4V ELI disc anode and a Ti (cp) plate used as cathode. The coatings were obtained by galvanostatic anodizing with a current density of either 10 or 15 mA/cm2 in 0.3M H3PO4 solution and anodizing times of 15, 45 and 90 minutes at room temperature. Table 1 summarizes all the anodizing conditions studied. Table 1.Anodizing conditions of Ti6Al4V ELI samples. 2.2. Microstructure characterization The microstructure of the oxide layer was characterised by Optical Microscopy (OM), Scanning Electron Microscopy (SEM) and X-Ray Diffraction (XRD). The thickness of the oxide layer was determined by SEM measurements on the cross–sectional view of the samples. Surface roughness of all samples was measured with the aid of a Surftest SV-3000 roughness tester (Mitutoyo instruments, Tokyo, Japan) over a sampling length of 10 mm. The results were presented in terms of the following parameters: Ra, (arithmetic mean deviation of the roughness profile), Rq (root mean square roughness) and Rsk (Skewness). A total of 5 measurements from each sample were analyzed.. Anodizing time. Current Density. 2.3 Tribological tests. Sample ID. w(min). (mA/cm2). M1. 15. 10. M2. 45. 10. M3. 90. 10. M4. 15. 15. M5. 45. 15. M6. 90. The pin-on-disc testing machine (ASTM G99) was used to evaluate the wear and friction behavior of UHMWPE against the modified Ti6Al4V alloy under lubricated conditions in Ringer’s solution. The normal load employed was 15 N which yielded a nominal contact pressure of 0.10 MPa with a relative speed of 0.3 m/s. The test duration for each sample was 60 min. The mass loss of the pins was measured by using a balance with resolving power of 0.01 mg.. SM. 15 Untreated. Figure 1.Variation of the potential as function of time during anodizing in 0.3M of H3PO4 solution with a current density of a) 10mA/cm2, and b) 15 mA/cm2.. 297.
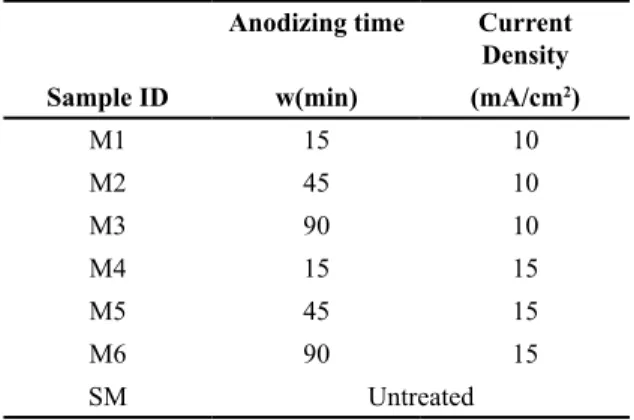
(4) Ingeniería y Competitividad, Volumen 16, No. 1, p. 295 - 305 (2014). 3. Results and discussion 3.1 Effect of anodizing conditions on the oxide layer formation Figure 1 shows the curves of potential as a function of anodizing time in 0.3M H3PO4 solution for 15, 45 and 90 minutes with current densities of 10 and 15 mA/cm2. It was found that the maximum peak in the potential curve for samples anodized at 10 mA/ cm2 corresponded to 270 V, while the stabilization potential was around 190 V. On the other hand, when a current density of 15 mA/cm2 was applied, a significant fluctuation in the potential curves occurred and the maximum potential peak was circa 240 V. After reaching the maximum potential all the samples exhibited dielectric breakdown as a consequence of the massive release of electrons that are injected at the electrolyte/oxide interface, which also affected the oxide layer thickness limit(Afshar & Vaezi, 2004). 3.2 Morphological features of the layers Figure 2 shows the typical aspect of the anodized surfaces obtained Figure 2a and 2b show the top. surface of specimens anodized at 10 mA/cm2 for 15 and 90 minutes and Figure 2c and 2d show the top surface of specimens anodized at 15 mA/cm2 for 15 and 90 minutes. Figure 2e shows the top surface on the Ti6Al4V untreated, this alloy is constituted by two phases: an α matrix phase (light zones), and a β phase scattered in the β matrix with darker tones. The anodized surfaces were rough with a flowery pattern. The layers obtained with lower current density have uniform porosity with average pore size ranging between 0.6 and 0.8 um. On the other hand, the layers produced with higher current density presented heterogeneous morphology, with smaller average pore size (Table 2). Uniform growth of the oxide layer was observed in samples anodized for 15 and 45 minutes, while in samples treated for 90 minutes a more heterogeneous structure was formed, presumably as a consequence of dielectric breakdown and oxide formation/ dissolution processes. During anodizing, phosphorous ions from the electrolyte are incorporated into the oxide layer, which makes possible the formation of P-enriched deposits as it was verified by EDXS analysis (See Table 2). Phosphorous concentrations of about 7-7.8 wt.% were found in the oxide layers, with a trend to increase with the anodizing time. The. Figure 2. General aspect of the surface of samples anodized in H3PO4 (0.3M) solution, a)10mA/cm2 -15 minutes, b) 10mA/cm2 -90 minutes, c) 15mA/cm2 -15 minutes, d) 15mA/cm2 -90 minute e) Untretaed Ti6Al4V.. 298.
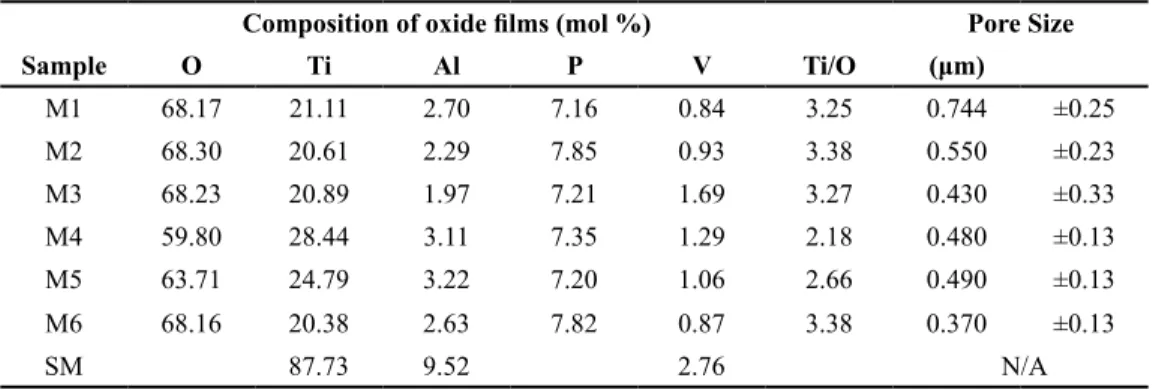
(5) Ingeniería y Competitividad, Volumen 16, No. 1, p. 295 - 305 (2014) Table 2. Localized chemical composition measurements of the anodized surfaces (EDXS) and Pore size of anodic oxide films. Composition of oxide films (mol %) Sample. O. Ti. Al. P. Pore Size V. Ti/O. (μm). M1. 68.17. 21.11. 2.70. 7.16. 0.84. 3.25. 0.744. ±0.25. M2. 68.30. 20.61. 2.29. 7.85. 0.93. 3.38. 0.550. ±0.23. M3. 68.23. 20.89. 1.97. 7.21. 1.69. 3.27. 0.430. ±0.33. M4. 59.80. 28.44. 3.11. 7.35. 1.29. 2.18. 0.480. ±0.13. M5. 63.71. 24.79. 3.22. 7.20. 1.06. 2.66. 0.490. ±0.13. M6. 68.16. 20.38. 2.63. 7.82. 0.87. 3.38. 0.370. ±0.13. 87.73. 9.52. SM. formation of such deposits on the surface has been reported to cause inhibition of oxide dissolution during anodizing as well as to promote the formation of calcium phosphate, which increases biocompatibility(Song et al., 2009).. 2.76. N/A. stability, adherence and biocompatibility (Bandyopadhyay et al., 2010). Titanium monoxide is hard, soluble in acids and presents high corrosion resistance, while Ti2O3 is denser and has reducer and semiconductor character,. Figure 3. X-ray diffraction patterns of anodized sample surfaces.. Figure 3 shows the XRD patterns of the anodized surfaces. The coatings obtained at 10 and 15 mA/ cm2 revealed the presence of TiO, Ti2O3 and TiO2 peaks. These peaks are characteristic of anatase and rutile crystalline structures(Diamanti & Pedeferri, 2007). The rutile phase formed is expected to contribute to densification of the layer and improvement in properties such as chemical. which could generate decomposition of organic molecules into CO2 and H2O. 3.3 Roughness and thickness of the layers Table 3 shows the results of roughness measurements performed on the different surfaces studied in this work. The Ra of the untreated surface was around. 299.
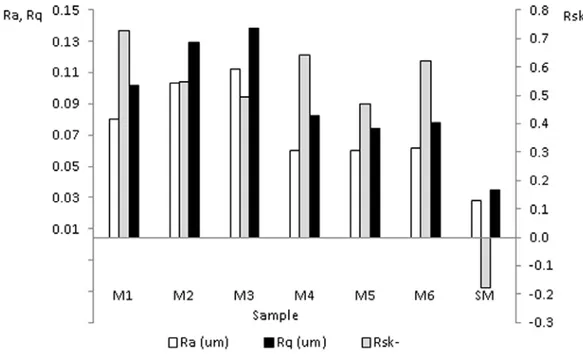
(6) Ingeniería y Competitividad, Volumen 16, No. 1, p. 295 - 305 (2014). Figure 4. Surfaces Roughness parameters Ra, Rq and Rsk of anodized samples.. 0.02 µm and increased to 0.05 - 0.1 µm after the anodizing process depending on the current density employed. With respect to the effect of testing time, no significant variation of roughness parameters was observed when the current density was 15 mA/ cm2, while in the tests run with 10 mA/cm2, a slight increase in Ra was registered for longer times. Kuromoto et al. found a way to achieve lower values of Ra by working with low concentrations of the electrolyte and voltages below the dielectric breakdown, which resulted in smoother layers and reduced porosity (Bandyopadhyay et al., 2010; Kuromoto et al., 2007). In this work the dielectric breakdown was exceeded in all the anodizing. procedures, which resulted in more porous layers for the same electrolyte concentration. It is worth noticing that Ra and Rq did not show significant variations with time when a current density of 15 mA/cm2 was used, while Rsk showed a minimum relative for 45 minutes of anodizing time. On the other hand, for a current density of 10 mA/cm2, Ra and Rq increased and Rsk decreased with anodizing time (See Figure 4). In opposition to the untreated sample, the anodized surfaces always showed positive values of Rsk. This brings, among other consequences, a reduction in both fatigue resistance and load bearing capacity of the surfaces and therefore affects their tribological performance.. Table 3. Surface roughness and thickness of anodic oxide film of Ti6Al4V as a function of the anodizing conditions. Roughness parameter Sample. 300. Ra(µm). Rq(µm). Rsk. Rku. Thickness(µm). M1. 0.07±0.005 0.09±0.007. 0.73±0.095. 3.58±1.054. 0.81±0.10. M2. 0.09±0.003 0.12±0.005. 0.54±0.183. 3.48±0.382. 0.87±0.15. M3. 0.10±0.007 0.13±0.008. 0.49±0.077. 3.15±0.041. 0.55±0.07. M4. 0.05±0.011 0.07±0.029. 0.64±0.128. 4.37±0.501. 0.67±0.08. M5. 0.05±0.004 0.07±0.005. 0.46±0.101. 3.39±0.251. 0.71±0.10. M6. 0.05±0.005 0.07±0.006. 0.62±0.056. 3.61±0.197. 0.59±0.13. SM. 0.02±0.004 0.03±0.005 m-0.17±0.165 3.10±0.203. N/A.
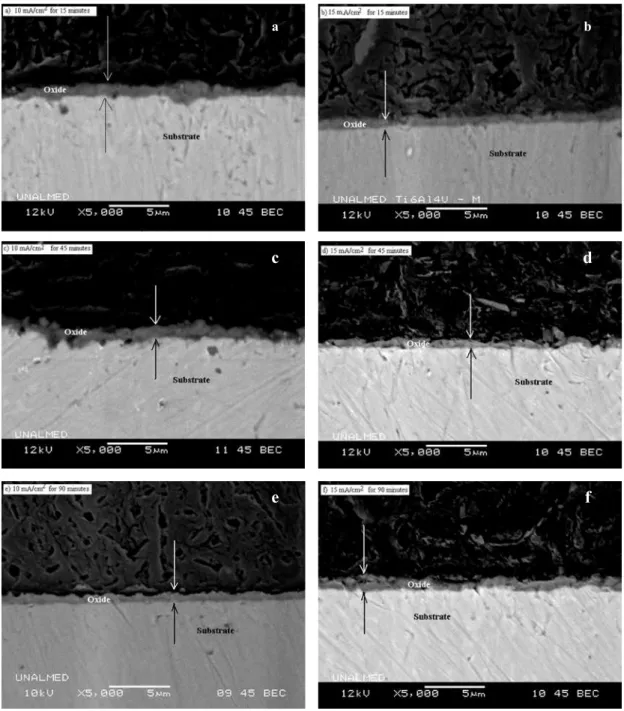
(7) Ingeniería y Competitividad, Volumen 16, No. 1, p. 295 - 305 (2014). a. b. c. d. e. f. Figure 5. Cross-sectional views of anodic layers produced in H3PO4 (0.3M) at 10 mA/cm2 (left) and 15 mA/cm2 (right) for a,b) 15 min, c,d) 45 min and e,f) 90 min. SEM.. A typical SEM image of the cross section of the anodized layer is shown in Figure 5. Variations in thickness for different current conditions (10 and 15 mA/cm2) are shown in Table 3, where a decrease in t hickness is observed with the increase in current density and anodizing time. This effect could be related to phosphorous deposition on the anodized surface, given that this element. inhibits oxide dissolution and limits the growth of the oxide layer as well (Afshar & Vaezi, 2004; Narayanan & Seshadri, 2007) . This is particularly relevant for biomedical applications since it has been shown that the content of phosphorous in the oxide layer can increase the biotolerance of implants (Simka et al., 2011; Song et al., 2009).. 301.
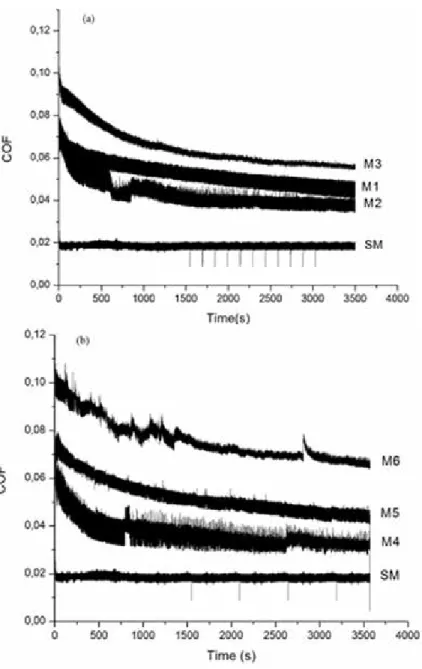
(8) Ingeniería y Competitividad, Volumen 16, No. 1, p. 295 - 305 (2014). Figure 6. Variation of COF of UHMWPE sliding against Ti6Al4V and anodized Ti6Al4V counter faces, under Ringer’s solution lubrication for current densities of a) 10 mA/cm2 and b)15 mA/cm2 and anodizing times of 15, 45 and 90 minutes. Untreated sample (SM) is shown for comparison.. 3.4 Friction and wear behavior Variation of the Coefficient of Friction (COF) of UHMWPE sliding against either untreated or anodized Ti6Al4V under lubricated condition is shown in Figure 6. The average values of COF obtained in the above conditions were 0.06 for treated samples, compared with 0.02 of untreated sample.. 302. In anodized samples either with 10 or 15 mA/ cm2, the COF increased with the anodizing time, which is consistent with the increase in roughness of the surface. In addition, with the increase in anodizing time, the pore size decreases probably as a consequence of the inhibition of oxide growing due to formation of the double layer. The most stable layer was observed in M2 sample. The coefficient of friction was high at the initial stages,.
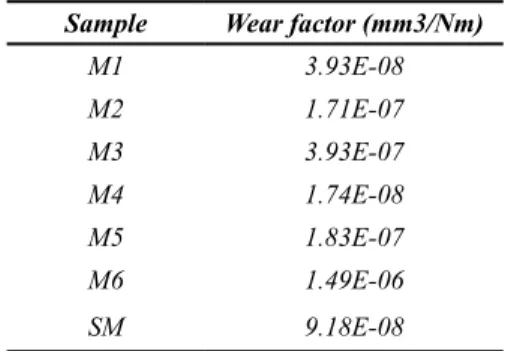
(9) Ingeniería y Competitividad, Volumen 16, No. 1, p. 295 - 305 (2014). but decreased as the test progressed. The COF of samples anodized with 10 mA/cm2 showed a more uniform behaviour, with lower values than those observed in samples anodized with 15 mA/cm2. At the end of the tests, small polymeric particles were adhered to the substrate and full detachment of the film occurred. As a consequence of film damage, the oxide particles are transferred to the interfacial medium and the COF is higher than that measured in the tests performed with untreated samples(Jacobson & Hogmark, 2009; Yildiz, Yetim, Alsaran, & Efeoglu, 2009). Table 4 shows that the wear factors measured after the pin-on-disc tests increased with anodizing time and current density. The untreated samples had higher wear resistance than all the anodized samples with the sole exception of the M1 specimen (10 mA/cm2 for 15 min). Table 4. Wear factor of anodic oxide film of Ti6Al4V in contact with UHMWPE. Pin-on-disc test. Sample. Wear factor (mm3/Nm). M1. 3.93E-08. M2. 1.71E-07. M3. 3.93E-07. M4. 1.74E-08. M5. 1.83E-07. M6. 1.49E-06. SM. 9.18E-08. (Sedlacek, Podgornik, & Vizintin, 2009) and (Diebold, 2003) found that low Ra values with negative Rsk can be related to low COF values. In this investigation low COF were found in untreated samples, which is consistent with the findings of the mentioned authors. Comparing the roughness parameters with COF and wear factors, it was found that friction and wear increased with Ra and Rq. On the other hand, an inverse relation between Rsk and wear was also established. This effect can be related to the positive effect of having a surface with shallower valleys on the lubricating action of Ringer’s solution.. 4. Conclusions The results from this study show that anodizing of Ti6Al4V alloy in 0.3M H3PO4 solution allowed obtaining an oxide layer with a porous structure characterised by a flowery pattern and average pore size between 0.5 and 0.8 µm. These values of pore size are smaller than those typically found in the literature for a wide range of anodizing conditions. All the anodizing conditions studied led to an increase in the average roughness of the samples with respect to the untreated condition. Besides, the average roughness was higher when the current density used was 10 mA/cm2. The anodizing samples were formed mainly of Ti2O3 and TiO2 structures on the surfaces. Both currents conditions showed similar structures, with higher intensity in the diffraction peaks of 15 mA/cm2 condition. In pin-on-disc tests, all the anodized samples showed higher COF than the untreated sample. The COF for anodized samples was high at initial stages, but decreased as the tests progressed. The detachment of the oxide film was progressive and the highest COF values and wear factors were found in samples with finer oxide layers; the fragility of the films and the porosity present favored this effect. The chemical composition of the oxide layers was very similar in all the samples studied.. 5. Acknowledgements M.M. Cely would like to recognize and express gratitude for the financial support made possible by Universidad Autónoma del Caribe in Barranquilla, Colombia, through doctoral fellowship.. 6. References Afshar, A., & Vaezi, M. (2004). Evaluation of electrical breakdown of anodic films on titanium in phosphate-base solutions. Surface and Coatings Technology 186(3), 398–404.. 303.
(10) Ingeniería y Competitividad, Volumen 16, No. 1, p. 295 - 305 (2014). Bandyopadhyay, A., Espana, F., Balla, V. K., Bose, S., Ohgami, Y., & Davies, N. M. (2010). Influence of porosity on mechanical properties and in vivo response of Ti6Al4V implants. Acta biomaterialia 6(4), 1640–8. Biswas, A., & Dutta Majumdar, J. (2009). Surface characterization and mechanical property evaluation of thermally oxidized Ti-6Al-4V. Materials Characterization 60(6), 513–518. Brunette, D., Tengvall, P., & Textor, M. (2001). Titanium in medicine (p. 1005). Heidelberg: Springer-Verlag Berlin. Das, K., Bose, S., & Bandyopadhyay, A. (2007). Surface modifications and cell-materials interactions with anodized Ti. Acta biomaterialia 3(4), 573–85. Diamanti, M. V., & Pedeferri, M. P. (2007). Effect of anodic oxidation parameters on the titanium oxides formation. Corrosion Science 49(2), 939–948. Diebold, U. (2003). The surface science of titanium dioxide. Surface Science Reports 48(58), 53–229. Dong, H., & Bell, T. (2000). Enhanced wear resistance of titanium surfaces by a new thermal oxidation treatment. Wear 238(2), 131–137. Jacobson, S., & Hogmark, S. (2009). Surface modifications in tribological contacts. Wear 266(34), 370–378. Kumar, S., Sankara Narayanan, T. S. N., Ganesh Sundara Raman, S., & Seshadri, S. K. (2010). Thermal oxidation of Ti6Al4V alloy: Microstructural and electrochemical characterization. Materials Chemistry and Physics 119(1-2), 337–346. Kuromoto, N., Simao, R., & Soares, G. (2007). Titanium oxide films produced on commercially pure titanium by anodic oxidation with different. 304. voltages. Materials Characterization 58(2), 114–121. Lee, K., Choe, H.-C., Kim, B.-H., & Ko, Y.-M. (2010). The biocompatibility of HA thin films deposition on anodized titanium alloys. Surface and Coatings Technology 205, S267–S270. Leyens, C., & Peters, M. (2003). Titanium and Titanium Alloys. Fundamentals and Applications. (p. 426). Weinheim: Wiley-VCH. Liu, X., Chu, P., & Ding, C. (2004). Surface modification of titanium, titanium alloys, and related materials for biomedical applications. Materials Science and Engineering: R: Reports 47(3-4), 49–121. Narayanan, R., & Seshadri, S. K. (2007). Phosphoric acid anodization of Ti–6Al–4V – Structural and corrosion aspects. Corrosion Science 49(2), 542–558. Paital, S. R., & Dahotre, N. B. (2009). Calcium phosphate coatings for bio-implant applications: Materials, performance factors, and methodologies. Materials Science and Engineering: R: Reports 66(1-3), 1–70. Roessler, S., Zimmermann, R., Scharnweber, D., Werner, C., & Worch, H. (2002). Characterization of oxide layers on Ti6Al4V and titanium by streaming potential and streaming current measurements. Colloids and Surfaces B: Biointerfaces 26(4), 387–395. Sedlacek, M., Podgornik, B., & Vizintin, J. (2009). Influence of surface preparation on roughness parameters, friction and wear. Wear 266(3-4), 482–487. Simka, W., Sadkowski, A., Warczak, M., Iwaniak, A., Dercz, G., Michalska, J., & Maciej, A. (2011). Characterization of passive films formed on titanium during anodic oxidation. Electrochimica Acta 56(24), 8962–8968..
(11) Ingeniería y Competitividad, Volumen 16, No. 1, p. 295 - 305 (2014). Song, H.-J., Park, S.-H., Jeong, S.-H., & Park, Y.J. (2009). Surface characteristics and bioactivity of oxide films formed by anodic spark oxidation on titanium in different electrolytes. Journal of Materials Processing Technology, 209(2) 864–870.. Yildiz, F., Yetim, a. F., Alsaran, a., & Efeoglu, I. (2009). Wear and corrosion behaviour of various surface treated medical grade titanium alloy in biosimulated environment. Wear 267(5-8), 695–701.. 305.
(12)
Figure
+4
Documento similar
For a better comprehension of the results obtained, Figure 7 shows the conversion/emission nitrogen oxide values together with the photocatalytic NO X abatement
This results shows that to measure the proximity effect using the present experimental configuration, the sample should hold following conditions; (1) graphene layer lying on a
The lower panel shows a plot of the intensity of the light scattered by a sample of superparamagnetic nanobars of manganese-iron oxide as a function of the angle of orienta- tion of
Figure 1 shows the detection time and the energy of neutrino event candidates passing the reduction cuts for GW150914 (left) and the energy spectrum of the remaining events, which
Figure 3 shows the evolution of the uncertainties in the background prediction, before the fit to the invariant mass distribution described in section 8, as a function of m γγ in
Propagation 35–37 method, ADMP, as implemented in the Gaussian09 Package 38 (see Methods). Figure 3a shows the calculated number of trajectories as a function of the migration time
The draft amendments do not operate any more a distinction between different states of emergency; they repeal articles 120, 121and 122 and make it possible for the President to
The idea of the proof is the implementation of the infinite dimensional Implicit Function theorem to F around the initial solution F (0, V 0 , 0) = 0 (in the case of = 1), and
