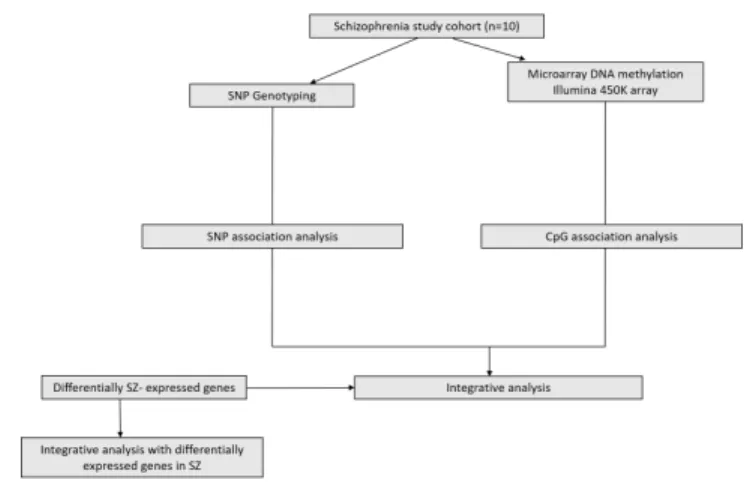
Integrative analysis of DNA methylation and gene expression in Schizophrenia
Texto completo
Figure


Documento similar
The BWT starts from one end of the read, trying to align as many nucleotides (nts) of the read as possible to a sequence of the ref- erence genome, until an EID is found. Figure
Our results suggest that changes in leptin receptor gene expression in white adipose tissue, as indicated by ObRa mRNA expression data pre- sented herein, might contribute to
In chapter 3, the overview and challenges of integrative –omics analysis and the main statistical methods that have been used for data integration is described and in chapter
The genes that were included in group 2 (apoptosis and cell senescence) were the most frequently altered in the present meningioma study, as 7 out of 14 (50%) genes were abnormally
Taken together, miRNA and mRNA expression analysis identified a large number of miRNAs and genes in resistance arteries that are differentially expressed upon maturation, some of
tutorials for (i) normalization using DNMAD, (ii) data pre- processing using the Preprocessor tool, (iii) data clustering using the different algorithms available (UPGMA, SOM,
GEPAS is composed of different interconnected modules which include tools for data pre-processing, two-conditions com- parison, unsupervised and supervised clustering (which
Stratified analysis was performed to evaluate differences in gene expression between metritic and healthy cows with NanoString R results, thus removing all data from treated


