Direct measurement of homovanillic, vanillylmandelic and 5 hydroxyindoleacetic acids in urine by capillary electrophoresis / C Barbas [et al ]
11
0
0
Texto completo
(2) Journal of Chromatography A, 871 (2000) 341–350 www.elsevier.com / locate / chroma. Direct measurement of homovanillic, vanillylmandelic and 5-hydroxyindoleacetic acids in urine by capillary electrophoresis b ´ a , M. Heinanen ¨ ´ c , C. Barbas a , * A. Garcıa , L.M. Jimenez a. ´ ´ Monteprıncipe ´ , Universidad San Pablo-CEU Urbanizacion , Ctra. Boadilla del Monte, Facultad de CC Experimentales y Tecnicas km 5,3, 28668 Madrid, Spain b Analytical Chemistry Department, Helsinki University, Helsinki, Finland c ´ Hospital, Seville, Spain Virgen del Rocıo. Abstract Separation conditions in CE, with a neutral coated capillary and reversed polarity, have been optimised to make direct measurement of vanillylmandelic acid, homovanillic acid and 5-hydroxyindoleacetic acid possible in urine samples without pre-treatment. The method developed has been validated, presenting adequate parameters for linearity, accuracy and precision. Detection limits range from 0.03 to 2.5 mM. Finally the method has been applied to urine samples taken from patients, both adults and children, in hospital. Some of them were also measured by immunoassay and HPLC– electrochemical detection and results have been compared. 2000 Elsevier Science B.V. All rights reserved. Keywords: Homovanillic acid; Vanillylmandelic acid; Hydroxyindoleacetic acid; Organic acids; Catecholamines. 1. Introduction Homovanillic (HVA) and vanillylmandelic (VMA) acids, the major metabolites of catecholamines, are often tested in urine for neurologic diagnosis and for monitoring the response to therapy in illnesses like phaeochromocytoma and neuroblastoma [1–3]. Low-cost methods are necessary to satisfy the rising demand for mass screening in childhood [4] because, if detected early enough, neuroblastoma is a curable tumour. Moreover, a second area of clinical pathology that involves the cardiovascular system (hypertension, hypotension) is also related to these metabolites [5] and so the demand for their measurement is increasing. On the other hand, intestinal tumours, which *Corresponding author. Fax: 134-91-3510-475. E-mail address: [email protected] (C. Barbas). secrete large amounts of serotonin, are often discovered by the enhanced urinary excretion of 5-hydroxyindoleacetic acid (HIA) [6]. Different high-performance liquid chromatography (HPLC) methods have been described mainly employing ion-pair reversed-phase chromatography with electrochemical [7–9] or fluorimetric detection [6,10], but all of them include sample pretreatment with solid-phase or liquid extraction, which is time consuming and a source of errors, as can be seen in the recoveries shown in the aforementioned studies. Although initial capillary gas chromatographic methods [11] were substituted by HPLC, which is simpler and does not need derivatisation, the increasing introduction of mass spectrometry (MS) with greater specificity and selectivity than other detection methods has enlarged GC–MS use with this application [12–14]. Recently, immunoassay has replaced many of the. 0021-9673 / 00 / $ – see front matter 2000 Elsevier Science B.V. All rights reserved. PII: S0021-9673( 99 )00994-2.
(3) 342. ´ et al. / J. Chromatogr. A 871 (2000) 341 – 350 A. Garcıa. chromatographic methods, but crossed reactivity often makes the determinations semi-quantitative [15] and monoclonal antibodies are expensive. The use of capillary electrophoresis (CE) in routine clinical laboratory work is increasing and it provides an alternative with advantages such as simplicity, low volume reagent consumption, low volume sample requirements and the possibility of analysing without sample pretreatment in many cases, with the corresponding automation and decreased technician costs. Most of the evaluation of CE as a clinical tool has been focused on serum proteins [16], but there are many areas where CE can replace the conventional methodology. Isaaq et al. [17] have previously described a capillary zone electrophoresis (CZE) method for HVA and VMA measurement in infant urine samples after extraction with ethyl acetate. Since the concentration in the urine samples of healthy infants is less than the detection limit, a concentration step is also necessary with this method. Caslavska et al. [18] have developed a method based on micellar electrokinetic capillary chromatography (MECC) for urinary indole derivatives and catecholamine metabolites with fluorescence detection by direct injection of plain or diluted samples. The fluorescence detector has a higher sensitivity, although it costs more than a UV detector, and the paper does not give much data about validation parameters. On the other hand, Shirao et al. [19] recently published another micellar electrokinetic chromatographic method including VMA and HVA, but not HIA. Reproducibility requires capillary conditioning and anyway the relative standard deviations (RSDs) of the peak areas are not very good. Correlation coefficients, in linearity assay, do not reach 0.99 for some analytes and recoveries are not shown. As only spiked samples are treated the method is intended for detecting clearly pathological situations during routine mass screening of pheochromocytoma and neuroblastoma. The aim of the present work was to optimise the pH of the running buffer in CE, evaluating also the need to add organic modifiers to make possible direct measurement of VMA, HVA and HIA in urine samples in both normal and pathological values, without pre-treatment and separating vanillic acid (VA) as usual interference. The method developed has been validated and applied to urine samples from. adults and infants in good or bad health. Some of them were also measured by immunoassay and HPLC–electrochemical detection (ED) and results have been compared.. 2. Materials and methods. 2.1. Chemicals and samples The organic acids used as standards were from Sigma (St. Louis, MO, USA), phosphoric acid and sodium hydroxide were from Panreac (Barcelona, Spain) and methanol and acetic acid were from Scharlau (Barcelona, Spain). Monoclonal Enzymelinked Immunoabsorbent Assay Kits for HVA and VMA were from Yamasa Shoyu (Chiba, Japan). The calibration urine for method development and validation was from 10 healthy volunteers in our own laboratory, pooled together, and stored at 2208C until analysis. The standards, in the levels indicated below, were added to this urine to obtain the test sample.. 2.2. Instrumentation and method The separation was performed on a P/ACE CE system (Beckman, Palo Alto, CA, USA) with UV detection at 192 nm. The injection was by pressure (3.3 bar) for 5 s and a neutral coated capillary (Beckman, Madrid, Spain) of 37 cm350 mm I.D. at 210 kV potential was used. The remaining conditions were optimised during method development. Finally, conditions where peaks appear with enough resolution from other peaks in real samples to permit quantification were 0.170 M phosphate–0.050 M acetate buffer made up to pH 4.4 to 4.2 with NaOH and with 10% (v / v) methanol added and 4.3 to 4.2 with 5% (v / v) methanol.. 2.3. Validation Individual stock solutions of each organic acid 200 mM in water were prepared and stored at 2208C with this concentration. On the day of the analysis they were diluted as needed. Linearity of response for standards was tested by assaying in triplicate six levels of concentrations,.
(4) ´ et al. / J. Chromatogr. A 871 (2000) 341 – 350 A. Garcıa. ranging from normal to medium pathological, that is from 3 mM to 98 mM. Linearity of response for samples was tested in the same way but replacing water with urine. Recovery was estimated comparing the values found in the study of linearity of the calibration urine, with those of the standards linearity, taking into account the endogenous urinary concentrations, which had been previously quantified. Within-day precision was tested both to check the constancy of instrumental response to a given analyte and the concentration and migration time repetitiveness, since the latter is a key parameter for peak assignment. For this purpose, the assay was performed with 10 solutions of standards and 10 of samples, in the medium concentration of the calibration curve 12 mM for all the compounds. For intermediate precision, different persons measured three or four standards and samples on different days up to a total number of 22. Limits of detection were calculated by extrapolating to zero concentration the standard deviations of the last three points of linearity in both standards and samples and interpolating this value in the corresponding equation. When differences between standards and samples appeared, the higher value was taken.. 2.4. Measurement of samples ´ Hospital (Seville, Spain) The Virgen del Rocıo kindly provided us with urine samples from patients, both adults and infants and the assay received the approval of the ethics committee. Samples were collected for 24 h with 10 ml of 6 M HCl added per litre and stored at 2208C until the analysis. On the day of the analysis samples were defrosted, vortexed, centrifuged at 3000 g for 5 min and diluted 1:1 with purified water. They were then injected twice and they were measured the same day as the standards corresponding to the medium point of the calibration graph. In order to compare results the same samples were also analysed by HPLC–ED following the method of Brandsteterova´ et al. [8] with minor modifications and with enzyme immunoassay (EIA). The main modification in the HPLC method was sample pretreatment which was carried out, in this case, with. 343. a strong anionic exchange column (Hema-100 BioQ) instead of alumina.. 3. Results and discussion The electrolyte buffer is one of the most important and flexible variables in CZE. The pH, the concentration, the type of buffer and the presence of modifiers can all significantly influence the selectivity, sensitivity, the efficiency, and the speed of separation [20]. Previous studies in our laboratory with short-chain organic acids [21,22] had shown that neutral capillaries yield superior reproducibility in migration times and a more steady baseline than fused-silica capillaries. Moreover, phosphate proved to be the best option as a background electrolyte due to its pKa , which makes work in the widest pH range possible and due to its transparency in the low UV region. However, when working around pH 4, the buffer capacity of phosphate is minimal, so a small amount of acetic acid was added to improve it, without greatly increasing the background absorbance at 200 nm. During the development of previous works, quoted above, ionic strength of the electrolyte buffer was adjusted to get a higher sensitivity and efficiency with different urine samples, making use of a possible stacking effect. Therefore, only a small quantity of phosphate has been substituted by acetate. Finally, when it was observed that only a small increase in resolution was needed, the addition of small amounts of methanol was also assayed as it is known to reduce the electroosmotic flow and this could result in a better resolution. The pH separation conditions were first optimised for standards. Fig. 1 shows the mobility of the three analytes plus VA vs. pH. VA was added mainly because it is a frequent interference coming from intake. In Fig. 1 it can be seen that at pH 8.0 only VA is resolved and from pH 8.0 to pH 5.0 some of them always overlap. Around pH 5 there are different pH values where all the analytes are separated, while at pH 4.0 some of them overlap again. Moreover, the migration times of HVA and HIA at pH 4.0 are too high (over 40 min), because their pKa values are 4.3 and 4.7, respectively [23] and at this pH, compounds are very weakly ionised. Hence, the range from pH.
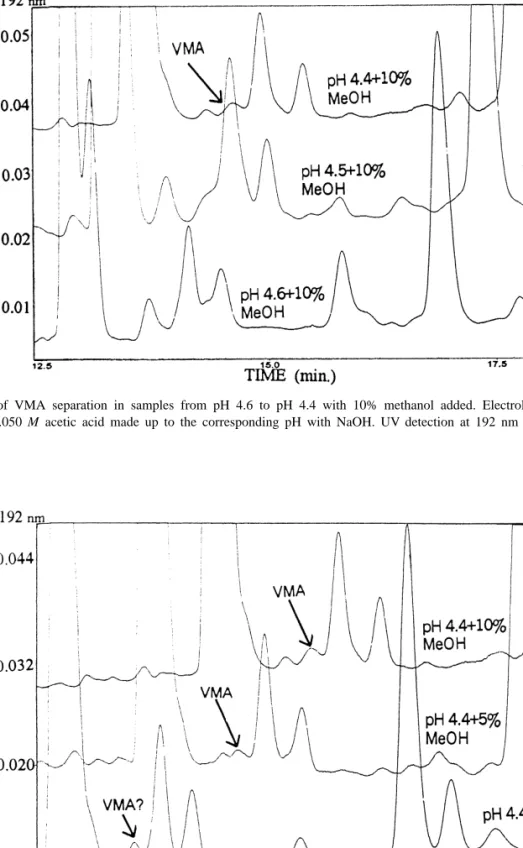
(5) 344. ´ et al. / J. Chromatogr. A 871 (2000) 341 – 350 A. Garcıa. Fig. 1. Standards mobility vs. pH. Electrolyte buffer: 0.170 M phosphoric acid made up to the corresponding pH with NaOH from pH 8.0 to pH 6.0 and 0.170 M phosphoric acid–0.050 M acetic acid made up to pH with NaOH for pH 5.0 and 4.0. UV detection at 192 nm and 210 kV applied potential. s: AV, h: AVM, n: AHV and 3: AHI.. 5.0 to pH 4.0 was assayed in more detail. Increments of 0.1 in pH were processed and results can be seen in Fig. 2A. As could be expected, samples present different interferences, so that at this stage a pool of urine samples were processed in parallel with the standards and at the same time the samples with standards added were also processed for a more sure identification of the peaks. Resolutions between each analyte and other peaks in the sample are found in Fig. 2 in parallel with standards. As an example, the gradual development of VMA separation in samples, which is the problematic, is shown in Fig. 3 for pH 4.6 to 4.4 with 10% methanol added. Electrolytes were phosphate–acetate and they made up the corresponding pH with NaOH, on its own or with 5% (Fig. 2B) and 10% methanol (Fig. 2C). It is worth noting here the importance of the information obtained by this scanning of pH, when for example, apparently pure peaks split into two or even three when varying pH, as could be seen in Fig. 3 or by adding methanol as can be observed in Fig. 4. As could be expected, the addition of methanol as a modifier increases retention times, but, in some cases, as here, it gives a better resolution. For each pH, standards were run individually to ensure of their position, because the impact of small pH. changes in the buffer near the pKa value of weak acidic solutes is significant and the elution order could change. Analyte peaks in samples were identified both by retention times and by spiking. To sum up, the conditions in which peaks appear with enough resolution from other peaks in samples to permit quantification were 0.170 M phosphate–0.050 M acetate buffer made up to pH 4.4 to 4.2 with NaOH and with 10% (v / v) methanol added as well as 4.3 to 4.2 with 5% (v / v) methanol. For validation pH 4.4 with 10% (v / v) methanol was chosen, because it presented the better resolution to time of analysis ratio. Under such conditions separation is shown in Fig. 5 for, firstly, a pool of urine samples from healthy people, secondly, standards and, finally, a sample of the same urine pool with standards added. There is a small range of conditions yielding good resolution, so the accuracy in buffer pH is critical for the separation.. 3.1. Validation As shown in Table 1, standards fit the linear model (r.0.99) for the three organic acids and no bias was found, except for VMA. Although it has statistical significance, it has no practical conse-.
(6) ´ et al. / J. Chromatogr. A 871 (2000) 341 – 350 A. Garcıa. 345. Fig. 2. (A) 0.170 M phosphoric acid and 0.050 M acetic acid made up to the corresponding pH with NaOH. (B) As A but 5% methanol added. (C) As A but 10% methanol added. UV detection at 192 nm and 210 kV applied potential. On the right resolution with respect to the nearest peak in samples: 0: no resolution, 1: resolution.half height, 11: complete resolution. s: AV, h: AVM, n: AHV and 3: AHI..
(7) 346. ´ et al. / J. Chromatogr. A 871 (2000) 341 – 350 A. Garcıa. Fig. 3. Development of VMA separation in samples from pH 4.6 to pH 4.4 with 10% methanol added. Electrolyte buffer: 0.170 M phosphoric acid and 0.050 M acetic acid made up to the corresponding pH with NaOH. UV detection at 192 nm and 210 kV applied potential.. Fig. 4. Effect of methanol addition on VMA peak resolution in urine samples at pH 4.4. Electrolyte buffer: 0.170 M phosphoric acid and 0.050 M acetic acid made up to the corresponding pH with NaOH. UV detection at 192 nm and 210 kV applied potential..
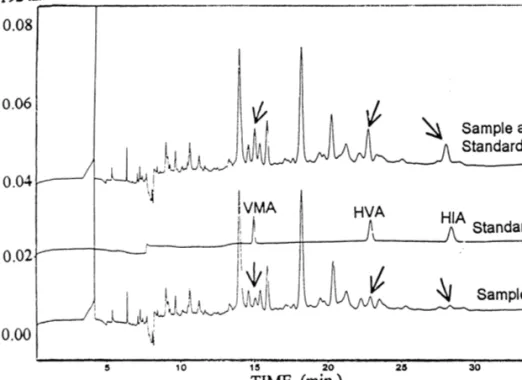
(8) ´ et al. / J. Chromatogr. A 871 (2000) 341 – 350 A. Garcıa. 347. Fig. 5. Electropherograms of a pool of urine from 10 healthy people, standards and the same urine pool with the standards added. Electrolyte buffer: 0.170 M phosphoric acid and 0.050 M acetic acid made up to pH 4.4 with NaOH and 10% methanol added. UV detection at 192 nm and 210 kV applied potential.. Table 1 Main validation parameters of the method VMA. HVA. HIA. Intercept Slope r. 211 62467942 18396113 0.995 3–98. 61462044 2147642 0.9995 3–98. 24126879 1343619 0.9997 3–98. Intercept Slope r Standards RSD Samples RSD. 211 62463012 18396113 0.995 105 12 104 10. 211 91665614 23976178 0.995 97 6 98 7. 23718610 120 15786254 0.99 103 10 110 10. Precision (mM) Intra-assay (n510). Mean RSD. 39 7. 84 5. 65 3. Inter-assay (n522) Limits of detection. Mean RSD (mM). 38 7 0.03. 82 6 1.8. 67 4 2.5. Standards linearity. Range (mM) Sample linearity. Accuracy Recovery (%).
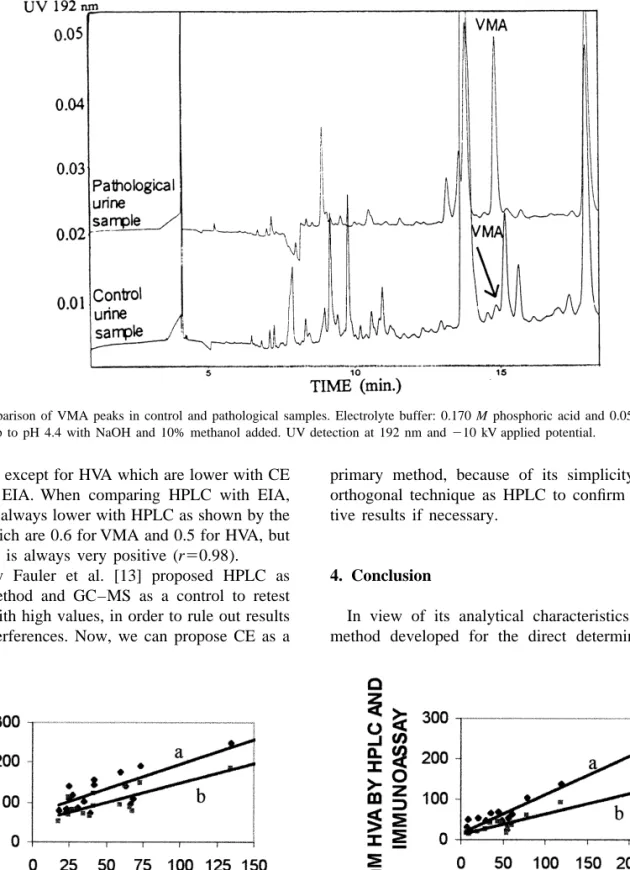
(9) ´ et al. / J. Chromatogr. A 871 (2000) 341 – 350 A. Garcıa. 348. quences as can be seen in the recoveries that are near 100% in the whole range. Samples also showed a good linearity, with correlation coefficients over 0.99. For accuracy, recoveries ranged from 98 to 110% and they did not statistically differ from 100%. When running 10 runs per day of both standards and samples, daily RSDs in concentrations are low enough to consider the method acceptable (3 to 7%). The intermediate precision evaluated on different days and with different operators with a total of 22 runs provided RSD values slightly superior to intraassay precision (4 to 7%), as could be expected. Detection limits are 0.03 mM for VMA, 1.8 mM for HVA and 2.5 mM for HIA. Mean values described in the bibliography as normal for these acids, vary over a wide range even when working with the same technique, that is from 11.6 to 28.7 mM for VMA, from 8.2 to 41 mM for HVA and from 17.8 to 58.3 mM for HIA [7,24]. Detection limits provided by the present method are under these values, so it would be applicable to the measurement of all kind of. samples when following the progress of patients under treatment.. 3.2. Urine samples measurement The results of pathological samples are shown in Table 2 which also includes values of VMA and HVA measured with HPLC–ED and EIA in the ´ Hospital. Fig. 6 shows the elecVirgen del Rocıo tropherogram of a urine sample from a healthy person as compared with one from a patient with pathological levels of this acid, and here the great increase in the peak can be seen. Fig. 7 presents the correlation of the CE method with HPLC and EIA for both VMA and HVA. For VMA, CE vs. HPLC has an equation y51.2x169 and r50.8 and CE vs. EIA y50.98x149 with r50.8. For HVA, the correlation is better; CE vs. HPLC has an equation y5 0.9x117, r50.97 and CE vs. EIA y50.5x112, r5 0.96 which means that CE values are similar to HPLC and EIA values for both acids as the slopes. Table 2 Values of VMA and HVA in urine samples from patients measured by three different methods (samples from 1 to 6 are from children and from 6 to 19 from adults) Measurement of VMA in urine samples from patients (mM). Measurement of HVA in urine samples from patients (mM). No.. CE. HPLC. EIA. No.. CE. HPLC. EIA. m1 m2 m3 m4 m5 m6 m7 m8 m9 m10 m11 m12 m13 m14 m15 m16 m17 m18 m19. 134.5 136.1 18.4 59.8 73.4 63.0 30.3 67.8 66.3 23.3 600.8 24.4 18.2 41.4 41.3 27.1 35.1 24.2 38.8. 248.7 543.9 219.0 174.6 192.7 141.8 86.3 108.5 95.3 82.2 1824.9 110.0 79.7 144.8 155.9 118.1 102.9 139.2 73.7. 186.6 474.6 88.2 93.8 147.7 138.9 78.5 77.9 87.6 69.1 1069.7 68.1 51.4 122.8 89.6 78.8 69.8 112.9 63.9. m1 m2 m4 m5 m6 m7 m8 m9 m10 m11 m12 m13 m14 m15 m16 m17 m18 m19. 243.0 207.8 24.3 44.5 56.0 79.2 30.4 48.5 55.7 119.1 6.7 8.9 36.4 61.4 17.9 11.0 20.9 12.4. 240.1 228.0 134.0 68.1 52.7 102.7 45.6 48.3 25.8 136.8 30.8 50.5 64.8 61.0 111.5 20.9 52.7 22.5. 125.8 120.0 86.4 43.9 29.0 58.4 26.2 39.7 15.8 90.5 16.6 23.3 39.2 34.5 66.5 13.7 19.9 18.3.
(10) ´ et al. / J. Chromatogr. A 871 (2000) 341 – 350 A. Garcıa. 349. Fig. 6. Comparison of VMA peaks in control and pathological samples. Electrolyte buffer: 0.170 M phosphoric acid and 0.050 M acetic acid made up to pH 4.4 with NaOH and 10% methanol added. UV detection at 192 nm and 210 kV applied potential.. are near 1, except for HVA which are lower with CE than with EIA. When comparing HPLC with EIA, values are always lower with HPLC as shown by the slopes, which are 0.6 for VMA and 0.5 for HVA, but correlation is always very positive (r50.98). Recently Fauler et al. [13] proposed HPLC as routine method and GC–MS as a control to retest samples with high values, in order to rule out results due to interferences. Now, we can propose CE as a. primary method, because of its simplicity and an orthogonal technique as HPLC to confirm the positive results if necessary.. 4. Conclusion In view of its analytical characteristics, the CE method developed for the direct determination of. Fig. 7. Correlation of VMA and HVA values by CE and (a) HPLC–ED or (b) EIA..
(11) 350. ´ et al. / J. Chromatogr. A 871 (2000) 341 – 350 A. Garcıa. VMA, HVA and HIA in urine represents a new solution to satisfy the rising demand for measurement of these analytes with simple, low-cost methods. The key advantages are automatisation, minimising sample treatment with the following saving of time, and low consumption of reactives. It could help to rationalise the use of CE in clinical laboratories as samples could be run overnight.. Acknowledgements The present study has been supported by Universidad S. Pablo-CEU project No. 6 / 98. We are grateful to all the persons who have provided urine samples, to Mr. E. Torija and Mr. J.J. Gragera for their technical support, and to Dr. Gayoso for always being available.. References [1] J.L. Young, L.G. Ries, E. Silverber, J.W. Horm, R.W. Miller, Cancer 58 (1986) 598. [2] O. Schweisguth, J. Pediatr. Surg. 3 (1968) 118. [3] M. Tuchman, C.L. Morris, M.L. Ramnaraine, Pediatrics 75 (1985) 324. [4] J.A. Seviour, A.C. McGill, G. Dale, A.W. Craft, J. Chromatogr. 432 (1988) 273. [5] R.C. Clauson, Research Methods in Neurochemistry, Vol. 6, Plenum, New York, 1985. [6] J.P.M. Wielders, J.K. Mink, J. Chromatogr. 310 (1984) 379.. [7] M. Radjaipour, H. Raster, H.M. Liebich, Eur. J. Clin. Chem. Clin. Biochem. 32 (1994) 609. ´ P. Kubalec, I. Skacai, ´ I. Balazovjech, [8] E. Brandsteterova, Neoplasma 41 (1994) 205. [9] N.C. Parker, C.B. Levtzow, P.W. Wright, L.L. Woodard, J.F. Chapman, Clin. Chem 32 (1986) 1473. [10] T. Tokuda, T. Tokieda, A. Anazawa, M. Yoshioka, J. Chromatogr. 530 (1990) 418. [11] M. Tuchman, C. Auray-Blais, R. Ramnaraine, J. Neglia, W. Krivit, B. Lemieux, Clin. Biochem. 20 (1987) 173. [12] J.A. Seviour, A.C. McGill, A.W. Craft, L. Parker, S. Bell, M. Cole, J. Smith, E. Hawkins, J. Brown, A.D. Gordon, Am. J. Pediat. Hematol. / Oncol. 14 (1992) 332. [13] G. Fauler, H.J. Leis, E. Huber, Ch. Schellauf, R. Kerbl, Ch. Urban, H. Gleispach, J. Mass Spectrom. 32 (1997) 507. [14] M. Tuchman, B. Lemieux, C. Auray-Blais, L.L. Robison, R. Giguere, M.T. McCann, W.G. Woods, Pediatrics 86 (1990) 765. ´ [15] F. Taran, H. Bernard, A. Valleix, C. Creminon, J. Grassi, D. Olichon, J.R. Deverre, P. Pradelles, Clin. Chim. Acta 264 (1997) 177. [16] R.O. Oda, R. Clarck, J. Katzmann, J.P. Landers, Electrophoresis 18 (1997) 1715. [17] H.J. Issaq, K. Delviks, G.M. Janini, G.M. Muschik, J. Liq. Chromatogr. 15 (1992) 3193. [18] J. Caslavska, E. Gassmann, W. Thormann, J. Chromatogr. A 709 (1995) 147. [19] M.K. Shirao, S. Suzuki, J. Kobayashi, N. Hiroyuki, E. Mochizuki, J. Chromatogr. B 693 (1997) 463. [20] D. Li, S. Fu, C.A. Lucy, Anal. Chem. 71 (1999) 687. [21] C. Barbas, N.A.R. Adeva, M. Rosillo, T. Rubio, M. Castro, Clin. Chem. 44 (1998) 1340. ´ C. Barbas, R. Aguilar, M. Castro, Clin. Chem. 44 [22] A. Garcıa, (1998) 1905. [23] T. Hanai, K.C. Tran, J. Hubert, J. Chromatogr. 239 (1982) 385. [24] A.R. Bonfigli, G. Coppa, R. Testa, I. Testa, G. De Sio, Eur. J. Clin. Chem. Clin. Biochem. 35 (1997) 57..
(12)
Figure


+3

Documento similar
Four identification and quantification techniques, including liquid chromatography (LC) separation coupled to (i) a diode array ultraviolet (UV(DAD)) (ii), mass spectrometer in
The Dwellers in the Garden of Allah 109... The Dwellers in the Garden of Allah
At the same time, higher values of the quantum efficiency were found in the photocatalytic degradation of phenol, methyl 4-hydroxybenzoate and 4-chlorophenol with P25, whereas in
Herein, we have pur- sued the identification of potential biomarkers in plasma samples and skin biopsies that could define the phenotype of CMT1A patients at mild (Mi), moderate
Confirmation of these in vitro metabolites via the analysis of authentic samples (especially urine) has proven the suitability of the different in vitro strategies
Alternatively, the allocation of attentional resources from a limited pool could occur at distinct points in time for target detection and perception of a blurry word, which
Figure 5 shows XAS spectra, obtained in the TEY mode at the region near the oxygen 1s absorp- tion edge, of samples grown with different plasma oxygen contents, taken at
The main objectives of this work were: (1) to compare the dynamics of fitness gains at 43 ◦ C and the fitness values that were reached at the end of the transfer series, and
