TítuloExploring patterns of epigenetic information with data mining techniques
20
0
0
Texto completo
(2) INTRODUCTION Epigenetics has become, during the past few years, a decisive field for studying how non-gene factors can influence the traits and functions of an organism [1]. It has also growing importance in the continuous efforts to try to understand better the biology of oncogenesis [2]. Epigenetics refers to the heritable changes in gene expression without any alteration in DNA sequence. This includes DNA methylation, histone modification and chromatin conformation, among others. Epigenetic mechanisms, such as histone variant exchange, post-translational modifications or recruitment of remodeling complexes, are involved in determining gene expression and regulation, without altering the primary structure of the DNA, by modulating chromatin dynamics and triggering signaling processes. These changes in gene function are mitotically and/or meiotically heritable determining, therefore, gene expression and thus cellular differentiation, as well as cellular fate. Epigenetic lesions and genetic mutations are acquired by individuals during their life and accumulate with ageing. Both defects, either together or individually, can result in losing control over cell growth and, thus, causing cancer development. Recent advances in high throughput sequencing, such as ChIPon- chip and ChIP-seq, have permitted researchers to start generating extensive maps of histone modifications and DNA methylation across many mammalian cell types, with the coordinated efforts of the NIH Roadmap [3]. These technical advances have thus started to convert this research into a high-throughput endeavor [4]. Computational tools will therefore have major roles both directing the selection of key experiments and formulating new hypothesis performing analysis that are not achievable using only traditional approaches [1]. Computational tools and, in particular, those related to bioinformatics have proven to be useful and beneficial for a great variety of tasks, starting from elemental data management, and becoming essential for tasks such as adequate candidate gene selection, data integration, comparison and correlation. Due to the rapid evolution of the cancer epigenetics field, its combination with bioinformatics will create a synergy that will increase our insights into cancer biology [2]. In the field of epigenetics, DNA methylation has been drawn a special attention because of its close correlation to human development and carcinogenesis. At this regard, CpG islands are important in terms of DNA methylation and frequent promoter association, epigenetic and functional properties by which they were originally identified. In recent years, a variety of methods have been developed to study DNA methylation and other epigenetic modifications [5]. Epigenetic alterations have a major role in the initiation and progression of most human cancers. However, differentiating alterations caused by the early cancer from later consequences is not easy. In this context, increasing evidence has been found suggesting that viral genes are important regarding DNA methylation regulation [6]. Oncogenic viruses can induce transformation by the expression of only a small number of viral genes. Hence, the mechanisms by which oncogenic viruses cause cancer may provide clues regarding the importance of epigenetic alterations in early carcinogenesis [7]. Epigenetic changes occur throughout all stages of carcinogenesis, making them excellent targets for, at early stages, chemoprevention and, at later stages, chemotherapy. Cancer cells present unique patterns of epigenetic alterations which depend on the tumor type. In addition to DNA methylation, histone protein modification is a major layer of epigenetic transcriptional control. These two mechanisms of epigenetic control are integrally linked [8, 9]. Thus, studying epigenetic alterations should provide a global view of gene profile in cancer. In this context, epigenetic markers could be then used for early detection, prognosis and therapy of cancer. Below, we review the different types of techniques applied to cancer epigenetics that may be of great importance for the different epigenetic mechanisms..
(3) DATA MINING APPLIED TO EPIGENETICS During recent years, the advances in data collection have enabled scientists to store a huge amount of data. However, traditional data analysis techniques cannot usually address this increase of data, so new approaches, as data mining, were promoted. Some of the specific challenges that motivated the development of data mining techniques were precisely the scalability and the chance to work with highly dimensional data or the lack of traditional methods to work with heterogeneous and complex data. This situation is especially relevant in fields like epigenetics. But, what is data mining really? Data mining [10, 11] can be defined as the process of automatically discovering useful information in large data repositories. Data mining techniques are deployed to scour large databases in order to find novel and useful patterns that might otherwise remain unknown. The concept of data mining is used together with knowledge discovery (usually as a synonymous) but both terms do not mean exactly the same. Data mining is part of knowledge discovery in databases (KDD), which is the overall process of converting raw data into useful information. As shown in Fig. (1), this process consists of several steps that transform the original data in order to retrieve information.. Fig. (1). KDD: Knowledge Discovery in Databases.. The input data can be stored in very diverse formats, it can include outliers (data with characteristics very different from most of the other data), maybe there are missing values (in certain attributes or because the information was not collected) or sometimes there are even inconsistent or duplicated values. For all these reasons, we need a phase that transforms the raw input data into an appropriate data set for subsequent analysis. This stage is called “data preprocessing” and it can include integrating data from multiple sources, removing noise and duplicate observations from the data, selecting records and features relevant to the data mining task, etc. This stage is perhaps the most time-consuming step in the overall knowledge discovery process. In addition, we also need a phase which allows us to include and use easily the insights offered by the data mining techniques in order to ensure that only valid and useful results are considered. Within the post processing techniques we can cite visualization or statistical measures, as well as hypothesis testing methods to eliminate spurious data mining results. There exist different ways of dividing data mining methods. A general classification may be done by dividing these techniques into predictive and descriptive tasks. On one hand, predictive tasks are those that have as main objective to predict the value of a particular attribute (target or dependent variable) based on the values of other variables (independents variables). In broad terms, when the target is a category, we may talk about classification algorithms and when the target is a continuous variable we may talk about regression algorithms. Finally, on the other hand, descriptive tasks are those that aim at describing the data using their underlying relationships. Techniques belonging to this last type, in artificial intelligence, are called “unsupervised learning”. In this case, the model is defined by observing the data and recognizing patterns without any type of tag or class description. Such methods are useful for summarizing, synthesizing and retrieving relationships among data or attributes part of the data which is being analyzed..
(4) In general, the process of building a predictive model begins with a preliminary analysis of the data, such as statistical measures (mean, median, etc.) as well as different types of graphics, thus allowing a better understanding of the data. Summaries of more complex data, for better comprehension, may be carried out using descriptive methods. Among this type of methods we may find clustering algorithms (which allow grouping elements into categories with similar characteristics) or dimensionality reduction methods (which allow reducing the number of variables involved in the problem treated, loosing as least information as possible).. DIMENSIONALITY REDUCTION In most cases, before addressing any kind of problem using a data mining technique, a dimensionality reduction technique is applied first to the data. Dimensionality reduction has three main objectives: on one hand, it increases the model’s performance and prevents from overtraining thanks to considering fewer characteristics, on the other hand, models are faster and, finally, it enables a better understanding of the model. Among dimensionality reduction techniques, three different types of model can be found: models based on projection of characteristics, models based on feature selection and models based on the information theory. This last group is usually more related to feature extraction in signals, so it is not very used in epigenetic problems and, thus, will not be explained in this review. Models Based on Projection of Characteristics Principal Component Analysis is a statistical technique of information synthesis or dimensionality reduction [12] and one of the most used models belonging to this category. Hence, having as input a set of multivariable data, the objective of this method will be to reduce the number of variables as much as possible loosing as little information as possible. Given the dimensionality reduction, applying PCA first to a set of data may allow using data mining methods that would not be viable within high dimensionality spaces. Furthermore, given that the factors are obtained as a linear combination of the variables, this technique may be used as a pattern search one. However, one of the major drawbacks of PCA lies in the nature of the method: a set of variables, which allow explaining most part of the existing relationships, is extracted from the original data; but these variables do not belong to the original set of variables, they are a combination of them. A key aspect in PCA is how factors are interpreted. This interpretation is not given a priori, but will be deducted after observing the existing relationships between the factors and the variables. This task is not trivial at all and the knowledge provided by the expert involved will be of vital importance. Below, the different phases of a typical PCA process are described [13]: Correlation matrix analysis: PCA only makes sense if there are previously established high correlations among the variables of the problem. This fact indicates that there is redundant information and, therefore, a reduced number of factors may explain most of the total variability. Factor selection: it will be performed in such a way that the first one will represent the largest possible proportion of the original variability; the second one must represent the maximum possible variability which is not included in the first one, and so on. From the total number of.
(5) factors, only those that represent the sufficient percentage of variability will be chosen. The set of factors that have all of the explained variability will be called principal components. Factorial matrix analysis: once the principal components have been selected, they are presented in a matrix. The elements of this matrix represent the factorial coefficients of the variables, that is, the existing correlations between the variables and the principal components. Factor interpretation: for a factor to be interpretable, it must have the following characteristics that, in general, are not easily achievable: o Factorial coefficients must be next to 1. o A variable will only have high coefficients with one of the factors. o There must not exist factors with similar coefficients. Calculation of the factor scores: the scores of the principal components will be presented in a graphic. These scores are obtained using the following formula: 𝑘. 𝑋𝑖𝑗 = 𝑎𝑖1 · 𝑍1𝑗 + ··· + 𝑎𝑖𝑘 · 𝑍𝑘𝑗 = ∑ 𝑎𝑖𝑠 · 𝑍𝑠𝑘 𝑠=1. where a represents the coefficients and Z represents the standardized values of the variables for each subject of the sample. In ref. [14], PCA is used to reduce dimensionality. Further along this review the work of these authors is explained in more depth. Feature selection models Feature selection techniques consist in deleting the characteristics that provide less information to the model. Among this type of selection, there exist three approaches [15]. The first approach includes filtering techniques and focuses on studying only the intrinsic characteristics of the data to be analyzed, that is, independently to the subsequent classification model. The techniques that follow this approach study the information of each characteristic and order them taking this information into account. Among the methods used to study the influence of the variables, the use of statistical tests as a measure to evaluate the difference of a specific characteristic between two classes must be highlighted. Examples of this type of method are t-test, ANOVA or Squared- Chi. Within this category Wilcoxon rank-sum [16], rank products [17] or random permutations [18] and multivariant correlationbased feature selection [19] must also be highlighted. The second approach involves wrapper methods, which select characteristics depending on a classifier. These methods focus on the selection, either deterministic or based on some kind of heuristic, of a set of variables and its subsequent evaluation by means of a specific classifier. The main drawback of these methods is the possible overtraining and their slowness [20]. Finally, the third approach involves embedded techniques, that is, those that are intrinsic to the classifier itself. As explained later on, a classifier can select a series of characteristics giving these more importance within the model than others. In ref. [21], the authors try to detect novel hypermethylated genes in breast cancer benefiting from feature selection. They used two feature selection algorithms, t-test and CfsSubsetEval, to obtain efficient feature subsets. They discovered 14 significant feature subsets by CfsSubsetEval, which can distinguish hypermethylated genes from control genes. 393 unconfirmed hypermethylated genes in breast cancer were prioritized in this work. These genes were assigned the hypermethylated scores and were supported by literature and Gene Ontology enrichment. This paper suggests that the feature.
(6) subsets could be served as discriminating genomic markers to infer novel hypermethylated genes in cancer potentially.. DESCRIPTIVE TASKS Clustering Clustering is a technique based on unsupervised learning. This technique consists in assigning a set of objects into groups (called clusters), so that the objects in the same cluster are more similar to each other than to those in other clusters. Clustering can be hierarchical, if each cluster contains “subclusters”, or non-hierarchical. More specifically, hierarchical clustering [22] produces a set of nested clusters, hierarchically organized. These clusters can be visualized as a dendrogram. Depending on the type of organization followed, we can find agglomerative clustering (the tree is built starting from the leaves, at the beginning every leaf is a cluster, creating agglomerations later on) or divisive clustering (the tree is built starting from the root and divisions are made until reaching the leaves). Regarding epigenomics, several applications of hierarchical clustering can be found such as, for example, those described below. Zheng et al. [23] performed, firstly, hierarchical clustering analysis to obtain a graphical representation of the data. They also used unsupervised learning methods to discover methylation patterns and explored associations with patient characteristics and tumor enhancer of zeste human homolog 2 (EZH2) and insulin-like growth factor-binding protein 2 (IGFPB2) expression. In this study, the authors used 12 candidate genes and compared 154 tumor tissues to 13 samples of nontumor brain. For unsupervised learning, they employed methods that assume discrete classifications, that is, distinct methylation phenotypes. Results showed three different classes of DNA methylation in glioma and that DNA methylation markers are useful for characterizing different glioma subtypes. Vallot et al. [24] used clustering with the aim of distinguishing tumors with multiple regional epigenetic silencing from others, as well as to analyze the association of the previous phenotype with hispathologic and molecular types of bladder cancer. For this purpose, they considered a sample of 57 bladder tumors and compared it with normal tissue. Enroth et al. [25] generated the first genome-wide histone modification profiles in paired normal colon mucosa and tumor samples in order to evaluate the importance of histone modifications in colorectal cancer (CRC). They compared histone modification patterns in both tissues. As part of the data analysis pipeline, they performed hierarchical clustering using Euclidean distances and the Ward agglomeration method. Results confirm that these profiles can be used to find epigenetic aberrations in genes associated with cancer, contributing, thus, to the oncogenic process and giving the possibility to identify new biomarkers. The transcription Start Site Distributions (TSSD) plays an important role in the regulation and function of genes. In ref. [26], the authors develop a systematic clustering approach of the TSS to explore the similarities and stabilities of TSSD clusters. First, they use hierarchical clustering to find the different TSSD relationships. The results indicate that the three main clusters found in literature are in reality a gradient of distributions. This can be divided into 2 categories with different biological properties: one with a small spread of TSS around a dominant peak and one with all tag maps concentrated at the same nucleotide position. This method is combined with k-means. K-means [27] is a basic clustering algorithm. It consists in assigning similar elements to the same group. Firstly, k “centroids” are randomly selected. Then each element is assigned to a “centroid”, depending on its proximity to it. Each “centroid” is recalculated as the mean of all the elements assigned to that cluster. Finally, all these steps are repeated until the “centroids” do not change. Thus,.
(7) the number of groups obtained will be the same as the number of selected “centroids” and the “centroid” will represent each class. Examples of this method’s application is ref. [26] described above, or ref. [28]. In this last one, a sequence-driven algorithm was developed in order to identify possible candidate regulatory elements in DNA methylation of genes in human Lymphoma. The algorithm consists in the extraction of motif information using an iterative censored fuzzy k-means algorithm. Sets of sequences from a given disease class were iteratively compared with each other, and those areas where significant alignments could be identified were used to update the sequence probability profiles. A set of motifs was found, and the authors hypothesize that these sites could be transcription factor binding sites. There also exist other clustering approaches different to the classic models, such as those described below. A new statistical method for analyzing temporal profiles under multiple experimental conditions is proposed in ref. [29]. The method presented in this work performs, at the same time, clustering of temporal expression profiles and inference of regulatory relationships among gene clusters. Therefore, the authors propose in this work a statistical model based on cluster network for temporal profiles with multiple stimuli. The method was tested on two sets of data: firstly, on experimental data from Gene Expression Omnibus, comparing it with another method based on state-space models, and then on different simulated multiple time-course gene expression data related to human breast cancer. CpGcluster [30] is a cluster-based CpG island discovering algorithm, based on the physical distance between chromosome neighboring CpG. If the CpG were distributed homogeneously in the chromosome, then the distance will be the same. The algorithm first searches for clusters of CpG using the distance, then a p-value is associated to each cluster. Only the clusters with higher significance are considered. Another approach to indentify CpG islands using clustering is presented in ref. [31]. Unlike the previous approach, in this paper, instead of a distance value, the detection is based on the density of CG nucleotides in the sequence. Results show that two populations of Escherichia coli with distinctive CG clustering density were found. Then, using the first local minimum of spanned sequence fragment lengths in the distribution, the authors identify the maximum fragment length for each cluster corresponding to a fixed number of CG. A linear relationship between CG dinucleotide and the associated maximum fragment length was defined.. PREDICTIVE TASKS Linear regression Due to its versatility, regression is one of the most used statistical techniques for studying relationships among variables [32, 33]. Broadly, this technique allows quantifying or establishing a relationship between a variable called criterion and a set of variables called predictors. In the simplest situation (linear regression), the relationship established between two variables is modeled as a straight line, in such a way that the data can be explained by the following expression: 𝑓(𝑥) = 𝑊0 + 𝑊1 𝑋.
(8) Considering a dispersion graph in which each axis represents one variable, traditionally, the straight line which minimizes the sum of the squares of the vertical distances between each dot and the mentioned straight line is used (least square method). Measures, such as the coefficient of determination (R2 or square of the correlation coefficient which will vary between 0, if the variables are independent, and 1, if there exists a perfect relationship), can be used to determine the degree of adjustment of the straight line to the data and, hence, the goodness of the prediction. We will talk about multivariate linear regression when, instead of using a single predictor variable, several variables are used [34]. In this case, instead of specifying the relationship between two variables using a straight line, a hyperplane over a multidimensional space will be defined. The independent variable will then be described in terms of the descriptor variables using the following expression (being Ԑ the residues representing the variability that remains unexplained by the independent variables): 𝑘. 𝑓(𝑥) = 𝑊0 + 𝑊1 𝑋1 + ··· +𝑊𝑘 𝑋𝑘 + 𝜀 = 𝑊0 + ∑ 𝑊𝑖 𝑋𝑖 + 𝜀 𝑖=1. Bock et al. [35] used a publicly available web service named EpiGRAPH to obtain a set of potentially predictive attributes in relation to inter-individual variation of DNA methylation profiles. After that, they built linear regression models using a selection of these that were highly significant to predict what they call “the high-resolution improvement” (i.e., the difference between the interindividual deviation for simulated medium-resolution Methylated DNA Inmunoprecipitation, MeDIP, and simulated high resolution bisulfite sequencing). Results show that there exist complex patterns of variation among healthy individuals. The work of Xu et al. [36] proves that, using methods such as multiple linear regression (MLR) and multivariate adaptive regression splines (MARS), predicting gene expression in terms of the levels of histone modification is possible. For this purpose 20 histone lysine and arginine methylations and H2A.Z histone variants in CD4 human cells were analyzed. Results suggested that the H3K4me3 histone is one of the most methylation repressive of the 20 studied in both models (first and second, in MLR and MARS respectively). The stepwise multiple linear regression model is an extension of the multiple linear regression model in which significant variables (according to an F-test) are iteratively added to the model. The Multivariate Adaptive Regression Splines (MARS) is also a non-parametric regression model based on linear regression. The difference between both models is that, in this last one, the relationships among the different variables do not have to be linear. Logistic Regression Logistic regression [37] is a linear predictive method for categorical answer variables. This method models the output as the probability of assigning one of the categories to it. The answer variable y follows a binomial distribution, where p is the probability of answering 1 to the input data. The prediction function must transform the linear predictor in the interval [0, 1], using the logistic function: 𝑝 = 1/(1 + 𝑒 −𝛽´𝑥 ). 𝑙𝑜𝑔( 𝑝⁄1 − 𝑝) = 𝛽´𝑥 = 𝛽0 + 𝛽1 𝑥1 + 𝛽2 𝑥2 + ··· +𝛽𝑛 𝑥𝑛. That is, log(1 / 1-p) equals to the classic linear predictor..
(9) Pinello et al. [38] developed a motif independent metric (MIM) based on the frequency distribution of k-mers to measure the DNA sequence specificity, in order to find a guide for developing sequence- based prediction models. Once the MIM has been obtained, this data can be used to build a model with logistic regression to predict the target sequences. Decision Trees A decision tree [39] is a hierarchical structure consisting of nodes and directed edges generally used for classification problems (an example of decision tree is shown in (Fig. 2)). There are three kinds of nodes in a decision tree: root, internal and leaf or terminal nodes.. Fig. (2). Example of a simple Decision Tree.. The root node has no incoming edges and zero or more outgoing edges. The internal nodes have exactly one incoming edge and two or more outgoing edges. Root and internal nodes contain attribute test conditions in order to separate records that have different characteristics. Finally, leaf or terminal nodes have exactly one incoming edge and no outgoing edges, and each one of them represents a class label (used to provide an output). Once the tree is constructed, the classification task is very simple: starting from the root node, it is necessary to apply the test condition to the record/sample/data and follow the appropriate branch based on the outcome of the test. This will lead to either another internal node (where the same previous process is repeated) or to a leaf node that will assign a class to the record. There are many algorithms that construct this kind of classifiers usually employing a greedy strategy that grows a decision tree by making a series of locally optimum decisions about which attribute to use depending on the test conditions. Some of the most used algorithms are ID3, C4.5 or CART [40]. Cotton et al. [41] use machine learning techniques to predict the X-chromosome inactivation, related with the DNA methylation of CpG islands. More specifically, the authors developed a decision tree to examine the average male and female methylation levels. Their results show that the majority of X-linked promoter probes in islands were unmethylated in males and intermediately methylated in females..
(10) Artificial Neural Networks The human brain mainly consists of neurons interconnected with other neurons via strands of fiber called axons. These axons transmit nerve impulse from one neuron to another (via dendrites) stimulating the neighborhood neurons. It is known that the brain learns by means of adjusting the synaptic connections between neurons upon repeated simulation by the same impulse. This mechanism, very simplified, is the base of Artificial Neural Networks (ANNs) [42-44]. These networks are composed of an interconnected assembly of nodes (called processing elements or neurons) and directed links (which measure the importance of signals by means a weighting factor). These weights change in an adaptive way based on external or internal information that the network processes during the learning phase. Starting from the simplest perceptron, there are multiple architectures (that is, the way how processing elements are arranged) and training algorithms to configure adequately the neural network. However, the most known technique may be the backpropagation algorithm, in which the weights are updated in a reverse way based on their contribution to the final error. The most characteristic architecture (see Fig. 3) is composed of an input layer, where there is a processing element associated to each input data, zero or multiple hidden layers that propagate the inputs to the final layer or output layer, in which each processing element is associated to one class.. Fig. (3). Architecture of ANN.. One of the first works in DNA-binding protein location using machine learning techniques was presented by Workman and Stormo [45]. In this paper, an artificial neural network was used to find the correct binding sequence compared with a background sequence. This ANN shows good results, especially when the background is random. ANN is capable of finding patterns with higher specificity and higher correlation coefficients when provided with background sequences. K-nearest Neighbor K-nearest neighbor [46] is a method for classifying objects based on closest training examples in the feature space. It is a type of instance-based learning, or lazy learning, where the function is only approximated locally and all computation is deferred until classification. The problem associated with the prediction of methylated and unmethylated CpG islands on human chromosomes 6 20 and 22 is addressed in [47]. In order to carry out the prediction, a data set of 451 samples of the CpG islands from 12 tissues of chromosomes 6 20 and 22 was obtained. In addition, four different feature sub-sets (tissue-specific CpGI methylation, evolutionary and conservation, sequence distribution and DNA structure and properties) totaling 50 attributes that.
(11) characterize the methylated and unmethylated groups were extracted for each sample. Due to the nature of this unbalanced data set, in order to avoid disadvantages of traditional leaveone- out (LOO) and m-fold cross validation methods, the LOO method was modified by incorporating the m-fold cross validation approach. The K-nearest neighbor classifier was then adapted for prediction. Support Vector Machines Support Vector Machines (SVMs) [48, 49] are general methods for solving problems of classification, regression and estimation. They are learning systems based on the studies performed by Vapnik on the Statistical Learning Theory. At first, SVMs were developed to solve problems of binary classification (two classes), but currently, and throughout their evolution, they have widened their field of action, dealing with any kind of problem. SVMs are aimed at finding a linear optimal hyperplane by distributing the data into two or more classes, so that all those elements which belong to the same class are located on the same side. Intuitively, it seems obvious to come to the conclusion that, when solving a linear classification problem, there is a high probability of obtaining several solutions which could correctly classify the information. Therefore, the question to be answered is: which of the alternatives is the ideal one? In his studies, Vapnik answered this question by defining the concept of optimal hyperplane. A hyperplane is said to be optimal if it maximizes the margin over all hyperplanes. Once the concept of optimal hyperplane is defined, and after carrying out several studies, it was observed that the hyperplane could be defined only if considering certain data from the training set. These characteristic points are called "support vectors", and they are those instances of each class which are closest to the hyperplane with maximum margin (see Fig. 4).. Fig. (4). Hyperplanes and support vectors.. However, in most of the existing problems, data are not linearly separable, so the implementation of the above-mentioned process does not obtain a good result. To overcome this drawback, it should tackle these problems with different strategies, thus achieving a linear separation but in a different space. To this end, a transformation of input variables is performed in a dimensional space greater than the one to which they belong by means of kernel functions: Gaussian, sigmoidal, polynomic....
(12) Bock et al. [50] propose a novel computational epigenetics approach for discriminating between CpG islands that tend to be methylated from those that remain unmethylated. Based on a previously published data set and 1,184 DNA-related attributes, including sequence, repeats, predicted structure, CpG islands, genes, predicted binding sites, conservation, and single nucleotide polymorphisms, they created a scoring and prediction method. In order to predict CpG island methylation, a SVM was trained. The method was validated using methylation data from the Human Epigenome Project obtaining good results. Part of the previous authors [51] again trained SVMs on epigenetic data and, in addition, used DNA attributes to predict the epigenetic states of all CpG islands genome-wide. They used two linear SVMs, one to distinguish between positive and negative cases and another one to obtain a score for all CpG islands in the human genome. Results were extensively validated on independent data sets. Using computational epigenetics methods allowed the authors to identify high correlation between the epigenome and characteristics of the DNA sequence. HDFinder [14] is a software based on a set of machine learning classification methods developed to predict methylation in human brain DNA. This method can be applied both to CpG and non-CpG islands. First, the authors performed dimensionality reduction, using PCA and recursive feature elimination combined with an SVM. Then the authors tested several machine learning algorithms, like kmeans, linear discriminant analysis, logistic regression and SVMs. The best results were archived by the SVM using a radial basis function kernel. In ref. [52], a set of polymorphisms from the ORegAnno and its properties related with epigenetics was used to distinguish between regulatory polymorphisms and unknown function polymorphisms. Two different classifiers using SVM were developed: first comparing the properties of regulatory and unknown function SNPs, and second comparing the positive value of SNPs (Single Nucleotide Polymorphisms) and unknown function SNPs within an associated gene with the average values for each property within that gene. The first classifier shows the most important properties, and the second one determines if there are important directional shifts in values with a promoter which discriminates functional SNPs from unknown functional SNPs. Luedi et al. [53] developed a classification method to identify imprinted genes (that is, those that are silenced depending on the parent from which that allele was inherited) based on the concentration of certain types of repeated element and other DNA sequence characteristics. The authors applied two different strategies: one using support vector machines and another one using sparse logistic regression, each with different feature selection methods. For each strategy, the classifiers were trained using two different kernels, a linear and a radial basic function. The genes that were predicted by the four classifiers were considered “high-confidence”. The sequence features used for classification were repeated phase changes, recombination hotspots and nucleosome formation potential. Lee et al. [54] use a support vector machine to detect regulatory sequences in mammals. In general, identifying these enhancers is performed experimentally. However, their systematic identification is limited since these enhancers are physically separated from the genes they regulate, so huge amounts of regulators must be analyzed in order to identify the correct ones. The use of machine learning models, such as SVMs, allows a fast and automatic identification of these enhancers. In addition to predicting them, they also try to detect which of these enhancers has more or less importance in the result, or which of them are exciters or repressors. Thus, negative weights will indicate that the sequence elements are significantly absent in the enhancers, that is, they have a biological role as transcriptional repressor. This is a clear example of the embedded characteristic selection technique. Moreover, the SVM model has been used to detect enhancers in different tissues (forebrain, midbrain and limb), distinguishing forebrain and midbrain from limb reasonably well. In addition to mice sequences, it was found that this model works also correctly with human sequences. The model developed using SVMs also allows identifying new enhancing regions over the genome, scanning systematically the whole genome with the developed SVM..
(13) Bayesian Classifiers A Bayesian classifier is a simple probabilistic classifier which is strongly based on a statistical concept, Bayes’ Theorem, presenting a response to situations where the relationship between the attribute set and the class variable is non-deterministic and should be modeled by means of probabilistic relationships. These situations include noisy or missing data, presence of certain confusing factors that affect the classification but are not included in the analysis, etc. Bayes’ Theorem establishes a conditional model over a dependent variable C (the class variable) and N feature variables (the attribute set): 𝑃(𝐶\ 𝑋1 , … , 𝑋𝑛 ) = 𝑃(𝑋1 , … , 𝑋𝑛 | 𝐶) ⁄ 𝑃(𝑋1 , … , 𝑋𝑛 ) The posterior probability, P(C | X1,…, Xn), as opposed to its prior probability, P(C), can be used for classification: during the training phase, a Bayesian classifier needs to learn the posterior probabilities for every combination of (X1,…, Xn) and C based on information gathered from the training data. Thus, knowing these probabilities a test record (X’1,…, X’n) can be classified by finding the class C’ that maximizes the posterior probability P(C’ | X’1,…, X’n). To make estimations about the class-conditional probabilities P(X1,…, Xn | C) there are two classical approaches: the naïve Bayes classifier [55, 56] and the Bayesian Belief Network [57]. The first one makes this estimation based on applying Bayes' theorem with strong (naive) independence assumptions. In simple terms, a naive Bayes classifier assumes that the presence (or absence) of a particular feature of a class is unrelated to the presence (or absence) of any other feature, given the class variable. Bayesian Belief Networks, on the contrary, allow specifying which pair or attributes are conditionally independent, providing a graphical representation of the probabilistic relationships between a set of random variables. In ref. [58], the authors developed a closeness measure to prove that the interaction among chromatin modifications influence CpG methylation. This measure is applied to CpG methylation and histone modification data sets. First, the authors performed a cluster analysis in order to obtain features significantly associated with distinct chromatin patterns, where 9 clusters were obtained. Then a Bayesian network is applied to each chromatin feature together with its methylation status in the closeness measure profile. Two types of Bayesian networks were mapped. One is a global network without module partition, and the other one is a module-specific network. In the work presented by Cui et al. [59], a Bayesian network was developed in order to detect histone modifications in Saccharomices cerevisiae. The model analyzes the distribution patterns of 12 histone modifications for 1,722 nucleosomes of 284 genes at promoter regions, and transcribed regions and the association of histone modifications with Pol II. The modification values were discretized into two levels, low and high by the k-means clustering algorithm. In Yu’s work [60], a model based on Bayesian networks is used to infer relationships between histone modifications and gene expression. Firstly, the levels of expression were analyzed performing a hierarchical clustering obtaining two clusters, group A (activated) and group B (repressing). This division was not enough, so, later, k-means was used to discretize the genes (low, medium and high) in terms of two characteristics: on one hand, the level of expression and, on the other hand, the average level of expression in human tissue. With these divisions, a model was built using Bayesian networks, which infers causal relationships among histone modifications, chromatin binding events and level of expression in a gene-centric network. Karlic et al. [61] describe a model for predicting gene expression by studying histone modifications. Starting with 39 histones (19 lysine or arginine histone methylations, a H2A.Z histone and 19 histone acetylations in CD4+ T-cells), this number is reduced to the four most significant in the transcription process. The authors develop two prediction models, one continuous and the other one discrete (such as that one presented by Yu). They do not obtain significant results, but there is a.
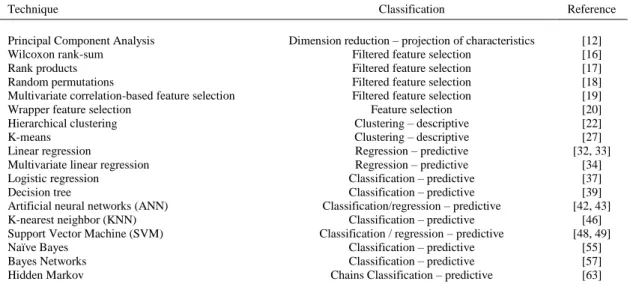
(14) loss of predictive power in the discrete model. These authors find that these predictions are valid in different types of cells. In addition to the previously described methods, there exist packages such as EpiGRAPH that includes all of them. EpiGRAPH [62], which is provided as a web service, is defined by its authors as “a user-friendly software for statistical analysis and prediction of (epi)genomic data”. This software contains several machine learning algorithms, such as SVMs or Adaboost. This web service allows researchers to upload data related to genomic regions that will be tested in terms of multiple attributes such as DNA sequence, chromatin structure, epigenetic modifications and evolutionary conservation in order to give the researchers information about enrichment or depletion among these regions. This software is also capable of learning to predictively identify similar genomic regions. Hidden Markov Chains In statistics, the term Markov refers to the memoryless property of a stochastic process [63]. It implies that the actual response of a system does not depend on the previous ones. According this definition a Markov chain is a stochastic discrete process, that is, a process where if the present is known, the future does not depend on the past. When the different states are “observable” in a direct way, this kind of technique plays an important role in reinforcement learning. In other situations the state is not directly visible to the observer but the output, dependent on the state, is visible. These situations are related with the Hidden Markov Chains or Hidden Markov Models. Here, the sequence of tokens generated (the “visible” output) gives some information about the sequence of states. Hidden Markov models are especially used to deal with problems that involve time series and temporal pattern recognition such as handwriting [64], speech, gesture recognition or several issues within bioinformatics. One critical step to understand the epigenetic process is to determine how proteins interact with target DNA to regulate gene expression. Chromatin immunopreciptation (ChIP) is the main approach to detect this protein-DNA interaction. Most of the methods used to detect ChIP enriched regions are based on rule-based methods. HPeak [65] is a probabilistic software that uses Hidden Markov Models (HMM) to detect these enriched peaks. This method was used in a prostate cancer study. In the papers written by Ernst and Kellis in 2010 [66] and 2012 [67], the “chromatin states” concept is introduced to define 51 states represented by combinations of chromatin marks, especially coherent and with biological meaning. In order to identify these states, the authors developed an unsupervised learning model based on a Multivariate Hidden Markov Model which captures two types of information from the chromatin: on one hand, the frequency of appearance of two chromatin marks and, on the other hand, the frequency of appearance of the different chromatin states in spatial relationships. This model was used on a set of histones (18 acetylations 20 methylations, H2AZ, CTCF and Pol II in CD-4 T-cells). Below, two tables that summarize, on one hand, the data mining techniques presented in this review classified as dimensionality reduction, descriptive or predictive tasks (see Table 1), and, on the other hand, the different applications of these techniques with information regarding the epigenetic mechanisms on which each paper focuses (see Table 2)..
(15) Table 1. Summary of the Different Data Mining Techniques Presented Technique Principal Component Analysis Wilcoxon rank-sum Rank products Random permutations Multivariate correlation-based feature selection Wrapper feature selection Hierarchical clustering K-means Linear regression Multivariate linear regression Logistic regression Decision tree Artificial neural networks (ANN) K-nearest neighbor (KNN) Support Vector Machine (SVM) Naïve Bayes Bayes Networks Hidden Markov. Classification. Reference. Dimension reduction – projection of characteristics Filtered feature selection Filtered feature selection Filtered feature selection Filtered feature selection Feature selection Clustering – descriptive Clustering – descriptive Regression – predictive Regression – predictive Classification – predictive Classification – predictive Classification/regression – predictive Classification – predictive Classification / regression – predictive Classification – predictive Classification – predictive Chains Classification – predictive. [12] [16] [17] [18] [19] [20] [22] [27] [32, 33] [34] [37] [39] [42, 43] [46] [48, 49] [55] [57] [63]. Table 2. Application of the Previous Techniques to Epigenetics Epigenetics Detection of hypermethylated genes Methylation pattern discovery and association with patient characteristics and tumor expression Discrimination of tumors with multiple regional epigenetic silencing Discovery of histone modification pattern in tumors Analysis of similarities in Transcription Start Site Distributions Motif extraction for regulatory elements in DNA methylation genes discovery Inference of regulatory networks CpG Island discovery CpG island discovery Methylation patterns discovery Histone-based gene expression prediction Histone-based gene expression prediction Motif-based target sequence prediction X-chromosome inactivation prediction DNA-binding sequence location Methylated CpG island classification Methylated CpG island classification Chromatin structure classification Methylation prediction PCA Functional polymorphism classification Imprinted gene identification Regulatory sequences identification. Methylation status classification Histone modifications detection Histone-based gene expression prediction Enriched regions detection Chromatin state discovery. Data mining technique. Reference. Feature selection (t-test and multicorrelation-based) and classification (Naïve Bayes) Hierarchical clustering. [21]. Hierarchical clustering. [24]. Hierarchical clustering Hierarchical and k-means clustering. [25] [26]. K-means clustering. [28]. Cluster based networks Clustering algorithm Density based clustering algorithm Linear regression Multiple linear regression Multiple linear regression Logistic regression Decision trees Artificial neural networks K-nearest neighbor Support Vector Machines Support vector machines Feature selection and support vector machines classification Support vector machines Feature selection with logistic regression and support vector machines Support vector machines Cluster analysis and Bayesian networks K-means clustering and Bayesian network classification K-means clustering and Bayesian network classification Hidden Markov Models Hidden Markov Models. [29] [30] [31] [35] [36] [61] [38] [41] [45] [47] [50] [51] [14]. [23]. [52] [53] [54] [58] [59] [60] [65] [66].
(16) EPIGENETIC DATABASES AND TEXT MINING In almost every cancer type, each month there are new publications with information related to epigenetics involving mainly methylation or discovery of novel methylation markers. In this context, it would be very useful to have access to an annotated, reviewed, sorted and summarized overview of all available data. For this reason, Ongenaert et al. created PubMeth. PubMeth [68] is a freely accessible database that contains information about cancer and its relationship with methylation, such as, for example, genes reported to be methylated in various cancer types. This database allows queries based on genes or on cancer types. In the first case, the database will retrieve which cancer types the genes are reported as being methylated and, in the second case, the genes reported to be methylated in the cancer (sub) types introduced in the query. PubMeth is obtained as a result of performing text mining of Medline/ PubMed abstracts, modified with manual reading and annotation, which increases its specificity and quality. The process of text mining involves deriving high-quality information (i.e., relevant, novel and interesting information) from text. Like in the previous case, the authors of [69] considered it was useful to extract relevant information from biological literature automatically, since more epigenetics research is published electronically. Therefore, to facilitate epigenetics research, they developed a database called MeInfoText, which provides information related to gene methylation and cancer, as well as integrated protein- protein interaction and biological pathway information, as a result of text and association mining processes. In addition, highlighted keywords and gene names identified from each methylationrelated abstract are also included in this database. Ohta et al. also considered the task of automatically extracting DNA methylation events from the existing biomedical literature [70]. As said before, DNA methylation is a key mechanism of epigenetic control of gene expression and is implicated in many cancers. However, little has been studied at this regard. In this paper, the authors selected 200 abstracts from PubMed and manually annotated this corpus. After this, the authors retrained a state-of-theart event extraction system on the corpus, obtaining good precision and recall percentages. Their results demonstrated that it is possible to create reliable extraction methods for this type of data using corpus annotation and straightforward retraining of a general event extraction system. This work’s resources are freely available at the GENIA project homepage. Finally, Yang and Lee [71] developed an integrated system to study cancer epigenetics. They developed robust software pipelines capable of integrating heterogeneous data from external and internal sources. More specifically, they developed modules that can automatically fetch data from external sources, preprocess the data (including data filtering, normalization, and merging relevant properties), and format the input and output. They used statistical packages such as R, SPLUS, and SAS as the core, complemented by customized programs based on Bioperl or caBIO. This software was, thus, designed to extract patterns, trends, and relationships of molecular activities in five levels, including epigenome (methylation, imprinting, and chromatin), from massive data sets using cluster analysis, classification, and regression techniques.. CONCLUSIONS This work reviewed some of the most important data mining results on epigenetics, especially those that may be of application for anticancer therapy. Data mining techniques allow analyzing the data in an automatic way, providing the researcher with new information as part of the knowledge discovery process. Although most of the work presented is related to DNA methylation and CpG islands, it may also be possible to get new insights into the epigenetic process and discover new biomarkers for cancer by studying histone modification profiles. Histone modification plays an important role in epigenetics, affecting transcriptional regulation. It is expected, therefore, that more research will be done in relation to it in a near future. Other approaches described in the last part of the previous section, such as epigenetic databases and text mining approaches, may also be useful in this field..
(17) CONFLICT OF INTEREST The authors confirm that this article content has no conflicts of interest.. ACKNOWLEDGEMENTS Vanessa Aguiar-Pulido acknowledges the funding support for a research position by the “Plan I2C” program from Xunta de Galicia (Spain), being also co-funded by FEDER. This work is supported by the following projects: “Ibero-American Network of the Nano- Bio-Info-Cogno Convergent Technologies”, Ibero-NBIC Network (209RT-0366) funded by CYTED (Spain), “Development of new image analysis techniques in 2D Gel for biomedical research” (ref.10SIN105004PR) funded by Xunta de Galicia and RD07/0067/0005, funded by the Carlos III Health Institute. We would link to thank Victoria Suarez-Ulloa for her suggestions regarding the paper, as well as the guest editor’s and reviewers’ comments that helped us improve this work.. ABBREVIATIONS ANN = Artificial neural network ChIP = Chromatin inmunoprecipitation CpG = Cytosine preceding Guanine CRC = Colorectal cancer DNA = Deoxyribonucleic acid HMM = Hidden Markov Model KDD = Knowledge Discovery in Databases LOO = Leave-one-out MARS = Multivariate adaptive regression splines MeDIP = Methylated DNA inmunoprecipitation MIM = Motif independent metric MLR = Multiple linear regression NIH = National Institutes of Health PCA = Principal Component Analysis SNP = Single Nucleotide Polymorphism SVM = Support Vector Machine TSSD = Transcriptional Start Site Distributions. REFERENCES [1] Lim SJ, Tan TW, Tong JC. Computational Epigenetics: the new scientific paradigm. Bioinformation 2010; 4: 331-7. [2] Van Neste L, Herman JG, Schuebel KE, et al. A Bioinformatics Pipeline for Cancer Epigenetics. Current Bioinformatics 2010; 5:153-63. [3] NIH. Roadmap Epigenomics Project 2010: Available from: http://www.roadmapepigenomics.org. Last accessed: 30/04/2012. [4] Bock C, Lengauer T. Computational epigenetics. Bioinformatics 2008; 24: 1-10. [5] Tan JX, Sun YJ. [Progresses of methods for epigenomics study]. Yi Chuan 2009; 31: 312. [6] Li HP, Leu YW, Chang YS. Epigenetic changes in virus-associated human cancers. Cell Res 2005; 15: 262-71. [7] Flanagan JM. Host epigenetic modifications by oncogenic viruses. Br J Cancer 2007; 96: 183-8. [8] Paluszczak J, Baer-Dubowska W. Epigenome and cancer: new possibilities of cancer prevention and therapy?. Postepy Biochem 2005; 51: 244-50. [9] Andreoli F, Barbosa AJM, Parenti MD, Del Rio A. Modulation of epigenetic targets for anticancer therapy: clinicopathological relevance, structural data and drug discovery perspectives. Curr Pharm Des 2013; 19(4): 578-613..
(18) [10] Witten IH. Data mining : practical machine learning tools and techniques. Morgan Kaufmann: Burlington, MA 2011. [11] Tan P-N, Steinbach M, Kumar V. Introduction to Data Mining. Pearson Addition Wesley: Boston, Maryland 2006. [12] Jolliffe IT. Principal Component Analysis (2 ed.). Springer-Verlag: New York 2002. [13] Shlens J. A tutorial on principal component analysis. Systems Neurobiology Laboratory, University of California at San Diego 2005. [14] Das R, Dimitrova N, Xuan Z, et al. Computational prediction of methylation status in human genomic sequences. Proc Natl Acad Sci USA 2006; 103: 10713-6. [15] Guyon I, Elisseeff A, Kaelbling LP. An Introduction to Variable and Feature Selection. Journal of Machine Learning Research 2003; 3: 1157-82. [16] Thomas JG, Olson JM, Tapscott SJ, Zhao LP. An efficient and robust statistical modeling approach to discover differentially expressed genes using genomic expression profiles. Genome Research 2001; 11: 1227-36. [17] Breitling R, Armengaud P, Amtmann A, Herzyk P. Rank products: a simple, yet powerful, new method to detect differentially regulated genes in replicated microarray experiments. FEBS let 2004; 573: 83-92. [18] Pan W. On the use of permutation in and the performance of a class of nonparametric methods to detect differential gene expression. Bioinformatics 2003; 19: 1333-40. [19] Wang Y, Tetko IV, Hall MA, et al. Gene selection from microarray data for cancer classification - a machine learning approach. Comput Biol Chem 2005; 29: 37-46. [20] Aguiar-Pulido V, Seoane JA, Rabunal JR, Dorado J, Pazos A, Munteanu CR. Machine learning techniques for single nucleotide polymorphism - disease classification models in schizophrenia. Molecules 2010; 15: 4875-89. [21] Lv J, Su J, Wang F, Qi Y, Liu H, Zhang Y. Detecting novel hypermethylated genes in breast cancer benefiting from feature selection. Comput Biol Med 2010; 40: 159-67. [22] Ward JH. Hierarchical Grouping to Optimize an Objective Function. Journal of the American Statistical Association 1963; 58:236-44. [23] Zheng S, Houseman EA, Morrison Z, et al. DNA hypermethylation profiles associated with glioma subtypes and EZH2 and IGFBP2 mRNA expression. Neuro Oncol 2011; 13: 280-9. [24] Vallot C, Stransky N, Bernard-Pierrot I, et al. A novel epigenetic phenotype associated with the most aggressive pathway of bladder tumor progression. J Natl Cancer Inst 2011; 103: 47-60. [25] Enroth S, Rada-Iglesisas A, Andersson R, et al. Cancer associated epigenetic transitions identified by genome-wide histone methylation binding profiles in human colorectal cancer samples and paired normal mucosa. BMC Cancer 2011; 11: 450. [26] Zhao X, Valen E, Parker BJ, Sandelin A. Systematic clustering of transcription start site landscapes. PLoS One 2011; 6: e23409. [27] MacQueen JB. Some Methods for classification and Analysis of Multivariate Observations. In: 5th Berkeley Symposium on Mathematical Statistics and Probability. University of California Press 1967; pp. 281-97. [28] Papageorgio C, Harrison R, Rahmatpanah FB, Taylor K, Davis W, Caldwell CW. Algorithmic discovery of methylation "hot spots" in DNA from lymphoma patients. Cancer Inform 2008; 6: 449-53. [29] Shiraishi Y, Kimura S, Okada M. Inferring cluster-based networks from differently stimulated multiple time-course gene expression data. Bioinformatics 2010; 26: 1073-81. [30] Hackenberg M, Previti C, Luque-Escamilla PL, Carpena P, Martinez-Aroza J, Oliver JL. CpGcluster: a distance-based algorithm for CpG-island detection. BMC Bioinformatics 2006; 7:446. [31] Glass JL, Thompson RF, Khulan B, et al. CG dinucleotide clustering is a species-specific property of the genome. Nucleic Acids Res 2007; 35: 6798-807. [32] Montgomery DC, Peck EA, Vining GG. Introduction to linear regression analysis. John Wiley & Sons 2007. [33] Weisberg S. Applied linear regression. Wiley 2005. [34] Johnson RA, Wichern DW. Applied multivariate statistical analysis. Prentice Hall: Upper Saddle River, NJ 2002. [35] Bock C, Walter J, Paulsen M, Lengauer T. Inter-individual variation of DNA methylation and its implications for large-scale epigenome mapping. Nucleic Acids Res 2008; 36: e55. [36] Xu X, Hoang S, Mayo MW, Bekiranov S. Application of machine learning methods to histone methylation ChIP-Seq data reveals H4R3me2 globally represses gene expression. BMC Bioinformatics 2010; 11: 396. [37] Hastie T, Tibshirani R, Friedman J. The Elements of Statistical Learning: Data Mining, Inference and Prediction. Springer 2001..
(19) [38] Pinello L, Lo Bosco G, Hanlon B, Yuan GC. A motif-independent metric for DNA sequence specificity. BMC Bioinformatics 2011;12: 408. [39] Moret BME. Decision Trees and Diagrams. Computing Surverys 1982; 14: 593-623. [40] Quinlan JR. C4.5: Programs for Machine Learning. Morgan Kaufmann 1993. [41] Cotton AM, Lam L, Affleck JG, et al. Chromosome-wide DNA methylation analysis predicts human tissue-specific X inactivation. Hum Genet 2011; 130: 187-201. [42] Haykin S. Neural networks a comprehensive foundation. Prentice Hall: Upper Saddle River, New Jersey 1999. [43] Bishop C. Neural Networks for pattern recognition. Oxford University Press: New York 1995. [44] Resino S, Seoane JA, Bellon JM, et al. An artificial neural network improves the noninvasive diagnosis of significant fibrosis in HIV/HCV coinfected patients. J Infect 2011; 62: 77-86. [45] Workman CT, Stormo GD. ANN-Spec: a method for discovering transcription factor binding sites with improved specificity. Pac Symp Biocomput 2000: 467-78. [46] Cover TM, Hart PE. Nearest neighbor pattern classification. IEEE Transactions on Information Theory 1967; 13: 21-7. [47] Ali I, Seker H. A comparative study for characterisation and prediction of tissue-specific DNA methylation of CpG islands in chromosomes 6 20 and 22. Conf Proc IEEE Eng Med Biol Soc 2010; 2010: 1832-5. [48] Scholkopf B, Smola AJ. Learning with Kernels: Support Vector Machines, Regularization, Optimization, and Beyond (Adaptive Computation and Machine Learning). MIT Press 2001. [49] Shawe-Taylor J, Cristianini N. An Introduction to Support Vector Machines (and other kernel-based learning methods). Cambridge University Press 2000. [50] Bock C, Paulsen M, Tierling S, Mikeska T, Lengauer T, Walter J. CpG island methylation in human lymphocytes is highly correlated with DNA sequence, repeats, and predicted DNA structure. PLoS Genet 2006; 2: e26. [51] Bock C, Walter J, Paulsen M, Lengauer T. CpG island mapping by epigenome prediction. PLoS Comput Biol 2007; 3: e110. [52] Montgomery SB, Griffith OL, Schuetz JM, Brooks-Wilson A, Jones SJ. A survey of genomic properties for the detection of regulatory polymorphisms. PLoS Comput Biol 2007; 3: e106. [53] Luedi PP, Dietrich FS, Weidman JR, Bosko JM, Jirtle RL, Hartemink AJ. Computational and experimental identification of novel human imprinted genes. Genome Res 2007; 17: 1723-30. [54] Lee D, Karchin R, Beer MA. Discriminative prediction of mammalian enhancers from DNA sequence. Genome Res 2011;21: 2167-80. [55] Langley P, Iba W, Thompson K. An analysis of Bayesian classifiers. In: Tenth National Conference on Artificial Intelligence. AAAI Press: San Jose, CA 1992. [56] Aguiar-Pulido V, Munteanu CR, Seoane JA, et al. Naive Bayes QSDR classification based on spiral-graph Shannon entropies for protein biomarkers in human colon cancer. Mol Biosyst 2012; 8:1716-22. [57] Neapolitan RE. Learning Bayesian Networks. Prentice Hall: Upper Saddle River, NJ 2004. [58] Lv J, Qiao H, Liu H, et al. Discovering cooperative relationships of chromatin modifications in human T cells based on a proposed closeness measure. PLoS One 2010; 5: e14219. [59] Cui XJ, Li H, Liu GQ. Combinatorial patterns of histone modifications in Saccharomyces cerevisiae. Yeast 2011; 28: 683-91. [60] Yu H, Zhu S, Zhou B, Xue H, Han JD. Inferring causal relationships among different histone modifications and gene expression. Genome Res 2008; 18: 1314-24. [61] Karlic R, Chung HR, Lasserre J, Vlahovicek K, Vingron M. Histone modification levels are predictive for gene expression. Proc Natl Acad Sci USA 2010; 107: 2926-31. [62] Bock C, Halachev K, Buch J, Lengauer T. EpiGRAPH: userfriendly software for statistical analysis and prediction of (epi)genomic data. Genome Biol 2009; 10: R14. [63] Cappé O, Moulines E, Ryden T. Inference in Hidden Markov Models. Springer Verlag 2005. [64] Fisher A, Riesen K, Bunke H. Graph Similarity Features for HMMBased Handwriting Recognition in Historical Documents. In: International Conference on Frontiers in Handwriting Recognition (ICFHR). IEEE: Kolkata, India 2010; pp. 253-8. [65] Qin ZS, Yu J, Shen J, et al. HPeak: an HMM-based algorithm for defining read-enriched regions in ChIP-Seq data. BMC Bioinformatics 2010; 11: 369..
(20) [66] Ernst J, Kellis M. Discovery and characterization of chromatin states for systematic annotation of the human genome. Nat Biotechnol 2010; 28: 817-25. [67] Ernst J, Kellis M. ChromHMM: automating chromatin-state discovery and characterization. Nat Methods 2012; 9: 215-6. [68] Ongenaert M, Van Neste L, De Meyer T, Menschaert G, Bekaert S, Van Criekinge W. PubMeth: a cancer methylation database combining text-mining and expert annotation. Nucleic Acids Research 2008; 36: D842-6. [69] Fang YC, Huang HC, Juan HF. MeInfoText: associated gene methylation and cancer information from text mining. BMC Bioinformatics 2008; 9: 22. [70] Ohta T, Pyysalo S, Miwa M, Tsujii J. Event extraction for DNA methylation. Journal of Biomedical Semantics 2011; 2 (Suppl 5):S2. [71] Yang HH, Lee MP. Application of bioinformatics in cáncer epigenetics. Ann N Y Acad Sci 2004; 1020: 67-76..
(21)
Figure
Documento similar