Immigrants wage gap in the Great Buenos Aires labor market : how important are differences in human capital?
58
0
0
Texto completo
(2) DOCUMENTOS DE TRABAJO. Pontificia Universidad Católica Argentina “Santa María de los Buenos Aires”. Immigrants Wage Gap in the Great Buenos Aires Labor Market: How Important Are Differences in Human Capital?. Por Silvia Montoya y Virginia Giordano. Facultad de Ciencias Económicas Escuela de Economía “Francisco Valsecchi” Documento de Trabajo Nº 36 Abril de 2012.
(3) Los autores del presente artículo ceden sus derechos, en forma no exclusiva, para que se incorpore la versión digital del mismo al Repositorio Institucional de la Universidad Católica Argentina como así también a otras bases de datos que la Universidad considere de relevancia académica..
(4) IMMIGRANTS WAGE GAP IN THE GREAT BUENOS AIRES LABOR MARKET: HOW IMPORTANT ARE DIFFERENCES IN HUMAN CAPITAL? Silvia Montoya* and Virginia Giordano** Abstract Labor market performance of native and immigrant workers differ in terms of their employment opportunities, their insertion by sector of employment, their labor legislation protection and their income. This paper analyses why the two groups of workers perform so differently by estimating a Mincer equation and decomposing income differentials using the Oaxaca-Blinder method. The difference in income is assigned to different effects, endowment and return to those endowments. Immigrants have a higher probability of working in low productivity jobs and of being exposed to higher than average informality. Moreover, both internal and border country immigrants face a lower rate of labor legislation protection, have on average a lower level of human capital and earn lower income than native workers. Consistently, immigrants earn less than natives, being immigrants from border countries in worse situation than internal immigrants as opossed to that reference group. Female immigrants earn systematically less than their natives counterparts. Wage gap ranges from 13% to 71 % percent. Part of the wage gap is attributable to occupational segregation i.e. immigrants crowding into lower paid highly-informal occupations. The analysis shows that Native workers have on average more favorable characteristics, and experience slightly higher returns to these characteristics in terms of income than immigrant workers even after controlling for occupational insertion. * Pontificia Universidad Católica Argentina, email: [email protected] ** FCE, Universidad Nacional de Córdoba, email: [email protected] Keywords: migration, wages, labor market, discrimination JEL Classification: J15, J31, J61, J71. 1.
(5) Table of Contents 1.. INTRODUCTION 1.1. 1.2.. 2.. 5. SPECIFIC AIMS STRUCTURE. 7 7. BACKGROUND AND MOTIVATION. 7. 2.1. MIGRATORY MOVEMENTS FROM NON‐NEIGHBORING COUNTRIES 2.2. MIGRATORY MOVEMENTS FROM NEIGHBORING COUNTRIES 2.2.1. Bordering immigration in the GBA area 2.3. SKILLED EMIGRATION 2.4. INTERNAL MIGRATION 2.5. EVIDENCES ON THE IMPACT OF IMMIGRATION ON THE LABOR MARKET 2.5.1. Empirical evidence for Argentina 3.. DATA AND METHODOLOGY. 22. 3.1. DATA 3.2. ECONOMETRIC SPECIFICATION 3.2.1 Employment and Informality 3.2.2 Income Differentials 3.2.3 Endowment and Return Effect: the Oaxaca‐Blinder Decomposition 3.3. SOFTWARE 4.. MIGRATORY FLOWS IN URBAN LABOR MARKETS 4.1. 4.2. 4.3. 4.4.. 8 11 15 15 17 18 20. IMMIGRATION IN THE GREAT BUENOS AIRES LABOR MARKET EMPLOYMENT AND UNEMPLOYMENT OCCUPATIONAL STRUCTURE AND INFORMALITY ARE THE IMMIGRANTS DISCRIMINATED: THE OAXACA‐BLINDER DECOMPOSITION. 22 23 23 25 25 26 26 28 31 34 37. 5.. DISCUSSION. 41. 6.. REFERENCES. 43. STATISTICAL APPENDIX. 46. 2.
(6) LIST OF FIGURES FIGURE 1 ‐ NET MIGRATION RATE 1810‐2008 ...................................................................... 8 FIGURE 2 ‐ RELATIVE WAGES ARGENTINA‐ REST OF THE WORLD ........................................10 FIGURE 3 ‐ IMMIGRANTS BY COUNTRY OF BIRTH ...............................................................12 FIGURE 4 ‐ RELATIVE GDP PER CAPITA ARGENTINA‐SELECTED COUNTRIES .........................14 FIGURE 5 ‐ EMIGRATION 1960‐2000 ...................................................................................16 FIGURE 6 ‐ COMPOSITION OF FOREIGN BORN POPULATION MAIN FLOWS .........................27 FIGURE 7 ‐ DISTRIBUTION OF PHS URBAN POPULATION BY REGION...................................28 FIGURE 8 ‐ UNEMPLOYMENT IN THE GBA ..........................................................................32 FIGURE 9 ‐ LABOR LEGISLATION COVERAGE BY MIGRATORY CONDITION ...........................36 FIGURE 10 ‐ MARGINAL EFFECT OF SELECTED VARIABLES ON THE PROBABILITY OF BEING INFORMAL ........................................................................................................................37 FIGURE 11 ‐ INCOME DISTRIBUTION BY BIRTHPLACE ..........................................................38 FIGURE 12 ‐ THE OAXACA‐BLINDER DECOMPOSITION: EFFECT OF HUMAN CAPITAL ON THE NATIVE/IMMIGRANT WAGE GAP .......................................................................................40. 3.
(7) LIST OF TABLES TABLE 1 ‐ COMPOSITION OF IMMIGRATION BY COUNTRY OF ORIGIN ................................15 TABLE 2 ‐ IMPACT OF MIGRATORY FLOWS ON WAGES .......................................................22 TABLE 3 ‐ IMMIGRANTS IN GBA, 1974 AND 2011 ...............................................................29 TABLE 4 ‐ WHO ARE THE IMMIGRANTS ..............................................................................31 TABLE 5 ‐ DETERMINANTS OF THE PROBABILITY OF EMPLOYMENT ....................................33 TABLE 6 ‐ OCCUPATIONAL STRUCTURE BY BIRTH PLACE .....................................................35 TABLE 7 ‐ WAGE GAP OAXACA DECOMPOSITION ...............................................................39 TABLE A‐1 ‐ DESCRIPTION OF EXPLANATORY VARIABLES ...................................................46 TABLE A‐2 – INTERNAL MIGRATION TO GBA BY REGION OF BIRTH ....................................47 TABLE A‐3 – IMMIGRANTS’S HUMAN CAPITAL BY REGION/COUNTRY ...............................47 TABLE A‐4 ‐ DISTRIBUTION OF UNEMPLOYMENT BY SPELL LENGTH ....................................48 TABLE A‐5 ‐ PROBABILITY OF BEING INFORMAL .................................................................49 TABLE A‐6 – WAGE GAP OAXACA‐BLINDER DECOMPOSITION.............................................50. LIST OF BOXES BOX ‐ ARGENTINA´S MIGRATION POLICIES ........................................................................13. 4.
(8) 1. Introduction Argentina is known as a nation of immigrants. The country is a fascinating case not only because international migration has been a central element in the construction and development of the nation, but also because Argentina went from being a net recipient of migrant flows (late nineteenth to mid-1950) to be a net exporter of highly qualified human capital in the last quarter of the 20th century. In the last decade, largely due to the recovery in economic activity this pattern has slightly reversed the composition of migration flows to and from abroad. The presence of about 10% of foreign population has important consequences for the society. Immigration from neighboring countries has always been governed by the same mechanisms that characterized spontaneous internal migration, despite the existence of a political border and restrictive immigration laws. Immigration, both transient and permanent, was traditionally considered a contribution to overcome the recurrent deficit of unskilled labor that characterized the economy. Thus, migratory flow showed great sensitivity to the economic cycle, increasing with GDP and labor demand growth to later fall in economic downturns. The movement of people from abroad may be controlled by different mechanisms, ranging from border control policy to the persecution of either illegal migrants or their employers. Migratory amnesties were systematically implemented to avoid illegality. As a matter of fact, enforcement of compliance with immigration laws is a tempting adjustment factor to regulate not only population size but also labor market problems. Given that migratory movements occur mainly with the aim of improving the employment situation of migrants and their families there is great interest in understanding the characteristics of the population to migrate, how they are integrated in the urban centers of employment, living conditions and especially the potential exposition to poverty given their vulnerability. For the United States, David Card (2009) confirms the empirical results found in earlier literature on the subject: the impact of immigration in the relative labor supply depends on the level of immigrants' human capital and the on-going labor market struggles. In the same vein, the evidence for Europe points out the negative impact. 5.
(9) of immigration on native employment which is exacerbated when labor market is not working well. The distributional impact arises not only through wages reduction for those workers who compete with immigrants, but also through the redistribution in favor of those employers who hired relatively more migrants or buy more migrant-intensive goods or services. Cheaper workers reduce costs, making firms more competitive along with the reduction in the price of those goods which are more intensive on migrants’ labor. The discussion about the social and economic consequences of immigration occupies the center of the debate in the first world due to impact migratory movements might have on local workers’ and the whole society. The policy significance of these questions is evident. Immigrants who have high levels of human capital and, hence, high productivity can make a significant contribution to economic growth. Conversely, if immigrants lack the skills that employers demand immigration may turn into a heavy burden as immigrants do not get jobs and increase the size of public assistance needy population adding a heavy load on public finances. The latter might as well exacerbate ethnic or racial turbulence. Despite all these edges of deep interest and relevance to the analysis of social problems, the issue is far from a place in the research agenda in Argentina. Few studies in the last decade investigated the characteristics and living conditions of immigrants and the pressure they might exert on labor markets and social infrastructure. This paper is the first of a more comprehensive study of immigrant´s situation in urban labor markets. The purpose is to understand the differences between native population and immigrants in terms of labor market insertion. We explore the labor market experience of immigrants in three key ways: the likelihood of being employed, the type of work they do, and their compensation. We apply a decomposition methodology in order to isolate the different sources of inequalities and the extent to which these changes are related to changes in the distribution of characteristics (composition effect) and in their returns (price effect).. 6.
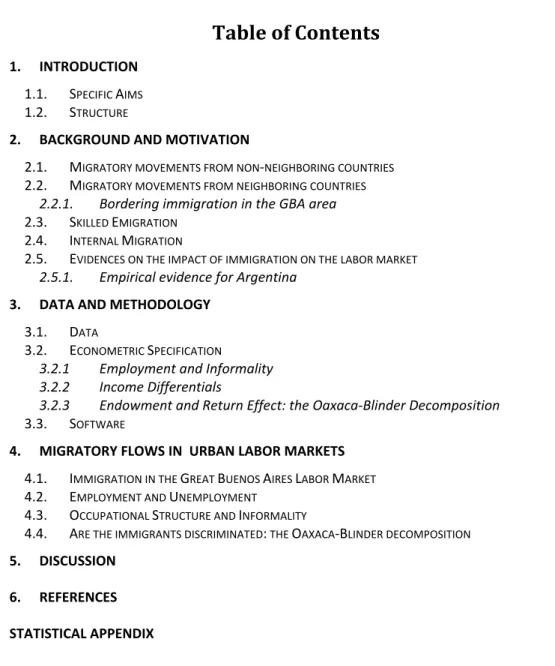
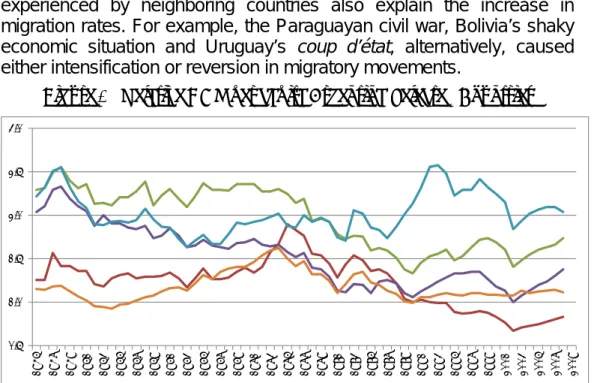
(10) 1.1. Specific Aims This research proposal seeks to advance the understanding of the impact of immigration on the economy with the following research questions: 1. Who are the migrants? Do internal migrants and international differ? Do immigrants differ from native population? Do recent migrants differ from settled migrants (more than five years)? 2. What is the situation of migrant workers with regard to the natives in terms of employment and income? 3. Does the impact vary with worker's human capital? Is there discrimination against immigrant workers?. 1.2. Structure The paper is organized in five more sections. Section 2 reviews the background and theoretical framework. In the following section we characterize immigration flows. We first start with the elaboration of the profile of native and migrant population according to birthplace and socio-demographic characteristics. In Section 3 we present the theoretical and empirical framework. Section 4 explores immigrants’ labor market profile in the Great Buenos Aires (GBA) area. The analysis focuses on three aspects: unemployment, occupational structure and income. Section 5 summarizes and discusses the main results.. 2. Background and Motivation One of the most notorious aspects in the development of Argentina’s society has been the contribution of international migration. Migratory movements were a key element in the construction and development of the country, in its population growth and in the labor force balance. Argentina’s international migration rates are among the highest in the world. Even when migratory movements have been irregular in terms of their size, Argentina can still be characterized as a high migration country. In the last 120 years, the most remarkable feature in terms of population relocation is that the country switched. 7.
(11) from being a net recipient of migration flows from the late nineteenth century until the 1950s, to expelling labor in the last three decades. Figure 1 - Net Migration Rate 1810-2008 60. 50. 40. 30. 20. 10. 1997 2000 2003 2006. 1991 1994. 1982 1985 1988. 1976 1979. 1961 1964 1967 1970 1973. 1922 1925 1928 1931 1934 1937 1940 1943 1946 1949 1952 1955 1958. 1907 1910 1913 1916 1919. 1901 1904. 1892 1895 1898. 1886 1889. 1880 1883. 0. ‐10. Note: Per thousand inhabitants. Source: Author’s based on Ferreres (2010).. By the late nineteenth century inmigration quickly acquired significant figures and steadily grew until World War II, when international flows dramatically fell. The latest wave of European migrants comes after the War. From this moment onwards, the origin of immigrant changed and neighboring countries became the exclusive source of migration inflows. Therefore, it is possible to divide the migratory process into two stages based on which source of international migration predominated: international migratory movements from non-neighboring countries and from neighboring countries.. 2.1. Migratory movements from non‐neighboring countries The largest inflow of European immigrants occurs between 1850 and 1913, period in which the consolidation of the National State begins. During this time the country received a large influx of immigrants and financial capitals, and becomes the largest recipient of immigrants in Latin America. At that time Europe faced unfavorable economic conditions, while Argentina experienced a substantial. 8.
(12) economic growth. This process was mainly led by the primary export sector. Rapid economic growth rendered the rapid expansion in employment levels. Since at that time the nation’s population was scarce, the growth in labor force needed to be sustained by international migration. Argentina’s employment opportunities and relative higher wages attracted workers inflow arrived mainly from Europe. Between 1870 and 1914 six million immigrants arrived, but only 50% settled permanently1. Italians were the largest immigrant group, between 1860 and 1900, they accounted for more than half of the total. They were followed by the Spanish, who in 1911 considerably expanded their arrival. This massive influx of immigrants favored as well population growth. Foreign contribution was so important for Argentina, that if there had been no migration between 1870 and 1960 the total population in the last year would have been almost half of what was showed by the census (Lattes, 1990). High wages were an important factor that drew to the country European immigrants. Salaries paid in Argentina between 1870 and 1900 were high compared to the ones paid in Europe (Figure 2). High salaries were offered due to high land productivity and favorable international prices. The increase in real wages was based in labor shortages, but was also helped by the increase in labor productivity. Evidence shows that both rural and urban salaries evolved similarly. Economic incentives were reinforced by favorable immigration policies. In 1876 the National Law number 817 to Promote Immigration was decreed, its central feature was the promotion of European immigration to the country. The national government went so far as to establish immigration agencies in Europe with the sole purpose of advertising the country’s advantages and labor opportunities. The outbreak of World War I interrupted the globalization and integration worldwide process of the former decades, with employment and salaries declination. This had a strong impact on Argentina; migrant inflows dramatically fell and negative net migration rates were 1. Despite the widespread belief that all immigrants settled in the country many of them took advantage of the hemisphere seasonality and made the most of their year by being in the north and in the south by harvest time (Llach and Gerchunoff, 2011).. 9.
(13) experienced over the next years for the first time in history. After the end of World War I the economy rebounded. Along with employment and salaries amelioration, US immigrant quotas regulation gave another boost to migratory movements towards the country. Figure 2 - Relative Wages Argentina- Rest of the World 3.5 3.0 2.5 2.0 1.5 1.0 0.5 0.0 1880. 1884 Arg‐USA. 1888. 1892. 1896. 1900. 1904. Arg‐Can. 1908. 1912 Arg‐Spain. 1916. 1920. 1924. 1928. Arg‐Italy. Source: Author’s calculations based on Williamson (1992).. The Great Depression Argentina affected again GDP growth rates. GDP fell 13% between 1929 and 1932 with an immediate impact on the labor market; the country faced high levels of unemployment for the first time in history, reaching 28% of the workforce. The scarcity of jobs and the fall in real wages were common characteristics until the mid forties. During this time, and for the first time in history, a selective immigration policy was initiated as long as Argentina´s embassies were ordered to request certificates of good health and behavior to potential immigrants. Moreover, in 1932 the government ordered Argentinean embassies in Europe to suspend work permits to immigrants that did not have a contract at the moment of requiring the permit. The economic decline together with the outbreak of World War II in 1939 caused a sharp reduction of European immigration that, nonetheless, remained positive: from 1939 to 1945 the net rate of entry was reduced to 0.88 ‰. After the end of WWII, the devastating effects of war generated the conditions for another European immigration wave. Europeans left. 10.
(14) their countries in search of better opportunities and Argentina became a natural destination due to the networks generated by already settled immigrants. The annual net inflow from overseas was about 7.5 ‰ between 1947 and 1951. Europe´s the rapid economic restructuring along with Argentinean economy’s slowdown halted the process by reducing the incentives to migrate. Indeed, by the second half of the twentieth century the advantages in terms of income per capita that Argentina had over Spain and Italy reversed, European immigration virtually stopped by the late 1950s. Since the 1960 decade, macroeconomic instability, overall economic slowdown, the establishment of military governments, political persecution and the deterioration of the social situation deterred European immigration. In fact, one of the hallmarks of the post-war period has been the strong political and macroeconomic instability that discouraged immigration and promoted emigration. This happened despite legislation on migration that preserved its preference for European immigration, even during restrictive times such as the years of the military regime (1976-1983). More specifically, in 1981 the General Law of Migrations and Promotion of the Immigration advocated “the immigration of foreigners whose cultural characteristics allow their suitable integration”, and discourage flows originating one of bordering countries.. 2.2. Migratory movements from neighboring countries Since the 1950s a new process starts, which can be characterized by the increase in migration rates from neighboring countries. From 1950 to the mid seventies, mainly for economic motives, migration flows from Chile, Paraguay, and Uruguay dominated. Traditionally linked to primary activities such as the exploitation of cane sugar, tobacco and tea, they settled in border areas. However, subsequently new migrants adopted internal migrant behavior and moved, in a second stage, to large urban centers like Buenos Aires, Córdoba or Rosario. In a third wave of immigrant they locate from the beginning in big cities. As pointed out by Grimson (2006), the first border migration flows had were essentially rural-rural, to become urban-rural and, finally, urban-urban. This has enabled migration that did not change dramatically in terms of its. 11.
(15) representativeness in terms of population over time, to gain "visibility" due to the shift from border areas to urban centers in the country. Figure 3 - Immigrants by Country of Birth 30. % of total poulation. 25 20 15 10 5 0 1869. 1895. 1914. 1947. Border Countries. 1960. 1970. 1980. 1991. 2001. Rest of the world. Source: Author based on Maurizio (2006), Table 1.4.. Historically, foreign labor force was welcomed due to the complementary role during economic booms, but was strongly questioned during times of depression. In terms of legislation, it was never defined a specific regulation against border countries immigration except during the last dictatorship government (see Box). In general, general immigration policies were common to overseas and border countries immigration (Marshall, 1978). Neighboring migration increased during periods of growing demand for jobs and better wages and reduced during economic recession, maintaining a social and labor logic that can be considered independent of the administrative logic. Proof of this argument is that amnesty measures for undocumented had no effect on migration patterns.. 12.
(16) Box – Argentina’s Migration policies Argentina has a set of regulatory instruments and normative standards to control migration. Immigration policy in Argentina seeks to address the situation of immigrants in the country and Argentinean citizens abroad, promoting, in the first case, respect for human rights and their integration into society and Argentina in the second, political participation, connection and possible repatriation. The most important laws and programs are: the law of immigration, the law and recognition of refugee protection, the law on human trafficking, the national constitution, international treaties and bilateral agreements on migration and all regional agreements. The new migration law (Law 25.871) sanctioned in 2003, embodies the spirit of international human rights treaties ratified by Argentina. This law establishes the basic guidelines of Argentinean migration policy, regulating all matters relating to immigration policy and the rights and obligations of foreigners in the country. The Argentinean migration law explicitly establishes the need to ensure the integration of immigrants into the society and promotes the adoption and execution of policies aimed at regularizing the immigration status of foreigners. To meet these objectives, the government created in 2004 the National Documentary Standardization Program for foreigners Immigrants that proceed from countries members of the Common Southern Market (MERCOSUR) and associated States (Bolivia, Brazil, Chile, Colombia, Ecuador, Paraguay, Peru, Uruguay and Venezuela) and foreigners from other countries as well. This policy helps guarantee the access to a set of social and labor rights on the one hand, and obligations on the other hand that required to achieve full participation in that society. The General Recognition and Refugee Protection Law. (Law 26.165) establishes state's commitment to protect refugees and people seeking that status, guaranteeing respect for fundamental human rights. Law on the Prevention and Punishment of Human Trafficking and assistance to victims, defines and punishes the crime of human trafficking in the national territory, contemplating sanctions on the capture, transport or transfer and harboring or receiving of persons for sexual exploitation, labor or organ removal.. 13.
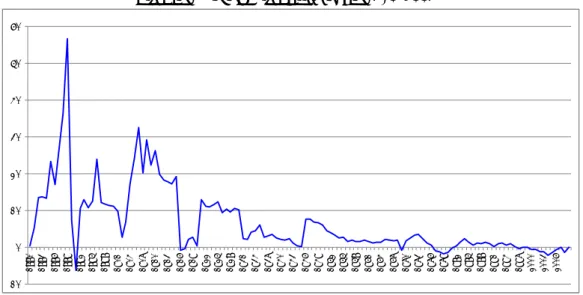
(17) Immigration flow dynamics has been responsive not only to Argentina’s economic and political circumstances but to the different stages of economic development and changing political situation experienced by their countries or origin as well. In that sense, income differentials appear to be the driver of relocation decisions in the region. For instance, during the second half of the twentieth century, Argentina’s per capita GDP doubled the one of Bolivia, Peru and Paraguay (Figure 4). The different social and economic situations being experienced by neighboring countries also explain the increase in migration rates. For example, the Paraguayan civil war, Bolivia’s shaky economic situation and Uruguay’s coup d’état, alternatively, caused either intensification or reversion in migratory movements. Figure 4 - Relative GDP per capita Argentina-Selected Countries 3.0. 2.5. 2.0. 1.5. 1.0. Arg‐Chile. Arg‐Peru. Arg‐Uruguay. Arg‐Bolivia. 2009. 2007. 2005. 2003. 2001. 1999. 1997. 1995. 1993. 1991. 1989. 1987. 1985. 1983. 1981. 1979. 1977. 1975. 1973. 1971. 1969. 1967. 1965. 1963. 1961. 1959. 1957. 1955. 1953. 1951. 1949. 1947. 1945. 0.5. Arg‐Paraguay. Source: Author based on Maddison (2012).. Nevertheless, beyond specific situations that encourage or discourage inflows to Argentina, for some countries this has been a recurrent phenomenon. Indeed, the difference of income that Argentina has over other countries has shaped structural conditions that explain the continuing inflow of migrants from the region, even when the country’s experiencing economic downturns. The consolidation of a regional labor market, the existence of networks originating from previous flows and development income differentials that favor. 14.
(18) Argentina appear to be the most important pull factors that help explain the persistence of these flows. 2.2.1. Bordering immigration in the GBA area. Despite the concentration in the GBA of bordering countries inflows since the decade of the 1960s, not all groups modify its pattern of establishment at the same time. Dramatic changes in the concentration of the immigrants from Bolivia and Paraguay occurred between 1980 and 2010 in the GBA (Table 1). Peruvian immigration, though not included in the Table shows a similar pattern with more than two thirds living the metropolitan area. If we consider that these three groups were those that grew the most, this modification in the residence destinies entails not only a redistribution to the interior of the group, but also a concentration in the GBA area. In parallel, Chilean and Uruguayan immigration did not change their historical trends. Table 1 Composition of Immigration by Country of Origin GBA 19602001 Census 1960 1980 1991 2001 2010. % Total Country Immigration in Argentina living in GBA Bolvia Brazil Chile Paraguay Uruguay 12 24 16 28 62 37 24 19 62 80 39 27 18 65 81 51 31 17 73 75 55 41 18 75 74. Note: in 2010 72% of Peruvian immigration was in the GBA. Source: Author based on * 1960-2001, Pacecca and Courtis (2008), Cuadro 4; 2010: own estimates based on INDEC (2012).. 2.3. Skilled Emigration Military regimes and the suppression of civil and academic liberties caused professionals and scientists to leave the country from the late 1950s until early the early eighties. The “brain drain” increased significantly in the last military government. From 1976 to 1983, the government implemented a massive persecution of intellectuals, students and professionals. The end of persecution and the return of. 15.
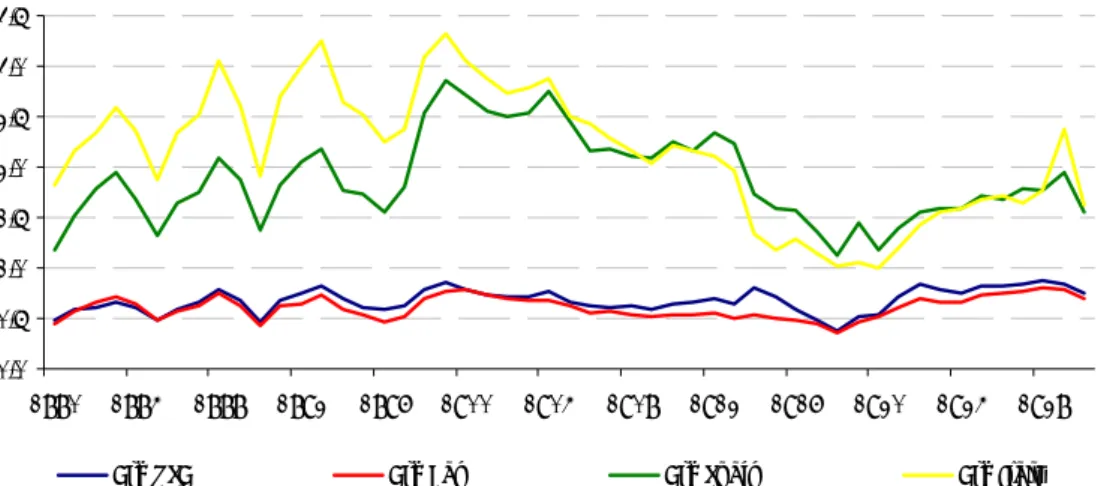
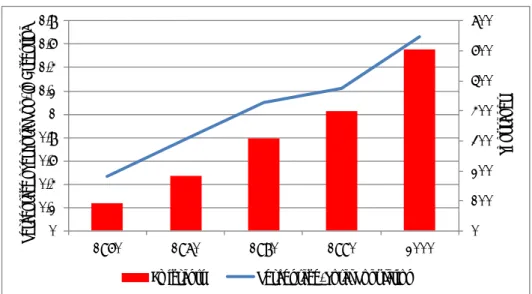
(19) democracy reduced the “brain drain”, nevertheless the lack of scientific and technological policies, along with the absence of funding for these activities vis-à-vis developed countries did not stop the process; the slowdown of the last four years was fueled more by the international financial crisis of 2008 than by government policy. Emigration may be expected to have important consequences too. The effects could be either positive or negative. The positive effect comes from the contribution of the Diaspora to the sending country by remittances and business links that favor the country such as the Indian Diaspora. The negative side arises when emigration entails a significant loss of human capital that deters inversion and threatens economic growth. Emigration is a regional feature. Argentina is an intraregional receiving country. As of 1960 the stock of immigrants grew being multiplied by almost 5 (see Figure 5). Change occured not only in flow sie but included as well dramatic modifications in destination; between 1960 and 1980 the majority of emigrants switched from regional destination to extra regional destinations after 1990 (Calvelo, 2011)2.. 1.8. 700. 1.6. 600. 1.4 500. 1.2 1. 400. 0.8. 300. 0.6. 200. 0.4 100. 0.2 0. 0 1960. 1970 Emigrants. 1980. 1990. 2000. Percentage/Total Population. Source: Author based on Calvelo (2011), Cuadros 1 and 3.. 2. 65% of emigrants in 2000, were to non‐regional places (Calvelo, 2011:75).. 16. Thousands. Percentage over Total Pop. In Argentina. Figure 5 - Emigration 1960-2000.
(20) In the last years, Argentina’s government through the Foreign Ministry aims to ensure assistance if needed. The government is committed to maintaining permanent exchange routes between nationals living abroad and their country of origin. There are programs that provide Argentine scientists living abroad the opportunity to join research networks made up of local and foreign groups, so they can establish links with their country of origin and, eventually, proceed to return to it (RAICES program).. 2.4. Internal Migration An important fact to be noted is that the territorial distribution of Argentina’s population has never been homogeneous. Historically, population has always settled in richer territories, for example in 1895 only five provinces (Buenos Aires, Córdoba, Santa Fe, Entre Rios and Tucuman) concentrated 53% of the total population. As yet, most of the population is concentrated in Buenos Aires Province, where 38% percent of the total population of the country lives. Internal migratory movements have helped the consolidation of urban agglomerations. Internal migration can be defined as the change of residence of a person within a country. After 1930 internal migration was crucial as providing labor force in the urban markets by replacing overseas migration. People from rural areas moved to large urban areas, phenomenon known as rural flight. Buenos Aires, being the capital and the main center of commerce receives the largest migratory inflows3. Since the mid 1970's and during the following decade, recession induced a reduction in the rate of growth of both labor supply and demand and an income drop that affected the internal and international migration to the metropolitan area. Return migration to either immigrants home provinces or countries (in the case of foreigners) reduced immigration rate below its historical levels. The nineties were a particular period the macroeconomic recovery of 1991-1993 fueled, though for a brief period, internal immigration to 3. Internal immigration analysis has a limitation when based on the PHS. The place of birth is coded according to province and not by city or town; thus, any study based on the PHS is constrained to interprovincial movements. For more details, see Pizzolito (2006: 7).. 17.
(21) GBA. But after the Tequila crisis, given the drop in labor demand in domestic immigrants traditional sector of insertion, internal relocation movements downsized. Cortés and Groissman’s (2004) suggest that open unemployment worked as the deterrent for internal immigration to the area. According to the 1970/1980 census data, about 24% of the native population had migrated to another province or locality. It is still relevant nowadays as noted by the 2001 census; international migrants represent only 5% of the total population, while 19% of the native population has migrated internally. New industrialization policies carried by the government have helped promote a new wave of migrations towards the Patagonia. The 2001 Census indicates that the regions with positive migration rates where the Patagonia, the Pampas and Cuyo. And on the other side, the northeast and northwest of the country showed negative migration rates. Regarding immigrants’ characteristics, Pizzolitto (2006) reports that women, young and adults prevailed among internal migrants flows. Internal immigrants share with border countries immigrants lower levels of human capital when compared to native population. With respect to income on average income levels are higher for non-migrants; however, if the analysis is performed by geographic region, with the exception of Buenos Aires, the average income of internal migrants is higher.. 2.5. Evidences on the impact of immigration on the labor market Most studies of the economic impact of immigration are motivated by the desire to understand how immigrants affect various dimensions of economic status in the host country’s population. This motivation explains the persistent interest in determining whether immigrants “take jobs away” from native workers. Immigrant workers’ location decisions should be more responsive to interstate wage differentials than those of natives. As a result, immigrants play a crucial role in the labor market: they are “marginal” workers whose location decisions arbitrage wage differences across regions. Moreover, migration costs prevent many native-born workers from moving to those states that offer the best economic opportunities. Immigrant workers, in contrast, are a self-selected sample of persons who have chosen to incur those migration costs. For instance, as long. 18.
(22) as migration costs are mainly fixed costs, newly arrived immigrants will choose to live in those cities that offer the best economic opportunities. The empirical evidence, suggests that immigrants improve labor market efficiency by providing additional and complementary labor force. Labor market impact of immigration depends on the size and geographic location of the immigrant population and on the skills they bring to the labor market and how these skills compare with those of natives (Borjas, 2006:4). Broadly speaking, immigration is not detrimental to the host labor market or economy. Most of the research on the labor market impact of immigration has been concerned with the impact of immigration on wages rather than labor force participation or unemployment rates. Borjas (2003) noted that the impact of wages fluctuates from study to study but “clusters around zero” which is contradictory with theoretical prediction of a downward pressure. Whether the reasons are methodological issues (misspecification, endogeneity, and heterogeneity), market forces in specific cases (area vs. factor proportion approach4) or institutional factors has not been established. A meta-analysis of international research (Longhi et at, 2004) identifies common findings that are also likely to apply to Argentina. With an overall mean of -0.119 standard deviations on wages, the authors highlight that the downward effects is larger in more rigid labor markets, that studies that do not control for endogeneity of the proportion of immigrants underestimate the size of the impact and that the wages of earlier immigrants are more likely affected by new immigrants that the wages of native population. Another important question for policy is the impact on employment outcomes labor force participation and (un)employment rates. The international literature on the impact of immigration on (un)employment is less extensive than on wages and the impact of immigration on labor turnover and transitions appears to date not researched.. 4. The area approach supports a negative correlation between concentration of immigrants and wages. In contrast, the factor proportion approach estimates the impact utilizing a general equilibrium model and a production technology that allows the inclusion of different types of labor.. 19.
(23) 2.5.1. Empirical evidence for Argentina. In recent decades, there has been abundant literature on border countries immigration and its impact. There are both comprehensive studies of the phenomenon as well as studies on specific national groups. Several analyses focus on the relationship between migration, employment and labor market, particularly in the GBA. Specific studies by immigrant country of origin are thoroughly reviewed by Pacecca and Courtis (2008). For instance, some papers reviewed Chilean migration in the Patagonian provinces of Neuquén, Rio Negro and Chubut and their insertion in rural activities; Brazilian immigration in the GBA among others. However, immigration policies and discrimination against immigrants, legal and political status of this population, access to social protection and other rights migration from other neighboring countries have been less studied. In general, migration literature has focused on analyzing the profile of both internal and foreign immigration in the labor market. Those analyses tend to compare most internal versus foreign immigrants more than foreign versus native workers. If in the 1970s and 1980s both groups had similar educational levels, from the 1990s, their trends changed. The macroeconomic crisis of 1995 contracted labor demand in construction, housekeeping and manufacturing sectors. Despite the increase in open unemployment in both groups of immigrants, response was different by population subgroup; while internal immigration slowdown or even reverse, migratory flows from neighboring countries kept their pace due to the overvalued local currency. High unemployment and relative abundance of supply of immigrant labor arguably fueled the extension of poor working conditions among recent border migrants who worked on low-quality working conditions: without labor legislation protection, extended hours and low wages (Cortes and Groissman, 2004). In general terms, there are two hypotheses about neighboring segments and internal migration competition for jobs. The first position holds that there was rather a degree of "complementarity" or "absence of competition”; Benencia and Gazotti (1995) sustain that the contribution of migration to neighboring open unemployment in the metropolitan area had been minimal during the 1990s.. 20.
(24) Marshall (2000) argued, instead, that evidence would support the hypothesis that border migration competed in the margin with other migrants for the same jobs. In that sense, Maguid (2001) accepts the existence of a certain level of competition between native and recent migrants from neighboring countries in the metropolitan area in recession times5. Jobs that during the peak stage of the import substitution model were considered “poor quality” turnt into desirable by internal migrants. Cortes and Groisman (2004) proposed shifting the focus of the analysis from internal migrants’ voluntary decisions of where to work to labor demand role in the distribution of jobs among various population groups. The authors report that during the expansion cycle border countries migrants’ jobs grew faster than that of internal migrants, exactly in the same branches of activity where the latter were concentrated. However, while during recessions the construction and domestic service both types of migrants lost their posts, recovery only increased employment for bordering workers. Their acceptance of lower wages and longer workdays, made them more attractive to employ. Regarding labor market prices, the skill composition of migrants relative to non-migrants is crucial in determining wage results. Docquier et al (2010) provide a clear result that immigration has a positive average wage effect on non-migrants except for Argentina while emigration has a negative average wage effect (again Argentina is the opposite). The effect of net migration on average wages reported in Table 2 is positive for Canada, Australia and Singapore, negative for Portugal and Poland and, generally negative but small for the other Western European countries. Moreover, Table 2 reports that worldwide immigration has a negative effect on wages of highly educated workers; conversely emigration has a positive effect on those wages. As a whole, Argentina is more open to labor movements than the EU156 countries though 5. The migrant‐native competence was supposedly more visible in construction and domestic service.. 6. The EU15 comprised the following 15 countries: Austria, Belgium, Denmark, Finland, France, Germany, Greece, Ireland, Italy, Luxembourg, Netherlands, Portugal, Spain, Sweden, United Kingdom.. 21.
(25) migratory flows skill composition is the opposite. Immigration levels for both the high-skilled (1.5) and the low-skilled (3.5)7 are higher when compared to the emigration levels (0.5 and 1.6% respectively). There is a net loss of human capital due to the reception of low skilled immigration that outweight the emigration of highly qualified human capital (3 vs. -01 percent), respectively (Docquier et al, 2010). Table 2 Impact of Migratory Flows on Wages Migratory Flows a/ Low. Immigration Emigration Net Migration. High. 3.5 0.5 3.0. 1.5 1.6 ‐0.1. Simulated Wage Impact Average. ‐0.1 ‐0.1 ‐0.2. Low. ‐0.6 ‐0.5 ‐1.0. High. 0.4 0.2 0.7. Note: a/As percentage of the reference skill-group. Source: Author based on Docquier et al (2010), Table 1 and 3.. Positively selected emigration has a positive effect of 0.2% on average wages of the group while negatively selected immigration has a negative impact of -1.0% on the low human capital segment that offsets the former effect on economy´s average wage. The net effect is negative -0.2%. What is the channel through which natives benefit or are harmed as a result of emigration? The emigration of engineers and scientists implies that that the supply decreases while the opposite happens for low skilled workers. The increase in the supply originating in border countries causes a downward pressure on the group average wage (Borjas, 2009).. 3. Data and Methodology 3.1. Data We use the Permanent Household Survey (PHS) of the National Institute of Statistics and Censuses (INDEC) for the second quarter of 2011. The PHS is conducted quarterly in major urban centers in the country. The design shows the EPH is a stratified sample with a rotating panel of 25% of the sample being replaced each round. 7. In the EU15, however, those levels are 2.6 and 1.6 as long as they experience a net inflow of highly qualified population (Docquier et al, 2010) .. 22.
(26) The PHS covers 31 urban centers, still representing about 65% of the urban population. In fact, all the provincial capitals and all cities over 100,000 people are covered by the survey. This paper reports on the geographic area known as Great Buenos Aires which is composed of two main areas: the city of Buenos Aires and Greater Buenos Aires, composed of 24 districts of the province of Buenos Aires8 (INDEC, 2003). The PHS gathers information on the individual situation and personal characteristics of individual respondents as well as information on employment status taking as reference the week before the month preceding the survey. In terms of personal, demographic and economic information on each household member: employment status (employed, unemployed or inactive), relationship to head of household, age, gender, marital status, hours worked in the past week, task type, company size and sector of activity, type and amount of income, education level, number of children, hours worked, etc.. People who work as employees respond to the type of benefits they receive making it possible to establish the formality of labor relationship. Methodologically, we classify immigrants into domestic (if born in Argentina), border (if born in Chile, Paraguay, Bolivia, Chile or Brazil) and non border (if coming from the rest of the world) immigrants. In some cases, we also divide immigrants between recent (less than 5 years) and non recent (more than 5 years) immigration.. 3.2. Econometric Specification We explore the labor market experience of immigrants in three key aspects: the likelihood of being employed, the job posts they take and the level of their compensation. 3.2.1 Employment and Informality. A logit model is estimated to evaluate the probability of employment given a set of explanatory variables. The general model for employment status can be written as 8. 14 of these districts are fully urbanized while 10 are only partially urbanized (INDEC, 2003).. 23.
(27) Empi = βxi + u i The former equation states that employment is a function of the set of exogenous variables plus some random error component, ui, for individual i. The determinants of employability include observable characteristics traditionally used in employment probability models. Because of the labor market’s segmentation, the probability of benefiting from regulations varies across individuals according to personal characteristics and labor market insertion. A second equation estimates the probability of being formal or, more specifically, having regulatory protection9. Again, we estimate a logit model where the dependent variable is a dummy over whether the worker makes pension contributions. Inf i = γxi + u i The correlates, described in detail in Table A-1 in the Statistical Appendix, are: Educational level: Higher educational level implies higher productivity and should increase the probability of being both employed and in the formal sector. Lower educational level workers could be pushed to the informal sector because their low productivity may not be enough to counter the costs of minimum wage and other laws. Experience: Experience increases general human capital and, hence, productivity and employability of any worker. Branch of Activity: A purely empirical set of correlates to account for sector specific differences in the enforcement capabilities of control agencies, the degree of monopsony power, unionization and instability of activities. Household Head: In Argentina the regulatory framework favors precarious insertion for so-called “secondary” workers10. There is no 9. In the labor market literature, there is more than one definition of informality. Formality could be defined in terms of the firm size or social security and labor legislation protection. 10. Secondary workers are those who are not household heads such as, in general, wives and young workers (19 to 25 years old).. 24.
(28) incentive to register, since health and other programs will not recognize more than one contribution per household (Montoya and Mondino, 1999). 3.2.2. Income Differentials. The most widely used specification of empirical earnings equations, and the point of departure for our analysis, is the Mincer equation: Υi = α +β 0 I i + β 0 BCi + β 0 NBC i + γ X i + ε Where Y is income; Xi is vector of personal and occupational variables. Dummies for border, non-border and internal immigrants are included being native workers the omitted category. The error term ( ε i ) captures unmeasured variables. 3.2.3. Endowment and Decomposition. Return. Effect:. the. Oaxaca‐Blinder. Having measured the existence of inequalities in income between migrants and non migrants, an immediate step is to find the factors that explain it and determine if there is or not discrimination in the labor market. Estimation of labor market discrimination by gender, race, and ethnicity has become routine since the popularization of the wage decomposition methodology by Blinder (1973) and Oaxaca (1973). The Oaxaca (or Blinder-Oaxaca) decomposition is typically used to assess the determinants of mean wage differences between two populations of workers (e.g.: male and female). Differences in the mean characteristics of the two groups are weighted by the estimated coefficients for the nondiscriminatory wage standard and summed to obtain the human capital portion of the overall wage differential. The discrimination portion of the overall wage differential is the residual left over after netting out the human capital portion. The simplest decomposition procedure is to adopt one of the estimated wage structures as the nondiscriminatory norm. Equivalently, the discrimination portion can be directly obtained as the summed difference in estimated coefficients between the two. 25.
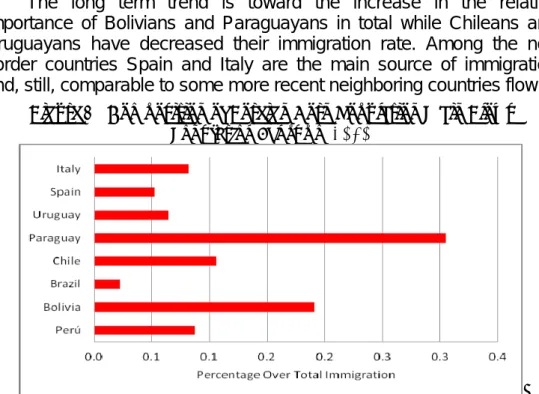
(29) groups of workers weighted by the mean characteristics of the subordinate group. An implication of this procedure is that the entire discriminatory wage differential is ascribed to underpayment of the subordinate group rather than to overpayment of the dominant group. This is an ongoing discussion in the literature as could be the case that observed outcomes are not discrimination against of one group but positive discrimination in favor of another group. Lauer (2000) extended the method to include a third component which is resulting from the interaction between return and endowments. For instance, considering two subgroups, Native and Migrants the income gap ( ΔANM ) could be decomposed as follows: n. (. ΔANM = ∑ βˆ iM X iN − X iM i =1. ) + ∑ (βˆ n. i =1. N i. ). n. (. )(. − βˆ iM X iM + ∑ βˆ iN − βˆ iM X iNW − X iM i =1. ). Where Xi includes for expositions’ simplicity all explanatory variables from the Mincer equation and βˆ includes all coefficient an explanatory variables. The first term represents the achievement difference due to different endowments. The second is the differences in the marginal product of the endowments of each independent variable. The last term is the difference which arises from the interaction between eventually better “production process” between natives and non-native workers.. 3.3. Software Estimations are conducted in STATA 11 (StataCorp. 2007. Stata Statistical Software: Release 11. College Station, TX: StataCorp LP) and use the oaxaca9, jmpierce, margeff, gdecomp and kdens packages.. 4. Migratory flows in urban labor markets According to the last Population Census of 2010 there were 1,805,957 foreigners living in Argentina of whom 69% were from border countries (that jump to 78% if Peruvian-born population were included). The most numerous groups are Paraguayans (30%), Bolivians (19%), Chilean (11) and Peruvian (8%). Brazil, probably due to language, is underrepresented in the regional flows (See Figure 6).. 26.
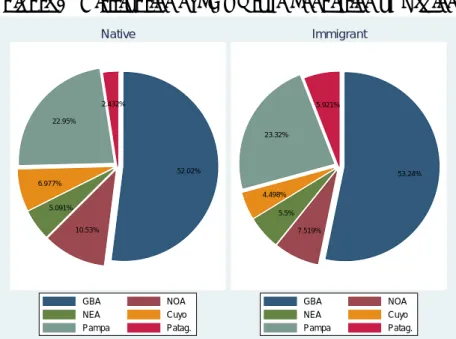
(30) The long term trend is toward the increase in the relative importance of Bolivians and Paraguayans in total while Chileans and Uruguayans have decreased their immigration rate. Among the non border countries Spain and Italy are the main source of immigration and, still, comparable to some more recent neighboring countries flow. Figure 6 - Composition of Foreign Born Population Main Flows Population Census of 2010. Source: Author based on INDEC (2012).. In terms of geographical distribution, Figure 7 show immigrants do not dramatically differ from native population. However there is one region that clearly has a larger share in total immigration, the Patagonia while the NOA and Cuyo are less attractive to migration flows. The usual concentration centers are (Roldán y Llach, 2001) Gran Buenos Aires (City of Buenos Aires plus the main Municipalities), Rosario and Córdoba11. Sluggish development in some regions causes emigration in search of better job opportunities and services such as healthcare, education and housing among others.. 11. From Roldán and Llach (2001) and INDEC (2012) we could infer, however, that the relative importance of different urban centers has varied over time While in 1869 Great Buenos Aires concentrated around half of the population this has been reducend to a third in 2010. The percentage from Roldán and Llach are 38, 48, 46, 47, 41 for 1869, 1914, 1947, 1970 ad 1991 respectively. Final results from INDEC (2012) reduced this percentage to 32%.. 27.
(31) Figure 7 - Distribution of PHS Urban Population by Region Native. Immigrant. 2.432%. 5.921%. 22.95% 23.32%. 52.02%. 53.24%. 6.977% 4.498% 5.091%. 5.5% 10.53%. 7.519%. GBA. NOA. GBA. NOA. NEA. Cuyo. NEA. Cuyo. Pampa. Patag.. Pampa. Patag.. Source: GBA: Great Buenos Aires; NEA: North Easte; NOA: North West; Cuyo: Mendoza, San Juan and La Rioja; Patag (South) Patagonia. Source: Author based on PHS.. 4.1. Immigration in the Great Buenos Aires Labor Market To estimate the contribution of migrants in the Greater Buenos Aires is important to firstly have a dimension of the problem. Foreign population accounts for less than 10% of the total population while they represent 23% of the population in Australia, 12% in France, 13% in Germany, 26% in Switzerland and almost 11% in the UK is foreignborn12. In Latin America, Chile is around 2%, 0.3% in Brazil and in Mexico it does not reach even 1% of country´s total population. Table 3 reports the composition by place of birth of the total population and economically active population (EAP) or labor supply in the area in 1974 and 2011. Natives become more important in the total population while, in turn, there is a change in the internal composition of the migrant group. Internal immigration lost representativeness in 2011 in terms of the EAP: while in 1974 represented a third of the labor force 12. OECD (2011).. 28.
(32) in the area, in 2011 the percentage decreased to only a fifth in 2011. Immigration from neighboring countries has not changed substantially their contribution to the population and labor supply in the area (a 10% increase from 4.5% to 5%). Table 3 Immigrants in GBA, 1974 and 2011 Native. Immigrant Condition International Internal Border Non Border. Total. May 1974 Population EAP Employed Unemployed Second Quarter 2011 Population EAP Employed Unemployed. 67.6 56.2 55.7 76.6. 21.1 33.1 33.5 18.4. 2.8 4.5 4.5 4.1. 8.4 6.2 6.3 0.9. 100 100 100 100. 73.6 71.7 73.4 74.1. 19.2 20.3 20.1 19.8. 4.4 5.0 4.1 4.0. 2.7 3.0 2.4 2.1. 100 100 100 100. Note: EAP: economically active population. Source: Author based on PHS and Montoya and Perticará (1995).. While internal movements of population cannot be questioned in the assignments as they respond to interregional population, they should be be analyzed in terms of origin and socio-demographic characteristics and their impact on the urban labor market and all the suburban infrastructure. Although internal relocation cannot be subject to "restrictions" or "selectivity" they bring attention to the social and labor policies in the areas of origin and the eventual contribution to poverty and marginality. The higher incidence of migration on labor supply is closely linked to age and sex composition of the immigrant population. Thus, although the determinants of migration decisions are complex, the opportunities for better income might be crucial. The migrating population is primarily working-age population, Table 4; 90% of the immigrants are under 45 years, with the majority group between 15 and 34 years. Women are overrepresented among immigrants. Pacecca and Courtis (2008) have already brought attention to the feminization of. 29.
(33) immigration as a distinctive feature of border country immigration since 1960 on. The authors noted, nevertheless, that the trend is not the same by country of origin. Those who changed the most in the last 30 years were Chileans and Bolivians who were traditinioally dominated by men and now are overrepresented by women. Feminization of Bolivian, Paraguayan and Peruvian immigration parallels the increase in their residential concentration in the GBA. Human capital accumulation among migrants is lower than those of natives. There is, again, heterogeneity in the migratory flow composition for both internal and border country flows. Internal immigration has a slightly lower level of human capital though there are differences within the group. Migration from Northeast and Northwest provinces, which have worst educational indicators (higher dropout rates and lower than average student achievement in standardized tests) favored emigration13. Cortés and Groisman (2004) sustain that job destruction was also higher in these provinces expelling population towards the GBA area. Regarding international flows, Peru and Uruguay’s migratory flows display higher level of formal schooling, while Brazil’s and Bolivia’s flows have significant higher percentages of immigrants with less than four years completed when compared to the former countries (Table A.3 in the Appendix). 40% Bolivians and Paraguayans did not finish more than Primary Education. Human capital influences levels of labor market participation. Peruvian immigrants, with more years of study exhibit higher activity rates and have the lowest levels of unemployment (Pacecca and Curtis, 2008).. 13. Tables A‐2 and A‐3 in the Statistical Appendix reports human capital migration composition by region and country of birth for internal and foreigh immigration to the GBA area.. 30.
(34) Table 4 Who are the Immigrants GBA – Second Quarter 2011. Natives. Immigrants Internal. Gender. Border. Total Non Border. 100.0. 100.0. 100.0. 100.0. 100.0. Male. 49.6. 45.7. 41.1. 41.0. 48.2. Female. 50.4. 54.3. 58.9. 59.0. 51.8. Age. 100.0. 100.0. 100.0. 100.0. 100.0. Less than 15 y.o.. 32.2. 4.8. 5.3. 6.3. 25.0. 15 - 24. 16.1. 7.5. 11.5. 11.4. 14.2. 25 - 44. 29.3 15.8. 28.0 34.5. 38.6 29.5. 23.5 18.3. 29.3 20.1. 6.6. 25.3. 15.1. 40.5. 11.5. 100.0. 100.0. 100.0. 100.0. 100.0. 18.3 45.1. 50.4 30.0. 45.1 46.0. 38.3 42.2. 23.6 43.1. 36.6. 19.6. 8.9. 19.5. 33.4. 45 - 64 More than 65 y.o Education * Secondary Imcomplete Secondary College. Note: * Population between 19 and 59 years old. Source: Author based on PHS.. 4.2. Employment and Unemployment In order to evaluate the impact of the migrants in the labor supply and the population it is useful to analyze its contribution to unemployment. A first conclusion from Figure 8 is that unemployment rate is higher among natives and internal migrants when compared to foreign workers. A second conclusion from Figure 8 is that migration of less than 5 years have higher unemployment rate with internal immigration being the most disadvantaged group. Anecdotal evidence justifies the labor outcome in the strengths of formal and informal networks. A related aspect to assess the situation of different reference population in the labor market is unemployment duration (see Table A4). Unemployment spells are notoriously low for migrants from neighboring countries especially for recent arrivals. Several factors explain the outcome such as the riskier financial situation, lower expectations in terms of working conditions, lower reservation wage and whether or not there is signed contract prior to the migration decision.. 31.
(35) Figure 8 - Unemployment in the GBA Total Non Border Country Border Country Internal Natives 0.0. 5.0. 10.0. Recent. 15.0. 20.0. All. Source: Author based on PHS.. An alternative way to ascertain the difficulties to get a job is to approximate employment likelihood. Table 5 reports the estimates of a logit model being the dependent variable having employment. In a logit specification the relationship between the dependent variable, having employment and each of the covariates is on the logit scale. These estimates tell the amount of increase in the predicted log odds of employment = 1 that would be predicted by a 1 unit increase in the predictor, holding all other predictors constant for the base category (native, female, single with high school completion) 14. Because these coefficients are in log-odds units, they are often difficult to interpret, so they were converted into odds ratios.. 14. For the independent variables which are not significantly different from 0, they should not be taken into account.. 32.
(36) Table 5 Determinants of the Probability of Employment All Female Demographics Characteristics Male 1.50** . . (‐0.21) Age 1.18*** 1.18** Married Migration Condition Internal Border Non Borderc C.. College. . . 1.18**. (‐0.05). (‐0.06). (‐0.06). 1.67***. 1.16. 2.71***. (‐0.25). (‐0.24). (‐0.55). 0.79. 0.87. 0.71. (‐0.13). (‐0.23). (‐0.15). 1.73. 5.52*. 0.85. (‐0.65). (‐4.21). (‐0.38). 1.36. 2.28. 0.72. (‐0.72). ( ‐1.88). (‐0.47). 1.9. 0.93. 4.71. (‐0.96). (‐0.56). (‐4.89). 0.69*. 0.82. 0.56*. (‐0.12). (‐0.26). (‐0.13). 1.41*. 2.11***. 0.91. (‐0.23). (‐0.44). (‐0.2). Human Capital Primary Incomp. Primary Comp. Male. Note: Base category Native, Female, High School completed, Single. t-statistics in parentheses; *** p<0.01, ** p<0.05, * p<0.1 The odds ratio is defined as the probability of success over the probability of failure. Source: Author based on PHS.. For instance, the coefficient (or parameter estimate) for the variable male is 1.5. This means that for a one-unit increase in male (in other words, going from female to male), we expect a 1.5 increase in the log-odds of the dependent variable employment, holding all other independent variables constant. The same analysis pertains to married or having a partner status that has a positive impact on the probability of getting a job for men (2.71) while not statically different from zero for women.. 33.
(37) In the case of human capital, having a college degree or more has a dramatic effect on women´s employability (2.11) while not having finished elementary education decreases the probability as long as the odds ratio is below 1 for men (0.58). It is remarkable from the table the higher and, statistically, significant probability of employment of female border immigrants in the female subsample (6 times). This usually happens as they work mostly as maids. This kind of job insertion has certain advantages for these women; it is an occupation of relatively easy access, does not require much experience, and resolves housing issues facilitating remittances15. Moreover, this job favors “invisibility” for migrant women, and thus protects them from the risks associated with irregular residency16.. 4.3. Occupational Structure and Informality Table 6 reports composition of the employment by industry in the GBA and how it differs between natives and migrants. Migrants tend to be concentrated in sectors where flexibility is high due to intrinsic characteristics. Immigrants work, regardless of year of arrival, in the construction, domestic service, and manufacturing industries. In that sense, current sectoral insertion patterns of migrants did not substantially change from past trends. These three sectors occupied more than two thirds of border countries immigration (69% among males and 73% of females) and almost 50% of internal migrants, respectively. Those percentages are remarkably higher than the 46, 4% and 32, 3% reported by Cortés and Groisman (2004:182). Excessive urbanization and expansion of the service economy are often attributed as the cause for immigrants’ marginality; given immigrants lack of adaptation to the needs of the productive sector and, their lower levels of human capital, they end by being inserted on low15. Historically, housekeeping and maid service had been provided by international immigration; Europeans, mainly Spanish at the beginning of the 20th century, domestic immigrans towards 1940, and border since 1960 on (Jelin, 1977).. 16. The drawback of these jobs are among other labor mobility (maid work is a dead end job), difficulties to continue formal education, may involve endless hours of work, abuse by contractors, instability due to informal recruitment.. 34.
(38) productivity activities. In Argentina's economy the employment of migrants did not take this feature as its role in the labor market has been traditionally considered as complementary or additional to native labor, making migrants predominate in certain occupations or jobs that natives population did not want to take. Table 6 Occupational Structure by Birth Place Immigrants. Natives Internal Male Manufacturing Retailing Public Adm, Education Services Other Building Female Manufacturing Retailing Public Adm, Education Services Other Housekeeping. Total. Border Non Border. 16.6 20.8 13.7 23.0 12.7 13.2. 15.2 17.1 16.4 23.6 11.3 16.4. 19.5 12.0 3.8 19.0 8.7 37.1. 21.0 21.7 6.7 38.2 8.1 4.3. 16.5 19.6 13.9 23.2 12.2 14.7. 8.1 19.1 33.2 24.0 2.8 12.8. 7.0 15.2 30.2 20.7 2.4 24.6. 14.7 17.4 8.4 17.3 1.4 40.9. 8.3 22.1 14.3 20.0 0.2 35.2. 8.1 18.1 30.9 22.8 2.6 17.5. Source: Author based on PHS.. The latter is also evident when considering the percentage of employees not covered by labor legislation and social security, defined by insecurity rates, proportion of employees who declare themselves not making contributions to the social security system. While the rate of insecurity is higher for recent immigrants, it is also true that the average informality rate for the entire population remains virtually unchanged when removing migrants, Figure 9. General provisions and child labor legislation often make convenient for employers hiring illegal foreign workers. The need for flexibility to rapidly respond to changes arising from an open and competitive economy and the existence of informal networks that tend to specifically meet the needs of certain segments of the labor market,. 35.
(39) encourage the hiring of foreign workers under no formal conditions. Moreover, outsourcing as standard practice is one of several factors that indicate why the employer prefers undocumented workers. Figure 9 - Labor Legislation Coverage by migratory condition 80 70 60 50 Female. 40. Male. 30 20 10 0 Native. Internal. Border C. No Border C.. Total. Source: Author based on PHS.. Higher informality among immigrants is due to sectoral composition of employment. Immigrants’ jobs are dominated by sectors where labor relations are highly non formal for their intrinsic characteristics (high turnover, a predominance of short-term contracts, and low demand for specific human capital) and because they are the most exposed to macroeconomic shocks. Workforce in precarious conditions is flexible to sectoral shifts, could relocate to activities that grow rapidly but is, on the dark side, the first to be displaced when the activity level decreases. Figure 10 reports the estimate of the marginal effects of the most important covariates on the probability of having labor protection once controlling for all supply and demand factors17. The results are informed separately for females and males with their 95% confidence interval. The likelihood of being informal dramatically increases in migrant´s 17. Regression estimates are reported in Table A‐5 in the Appendix.. 36.
(40) traditional sectors: building or construction sector for men and maid or housekeeping for women. Though not as likely as the former two sectors, retailing also has a positive marginal effect on informality. Border countries immigrants are more likely to find non protected jobs; high levels of human capital have a negative effect on the probability of not having labor legislation protection. On the other hand, internal immigration does not change the probability of informality for women and has a slightly negative effect for males. Figure 10 - Marginal Effect of Selected Variables on the Probability of Being Informal Male. Female. Internal. Internal. Border. Border. College. College. Building. Maid. Retail. Retail -.2. 0 .2 Marginal Effect. .4. -.2. 0 .2 Marginal Effect. .4. Note: Marginal effect and 95% CI Interval. Source: Author based on PHS.. 4.4. Are the immigrants discriminated: the Oaxaca‐Blinder decomposition The study of the employment insertion completes with the immigrants differential income levels and income differentials when. 37.
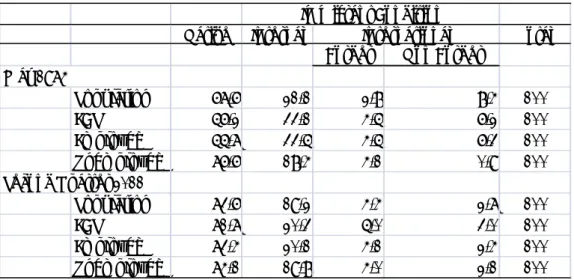
(41) compared to natives. Methodologically, we use total monthly income and use as control not hours but intensity18. Not only median but the whole income distribution differ between groups according to birthplace. Differences encountered however cannot, strictly speaking, be referred as income discrimination as they might be related to sectoral differences of jobs and/or human capital endowments. Figure 11 - Income Distribution by Birthplace Male. Female. Border C.. Border C.. No Border C.. No Border C.. Internal. Internal. Native. Native. 0. 2,000 10th percentile. 4,000. 6,000. 0. 90th percentile. 2,000. 4,000. 10th percentile. Median. 6,000. 90th percentile. Median. Source: Author based on PHS.. The exercise of decomposing income differential for male and female separately is carried out in Table 7. In the top panel we can see the monthly income of each group19. Native males earn 2760 per month 18. Intensity is defined using INDEC´s categorization. Taking as base category the full‐ time employed, we defined as 1 the underemployed no matter is they search or not for another job and 2 the overemployed .. 19. The size of the sample varies depending on the comparison group.. 38.
(42) while female make 1902 for the same time reference. Internal immigrants, both males and females, make more per month than their border-countries counterparts. The percentage differences between the base category (native) and the alternative immigration category are in reported in the ratio line. It could be noticed that the wage gap is always larger for women than for men ranging from 30% in the in case of the native/internal female ratio to 70% in the native/border country female ratio. The same ratios for men are 13% and 39%. Table 7 Wage Gap Oaxaca Decomposition Immigrant Male Internal Border Foreign Income Native. 2762 2762 2762 (390.02) (390.28) (390.03) Immigrant 2438 1993 2321 (188.30) (85.73) (213.87) Ratio 1.133 1.385 1.190 (Nat./Immig.) (2.71) (3.59) (4.19) Decomposition (% of Explained Wage Gap) Endowments 81.3 30.8 58.4 Coefficients 50.7 49.0 55.7 Interaction ‐32.1 20.2 ‐14.1 Total Explained 100 100 100 Unexplained as % of Total 41.1 49.1 51.2 Observations 1897 1551 2038. Immigrant Female Internal Border Foreign 1902 (261.69) 1467 (119.58) 1.297 (3.85). 1902 (261.94) 1113 (75.61) 1.708 (5.51). 1902 (261.70) 1373 (148.43) 1.385 (5.76). 94.5 9.9 ‐4.5 100. 113.9 1.7 ‐15.6 100. 91.2 9.1 ‐0.3 100. 10.9 1419. 2.3 1178. 11.1 1549. Note: exponentiated coefficients; t statistics in parentheses. Source: Author based on PHS.. The second panel decomposes the wage gap into three components. The first line reflects the percentage of the explained gap due to differences in endowments, the return to endowment and the interaction. It is interesting to see than for women endowments explain the main part of the wage gap while this is not true for males. In the latter case differences in both return to endowments and endowments are equally responsible of income differentials. The third line is the interaction term that measures the simultaneous effect of differences in. 39.
(43) endowments and coefficients. Moreover, for men the percentage of the variance unexplained is higher as well20. Figure 12 - The Oaxaca-Blinder Decomposition: Effect of Human Capital on the Native/Immigrant Wage Gap Native. 4500. Female. 4500. Male. Montlhy Income 3000 3500. E C. Native. Native. Immigrant. 2500. Immigrant. 2500. Monthly Income 3000 3500. 4000. Immigrant. E. 2000. C. Native. 1500. 1750. Immigrant. 0. .2. .4 .6 College. .8. 1. 0. .2. .4 .6 College. .8. 1. Source: Author based on PHS.. Figure 12 presents a graphical decomposition for one of the most important covariates in explaining income differentials, education. The graph decomposes the gap with respect to native for male and female immigrants in the left and in the right, respectively. The horizontal axis measures the percentage of persons with College or more by birthcondition with vertical lines at their respective levels. In both cases the Native vertical lines is located at the right with the mean level among Immigrant workers males closer to the Native line than the one for Females. The vertical segment E represents the endowment effect; 20 Age is seldom considered as a proxy to labor market experience. It is arguably. more limited in its explanatory power for women who may interrupt their careers, or reduced their working time when having family.. 40.
(44) segment C depict the return effect. While the characteristics are statistically significant, the return to human capital endowment does not change by migration condition.. 5. Discussion The problem concerning the movement of people has traditionally occupied an important place in shaping society in Argentina, but has regained prominence in recent times by the alleged negative impact external migrants exert on the labor market and on public services and social infrastructure. Historically immigrants have clustered in a small number of geographic areas and the GBA was one of them. This is particularly true for the immigrants originating from two countries, Perú and Paraguay; their national concentrate almost 75% of their respective total in the GBA. The study shows that not only geographical but also sectoral insertion is clustered among migrants. Migrants are overrepresented in the construction, housekeeping and retail sectors which are, in turn, more prone to informality and labor legislation unprotection. Human capital not only decreases the probability of informality but also increases the probability of employment and their incomes. Consistently, immigrants earn less than native being border countries immigrants in worse situation than internal immigrant with respect to that reference group. Female immigrants earn systematically less than their natives counterparts; the wage gap goes from 13% to 71 % percent. There may be several explanations to the wage gap. First, part of the wage gap may be due to the fact immigrants do not possess to the same extent as natives the skills desired and rewarded by employers. On the other hand, the wage differential between natives and immigrants may result from the fact that even identical skills are not rewarded in the same way by employers. Both aspects can be attributed to different factors, like differing abilities and preferences, or discrimination. This paper analyses the extent to which gender differences in human capital contribute to explaining the observable wage differential.. 41.
Figure
+7

Documento similar
Given that human capital endowment is one of the main factors influencing the economic development of a region, the results of this paper provide effective guidelines for reducing
As noted in the recent World Bank study on the Changing Wealth of Nations (Lange et al., 2018), human capital measured as the present value of the future earnings of the labor
In summary, in order to obtain the initial capital (primitive and capital accumulation) and labor (industrial reserve army) for the development of modern industry, for Marx,
Throughout these 20 studies, it was found that female immigrant entrepreneurs face many challenges in sustaining their businesses based on human capital, social capital,
Specifically, different ontogenetic changes can be expected with regard to upper (ribs 1-5) and lower (ribs 6-10) thoracic morphology (see Methods) since
Regional differences in seedling density (Oncala vs Ro- bregordo) are important when analysing the generalised lower presence of PYS seedlings of any species in Robre-
Then, the increase on the rental price of the technology a (with lower capital-labor ratio in cohabitation) is larger than the increase of rental price of the technology b, and the
First, in accord with the theoretical results derived in lower-dimensional instances of the models and simulations on simple networks, the effect of local market size on
